| Param | Original file | Final file |
|---|---|---|
| Filename | modeM0/AS1A10_110T01_9000004104_28568cztM0_level2.evt | modeM0/AS1A10_110T01_9000004104_28568cztM0_level2_quad_clean.evt |
| Size (bytes) | 517,020,480 | 102,499,200 |
| Size | 493.1 MB | 97.8 MB |
| Events in quadrant A | 3,529,903 | 659,012 |
| Events in quadrant B | 3,630,594 | 671,756 |
| Events in quadrant C | 3,679,188 | 638,821 |
| Events in quadrant D | 4,319,215 | 622,776 |
| Mode SS | |||
|---|---|---|---|
| Quadrant | BADHDUFLAG | Total packets | Discarded packets |
| A | 0 | 150 | 0 |
| B | 0 | 150 | 0 |
| C | 0 | 150 | 0 |
| D | 0 | 150 | 0 |
| Mode M0 | |||
|---|---|---|---|
| Quadrant | BADHDUFLAG | Total packets | Discarded packets |
| A | 0 | 15005 | 2 |
| B | 0 | 15220 | 2 |
| C | 0 | 15275 | 3 |
| D | 0 | 17385 | 2 |
| Mode M9 | |||
|---|---|---|---|
| Quadrant | BADHDUFLAG | Total packets | Discarded packets |
| A | 0 | 17 | 0 |
| B | 0 | 17 | 0 |
| C | 0 | 17 | 0 |
| D | 0 | 17 | 0 |
| Quadrant | Total seconds | Saturated seconds | Saturation percentage |
|---|---|---|---|
| A | 7356 | 69 | 0.938010% |
| B | 7357 | 70 | 0.951475% |
| C | 7356 | 96 | 1.305057% |
| D | 7356 | 166 | 2.256661% |
Noise dominated data is calculated using 1-second bins in cleaned event files. If a bin has >2000 counts, and if more than 50% of those come from <1% of pixels, then it is considered to be noise-dominated and hence unusable.
| Quadrant | # 1 sec bins | Bins with >0 counts | Bins with >2000 counts | High rate bins dominated by noise | Noise dominated (total time) | Noise dominated (detector-on time) | Marked lightcurve |
|---|---|---|---|---|---|---|---|
| A | 9021 | 7356 | 0 | 0 | 0.00% | 0.00% | 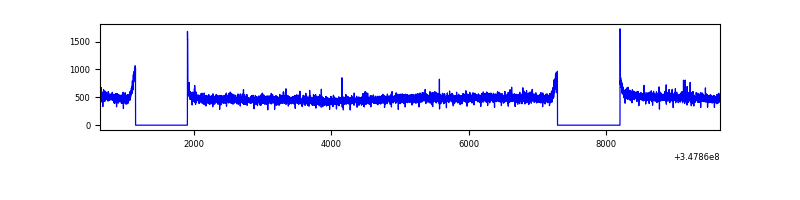 |
| B | 9022 | 7357 | 5 | 5 | 0.06% | 0.07% | 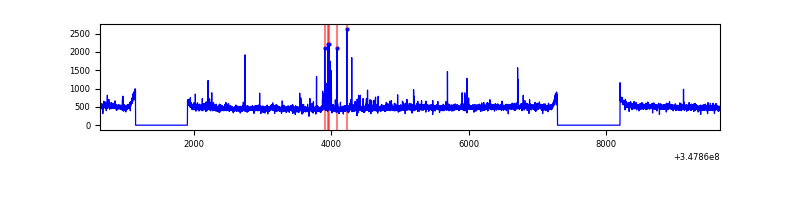 |
| C | 9021 | 7356 | 0 | 0 | 0.00% | 0.00% | 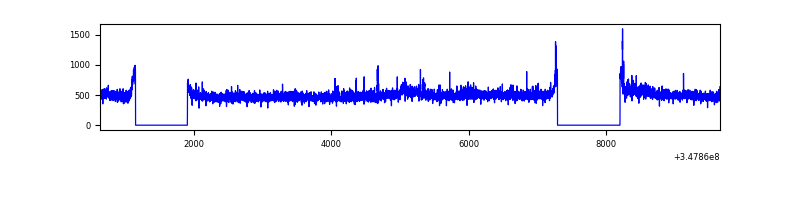 |
| D | 9021 | 7356 | 127 | 127 | 1.41% | 1.73% | 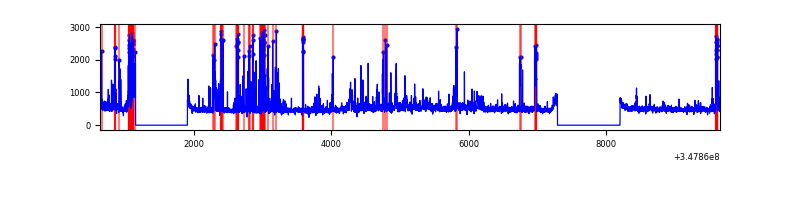 |
Top three noisy pixels from each quadrant. If the there are fewer than three noisy pixels in the level2.evt file, extra rows are filled as -1
| Pixel properties | Quadrant properties | ||||||
|---|---|---|---|---|---|---|---|
| Quadrant | DetID | PixID | Counts | Sigma | Mean | Median | Sigma |
| A | 13 | 254 | 10622 | 52.52 | 912 | 893 | 185.2 |
| A | 8 | 192 | 9919 | 48.72 | 912 | 893 | 185.2 |
| A | 3 | 137 | 8857 | 42.99 | 912 | 893 | 185.2 |
| B | 4 | 171 | 101483 | 579.34 | 896 | 873 | 173.7 |
| B | 12 | 111 | 22067 | 122.04 | 896 | 873 | 173.7 |
| B | 11 | 111 | 20065 | 110.51 | 896 | 873 | 173.7 |
| C | 14 | 238 | 137910 | 667.17 | 869 | 873 | 205.4 |
| C | 7 | 247 | 107857 | 520.86 | 869 | 873 | 205.4 |
| C | 7 | 220 | 17521 | 81.05 | 869 | 873 | 205.4 |
| D | 1 | 52 | 679416 | 3265.92 | 873 | 852 | 207.8 |
| D | 8 | 195 | 254731 | 1221.91 | 873 | 852 | 207.8 |
| D | 2 | 250 | 69744 | 331.58 | 873 | 852 | 207.8 |
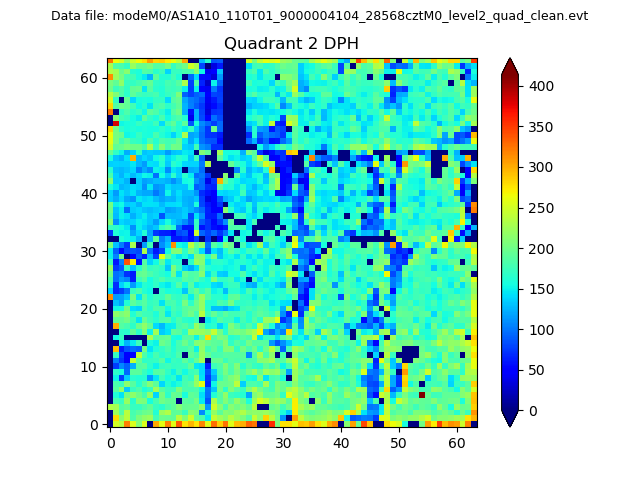
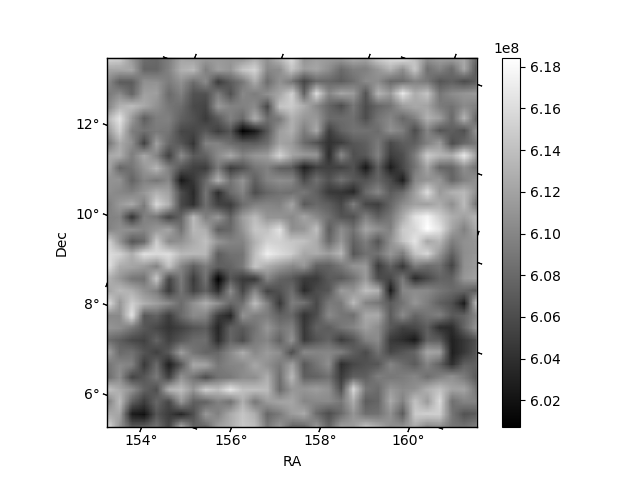
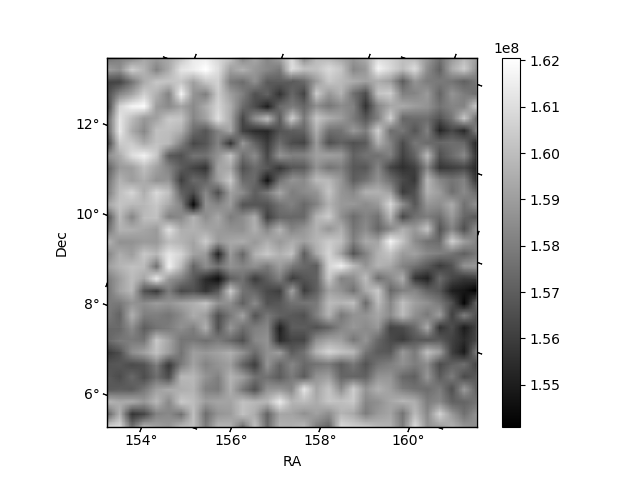
Histogram calculated using DETX and DETY for each event in the final _common_clean file
| Quadrant A | 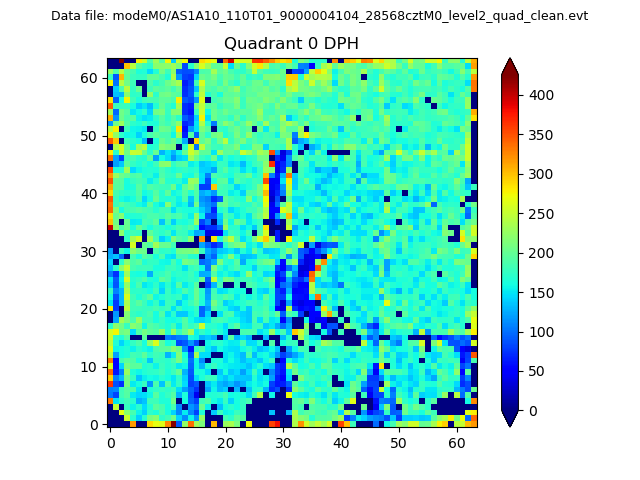 |
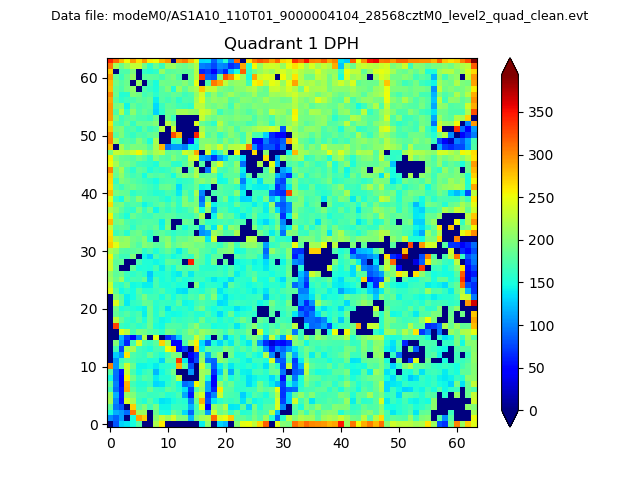 |
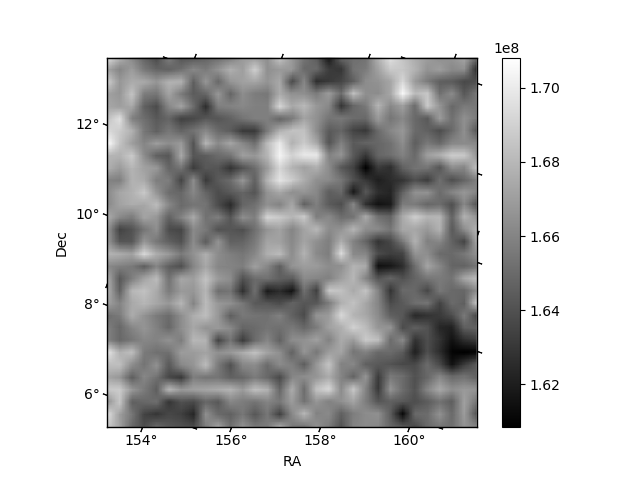
Quadrant B |
|---|---|---|---|
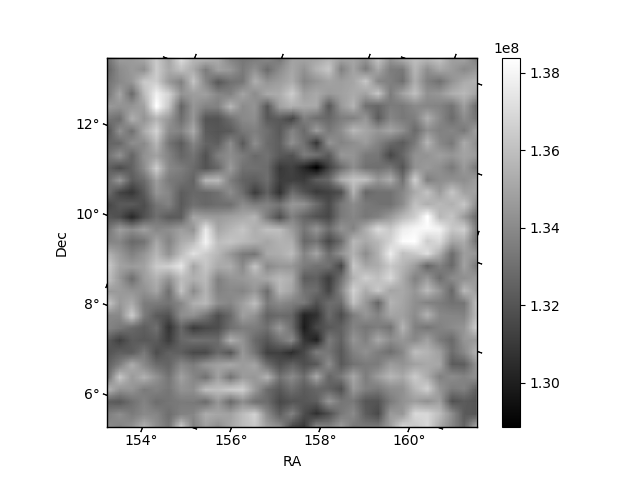
| Quadrant D | 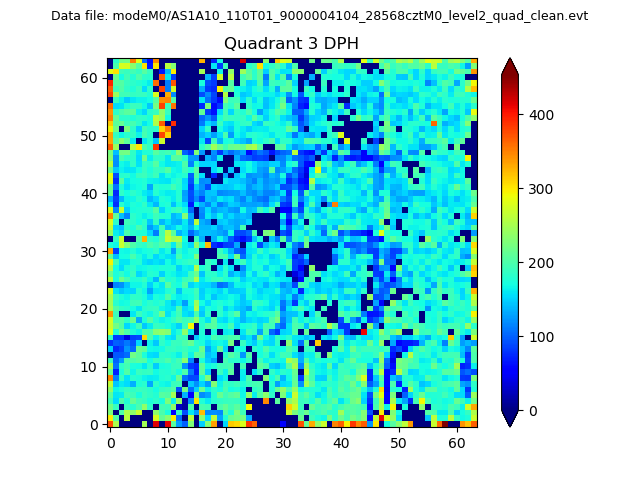 |
 |
Quadrant C |
| Plot type | Count rate plots | Images |
|---|---|---|
| Comparison with Poisson distribution Blue bars denote a histogram of data divided into 1 sec bins. Red curve is a Poisson curve with rate = median count rate of data. |
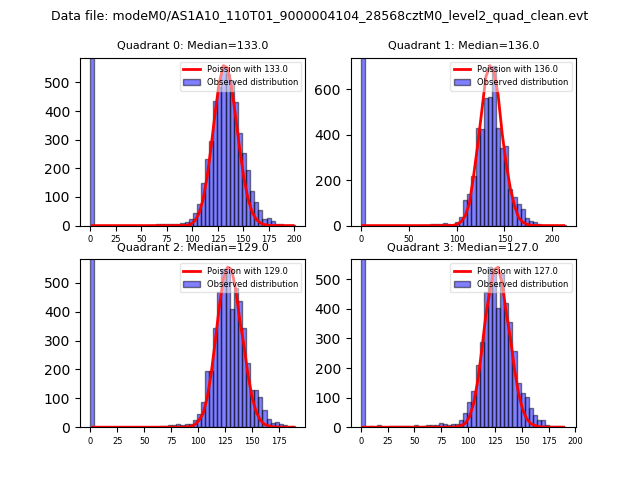 |
 |
| Quadrant-wise count rates Data is divided into 100 sec bins |
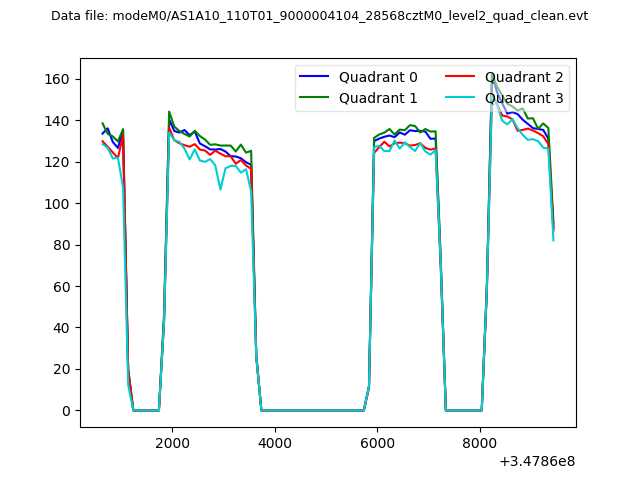 |
|
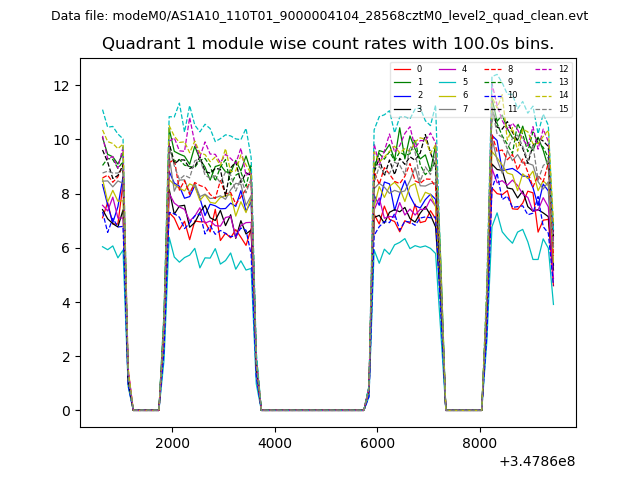
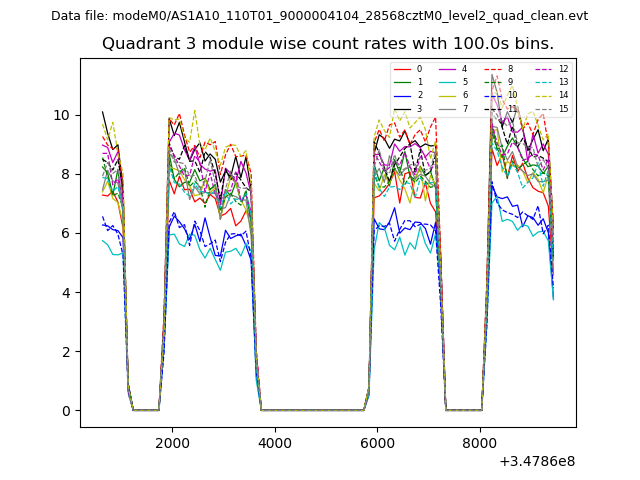
| Module-wise count rates for Quadrant A Data is divided into 100 sec bins |
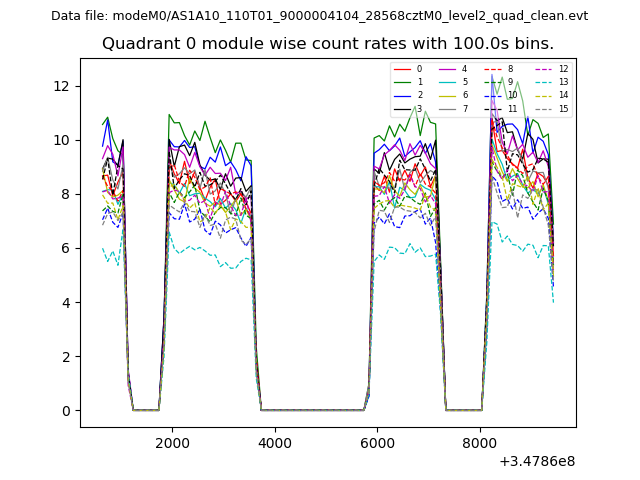 |
 |
| Module-wise count rates for Quadrant B Data is divided into 100 sec bins |
 |
 |
| Module-wise count rates for Quadrant C Data is divided into 100 sec bins |
 |
 |
| Module-wise count rates for Quadrant D Data is divided into 100 sec bins |
 |
 |
| Parameter | Plot |
|---|---|
| CZT HV Monitor | 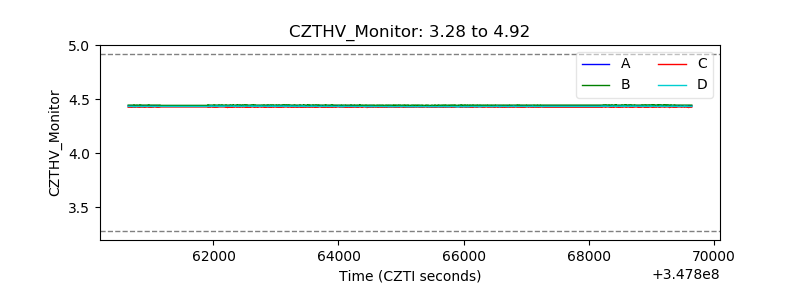 |
| D_VDD | 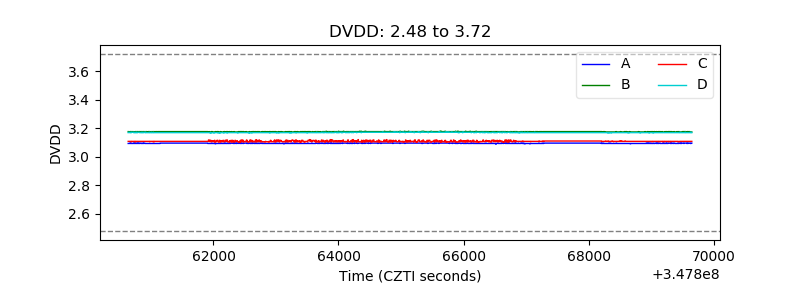 |
| Temperature 1 | 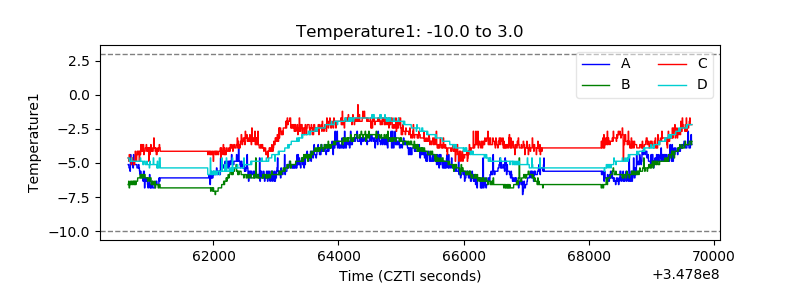 |
| Veto HV Monitor | 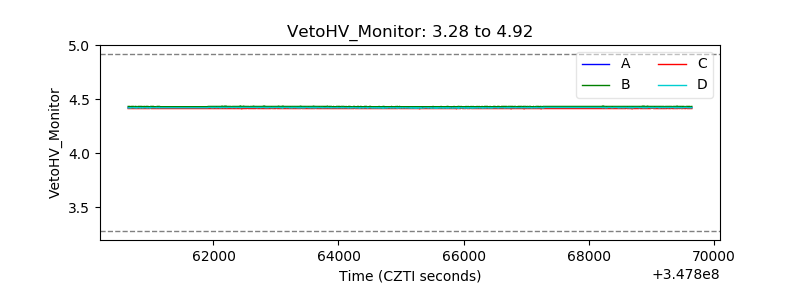 |
| Veto LLD | 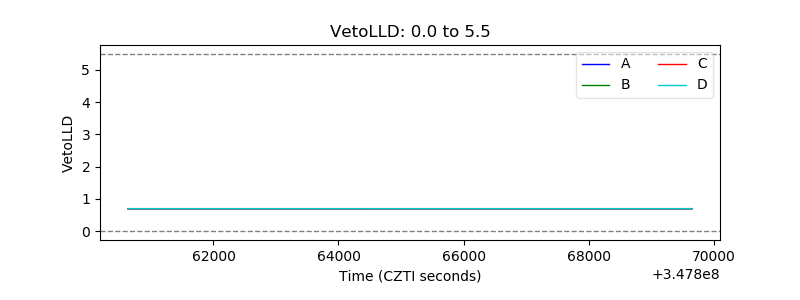 |
| Alpha Counter | 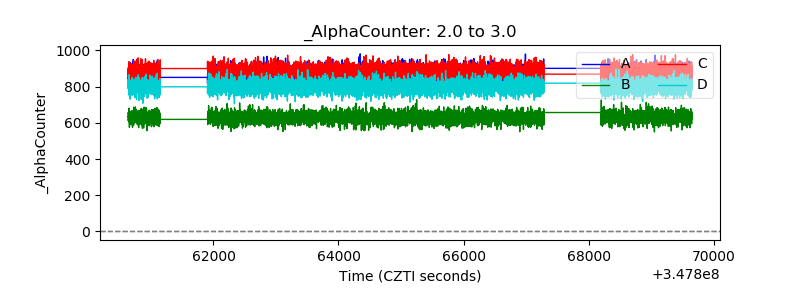 |
| _CPM_Rate | 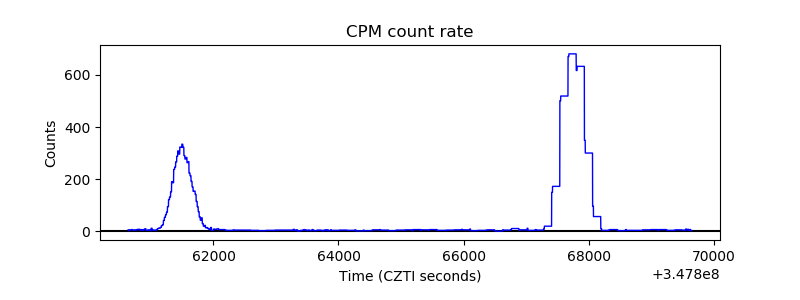 |
| CZT Counter |  |
| +2.5 Volts monitor |  |
| +5 Volts monitor |  |
| _ROLL_ROT | 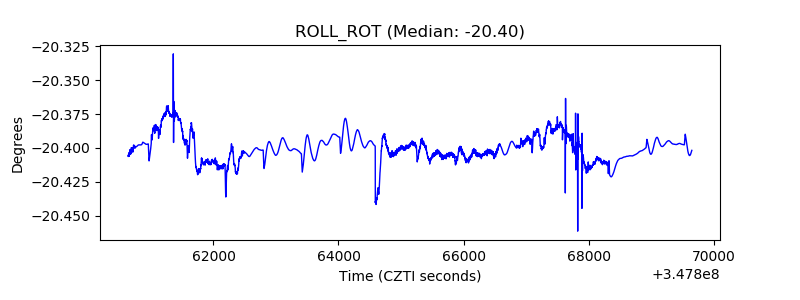 |
| _Roll_DEC | 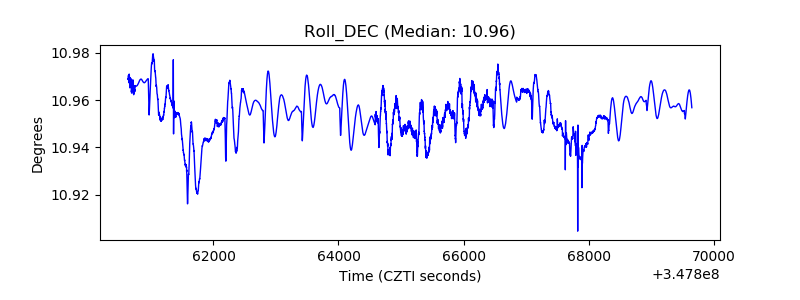 |
| _Roll_RA | 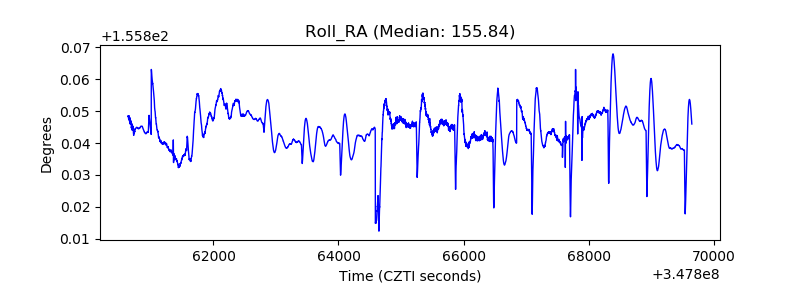 |
| Veto Counter | 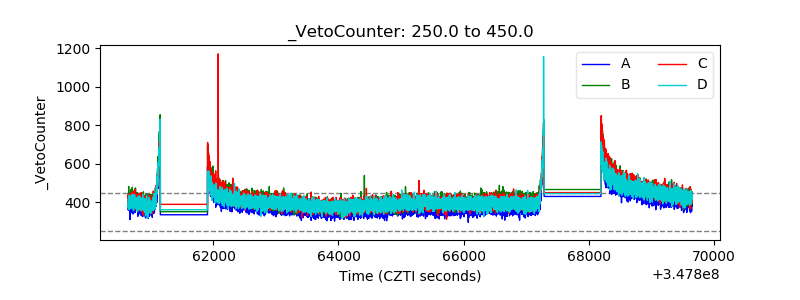 |