| Param | Original file | Final file |
|---|---|---|
| Filename | modeM0/AS1A10_110T01_9000004104_28569cztM0_level2.evt | modeM0/AS1A10_110T01_9000004104_28569cztM0_level2_quad_clean.evt |
| Size (bytes) | 441,982,080 | 71,256,960 |
| Size | 421.5 MB | 68.0 MB |
| Events in quadrant A | 2,900,568 | 444,359 |
| Events in quadrant B | 3,073,156 | 448,430 |
| Events in quadrant C | 2,970,177 | 433,301 |
| Events in quadrant D | 4,043,280 | 421,894 |
| Mode SS | |||
|---|---|---|---|
| Quadrant | BADHDUFLAG | Total packets | Discarded packets |
| A | 0 | 118 | 0 |
| B | 0 | 118 | 0 |
| C | 0 | 118 | 0 |
| D | 0 | 118 | 0 |
| Mode M0 | |||
|---|---|---|---|
| Quadrant | BADHDUFLAG | Total packets | Discarded packets |
| A | 0 | 12201 | 0 |
| B | 0 | 12669 | 0 |
| C | 0 | 12290 | 0 |
| D | 0 | 15682 | 0 |
| Mode M9 | |||
|---|---|---|---|
| Quadrant | BADHDUFLAG | Total packets | Discarded packets |
| A | 0 | 11 | 0 |
| B | 0 | 11 | 0 |
| C | 0 | 11 | 0 |
| D | 0 | 11 | 0 |
| Quadrant | Total seconds | Saturated seconds | Saturation percentage |
|---|---|---|---|
| A | 5865 | 45 | 0.767263% |
| B | 5866 | 89 | 1.517218% |
| C | 5866 | 62 | 1.056938% |
| D | 5866 | 255 | 4.347085% |
Noise dominated data is calculated using 1-second bins in cleaned event files. If a bin has >2000 counts, and if more than 50% of those come from <1% of pixels, then it is considered to be noise-dominated and hence unusable.
| Quadrant | # 1 sec bins | Bins with >0 counts | Bins with >2000 counts | High rate bins dominated by noise | Noise dominated (total time) | Noise dominated (detector-on time) | Marked lightcurve |
|---|---|---|---|---|---|---|---|
| A | 6910 | 5865 | 0 | 0 | 0.00% | 0.00% | 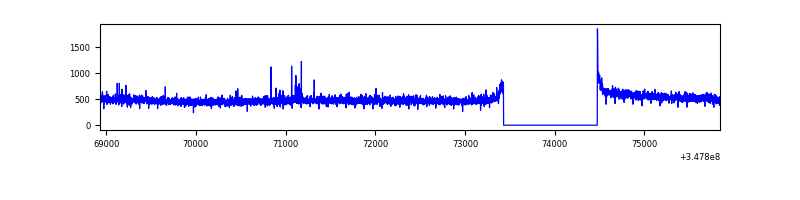 |
| B | 6911 | 5866 | 32 | 32 | 0.46% | 0.55% | 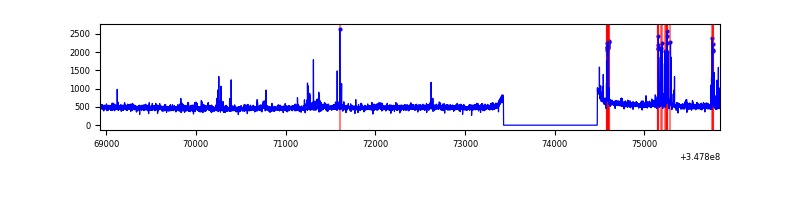 |
| C | 6911 | 5866 | 0 | 0 | 0.00% | 0.00% | 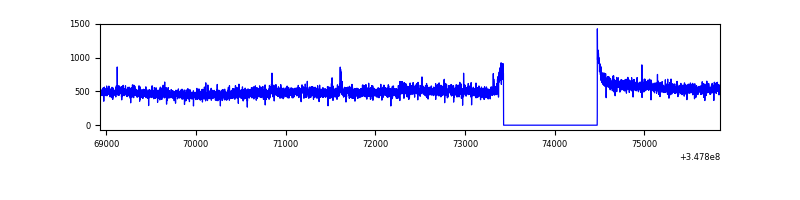 |
| D | 6911 | 5866 | 265 | 265 | 3.83% | 4.52% | 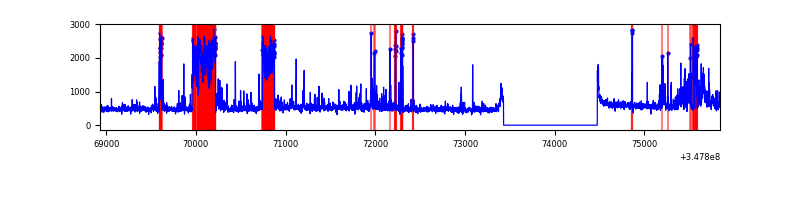 |
Top three noisy pixels from each quadrant. If the there are fewer than three noisy pixels in the level2.evt file, extra rows are filled as -1
| Pixel properties | Quadrant properties | ||||||
|---|---|---|---|---|---|---|---|
| Quadrant | DetID | PixID | Counts | Sigma | Mean | Median | Sigma |
| A | 13 | 254 | 8754 | 52.91 | 747 | 731 | 151.6 |
| A | 14 | 238 | 7824 | 46.78 | 747 | 731 | 151.6 |
| A | 3 | 137 | 7075 | 41.84 | 747 | 731 | 151.6 |
| B | 4 | 171 | 181181 | 1281.68 | 733 | 716 | 140.8 |
| B | 12 | 111 | 17428 | 118.69 | 733 | 716 | 140.8 |
| B | 11 | 111 | 16023 | 108.71 | 733 | 716 | 140.8 |
| C | 14 | 238 | 116291 | 689.23 | 717 | 720 | 167.7 |
| C | 7 | 247 | 54274 | 319.38 | 717 | 720 | 167.7 |
| C | 13 | 61 | 5000 | 25.52 | 717 | 720 | 167.7 |
| D | 8 | 195 | 713966 | 4108.35 | 720 | 702 | 173.6 |
| D | 1 | 52 | 549786 | 3162.68 | 720 | 702 | 173.6 |
| D | 2 | 250 | 39265 | 222.12 | 720 | 702 | 173.6 |
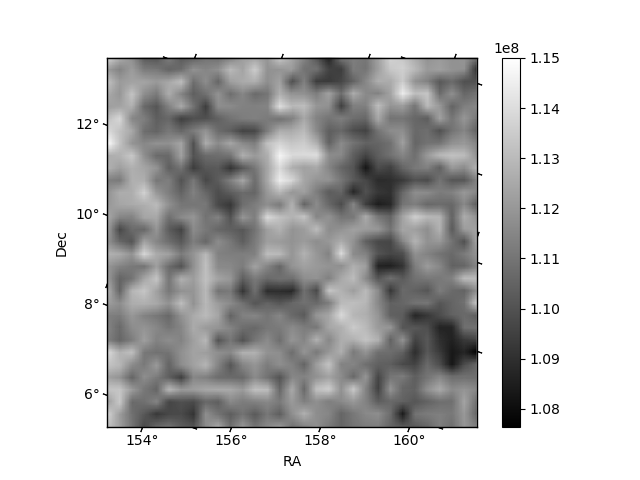
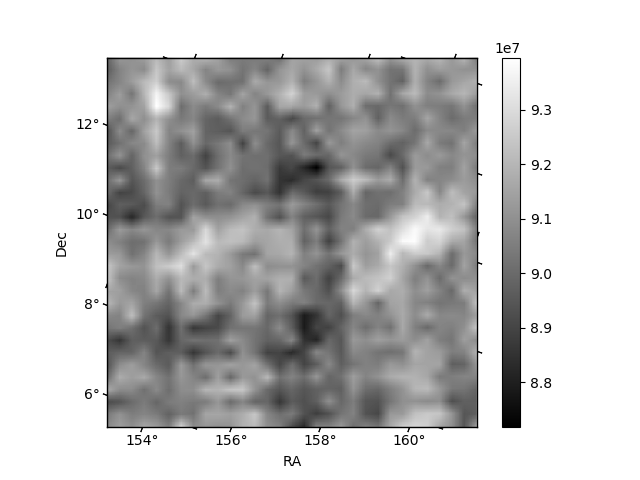
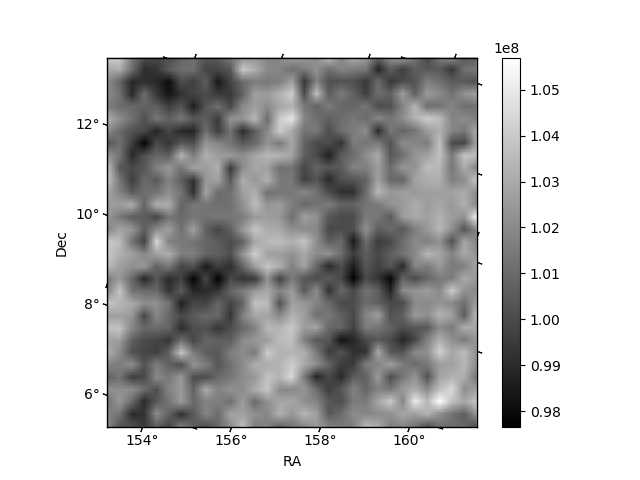
Histogram calculated using DETX and DETY for each event in the final _common_clean file
| Quadrant A |  |
 |
Quadrant B |
|---|---|---|---|
| Quadrant D |  |
 |
Quadrant C |
| Plot type | Count rate plots | Images |
|---|---|---|
| Comparison with Poisson distribution Blue bars denote a histogram of data divided into 1 sec bins. Red curve is a Poisson curve with rate = median count rate of data. |
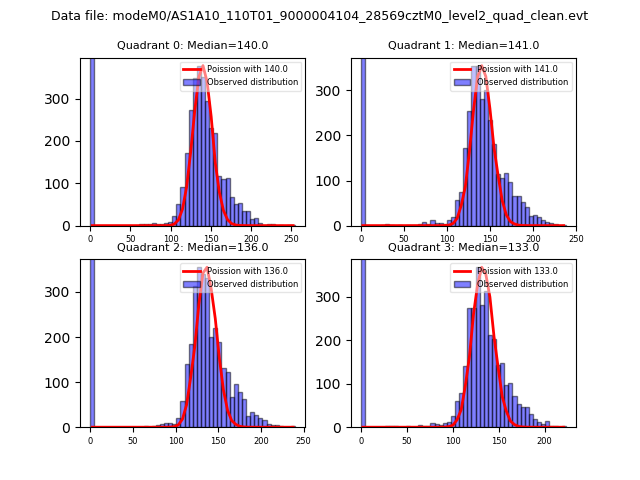 |
 |
| Quadrant-wise count rates Data is divided into 100 sec bins |
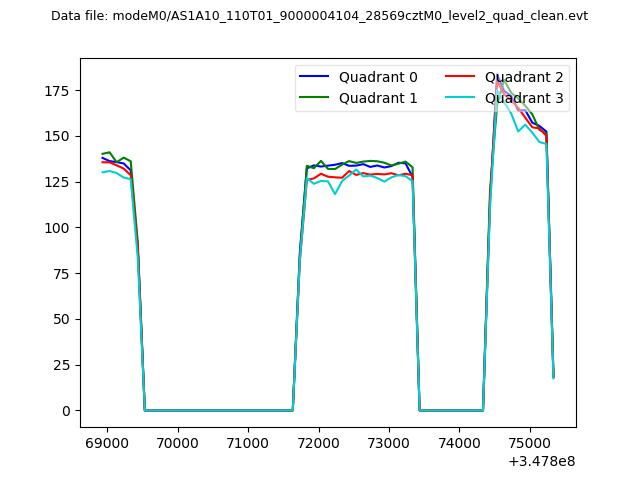 |
|
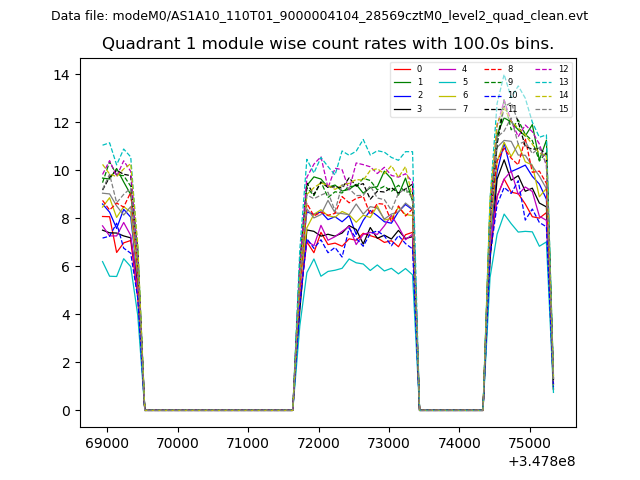
| Module-wise count rates for Quadrant A Data is divided into 100 sec bins |
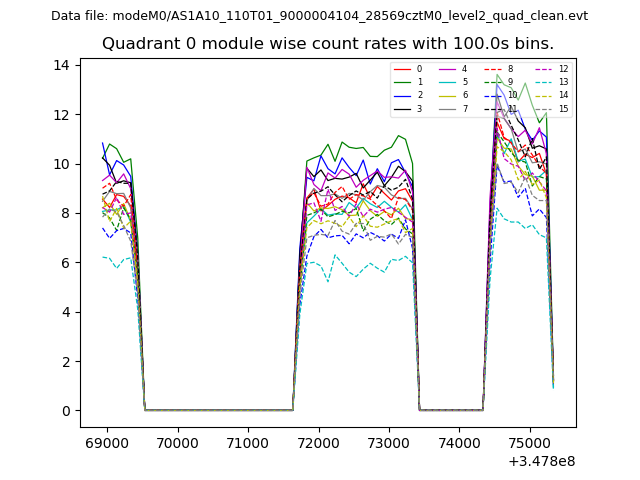 |
 |
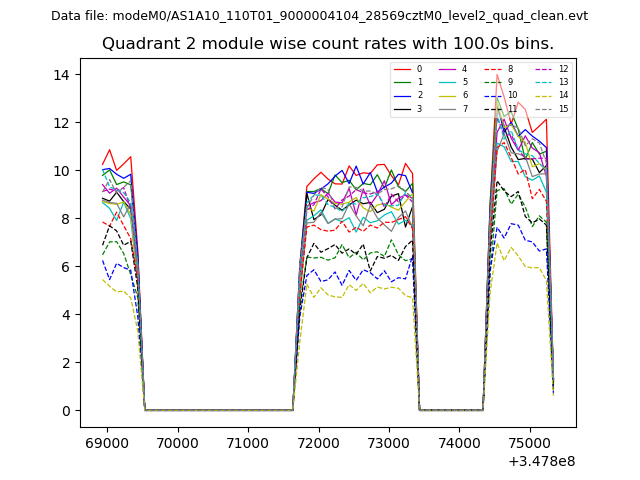
| Module-wise count rates for Quadrant B Data is divided into 100 sec bins |
 |
 |
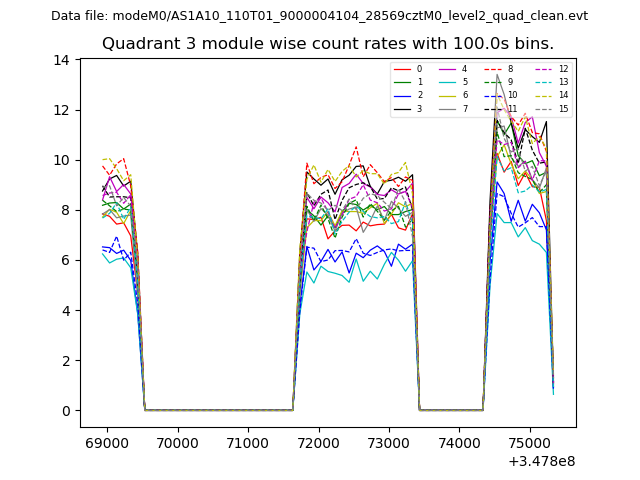
| Module-wise count rates for Quadrant C Data is divided into 100 sec bins |
 |
 |
| Module-wise count rates for Quadrant D Data is divided into 100 sec bins |
 |
 |
| Parameter | Plot |
|---|---|
| CZT HV Monitor | 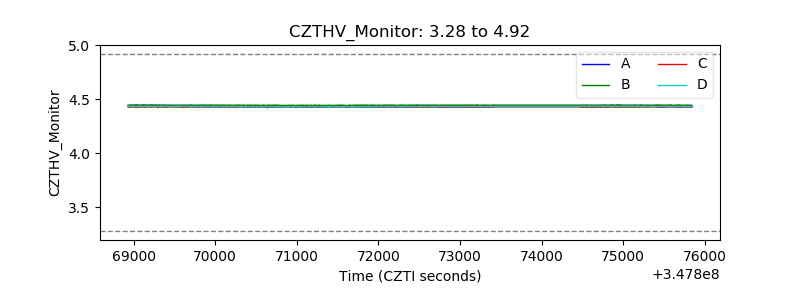 |
| D_VDD | 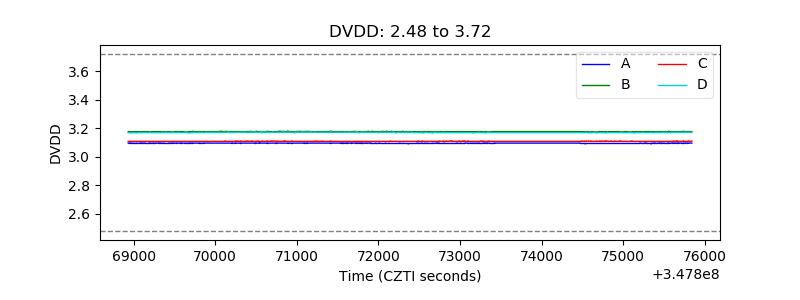 |
| Temperature 1 | 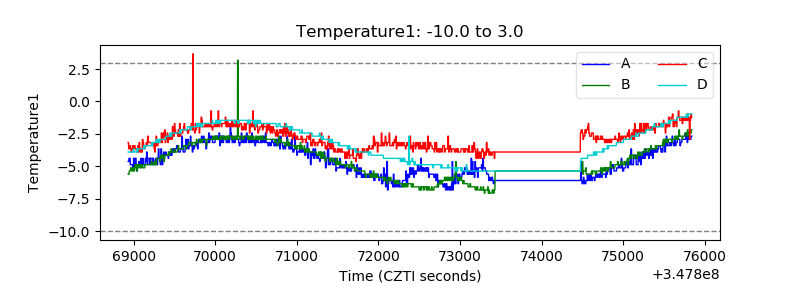 |
| Veto HV Monitor |  |
| Veto LLD | 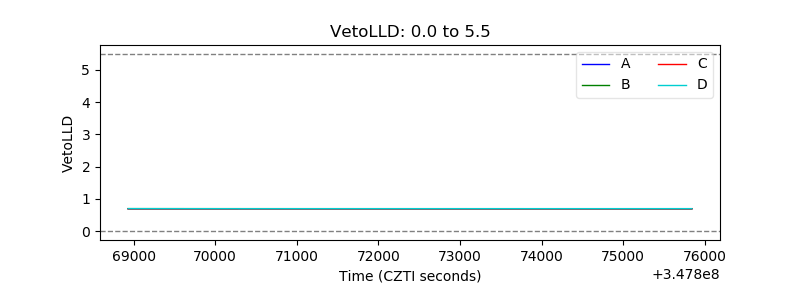 |
| Alpha Counter | 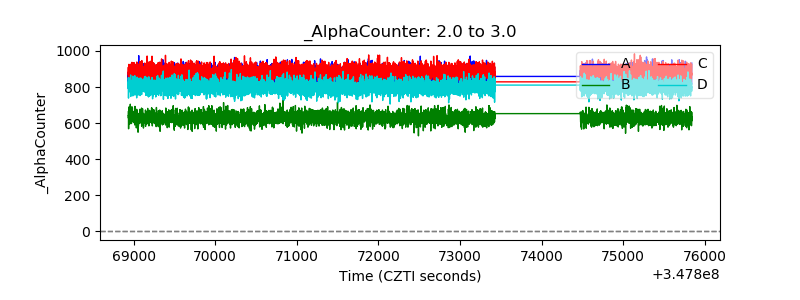 |
| _CPM_Rate | 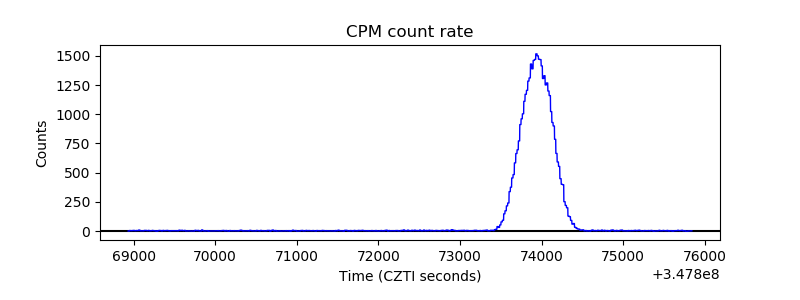 |
| CZT Counter |  |
| +2.5 Volts monitor |  |
| +5 Volts monitor | 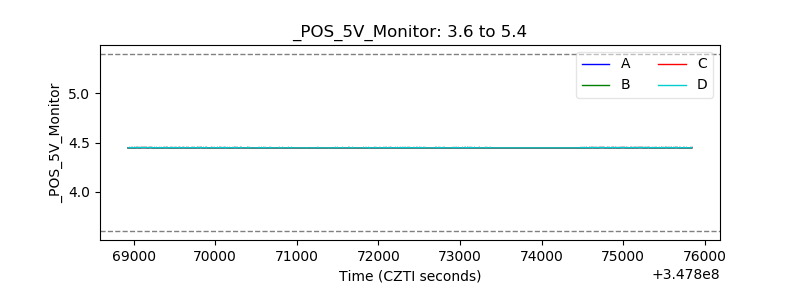 |
| _ROLL_ROT | 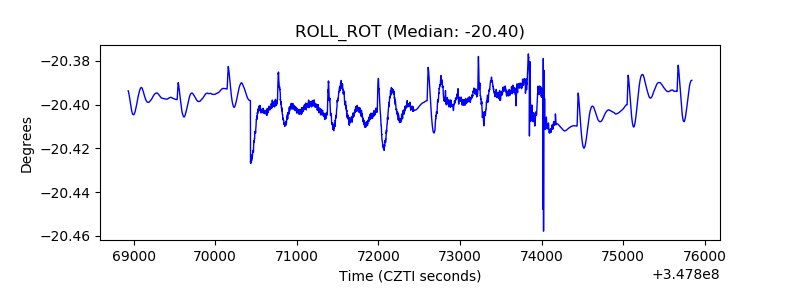 |
| _Roll_DEC |  |
| _Roll_RA | 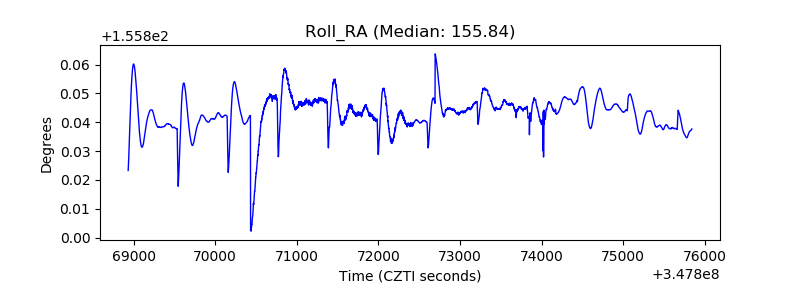 |
| Veto Counter | 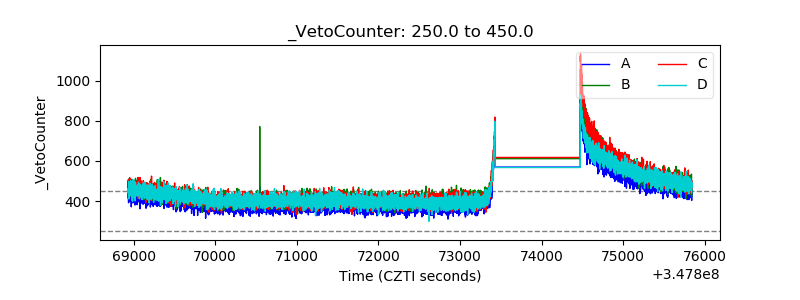 |