| Param | Original file | Final file |
|---|---|---|
| Filename | modeM0/AS1A10_110T01_9000004104_28571cztM0_level2.evt | modeM0/AS1A10_110T01_9000004104_28571cztM0_level2_quad_clean.evt |
| Size (bytes) | 577,984,320 | 67,884,480 |
| Size | 551.2 MB | 64.7 MB |
| Events in quadrant A | 3,091,562 | 428,324 |
| Events in quadrant B | 3,492,908 | 430,394 |
| Events in quadrant C | 3,201,484 | 416,161 |
| Events in quadrant D | 7,315,124 | 364,438 |
| Mode SS | |||
|---|---|---|---|
| Quadrant | BADHDUFLAG | Total packets | Discarded packets |
| A | 0 | 122 | 0 |
| B | 0 | 122 | 0 |
| C | 0 | 122 | 0 |
| D | 0 | 122 | 0 |
| Mode M0 | |||
|---|---|---|---|
| Quadrant | BADHDUFLAG | Total packets | Discarded packets |
| A | 0 | 12818 | 1 |
| B | 0 | 14053 | 1 |
| C | 0 | 13047 | 1 |
| D | 0 | 25774 | 1 |
| Mode M9 | |||
|---|---|---|---|
| Quadrant | BADHDUFLAG | Total packets | Discarded packets |
| A | 0 | 11 | 0 |
| B | 0 | 11 | 0 |
| C | 0 | 11 | 0 |
| D | 0 | 11 | 0 |
| Quadrant | Total seconds | Saturated seconds | Saturation percentage |
|---|---|---|---|
| A | 5950 | 73 | 1.226891% |
| B | 5950 | 157 | 2.638655% |
| C | 5950 | 106 | 1.781513% |
| D | 5950 | 1348 | 22.655462% |
Noise dominated data is calculated using 1-second bins in cleaned event files. If a bin has >2000 counts, and if more than 50% of those come from <1% of pixels, then it is considered to be noise-dominated and hence unusable.
| Quadrant | # 1 sec bins | Bins with >0 counts | Bins with >2000 counts | High rate bins dominated by noise | Noise dominated (total time) | Noise dominated (detector-on time) | Marked lightcurve |
|---|---|---|---|---|---|---|---|
| A | 7095 | 5950 | 1 | 1 | 0.01% | 0.02% | 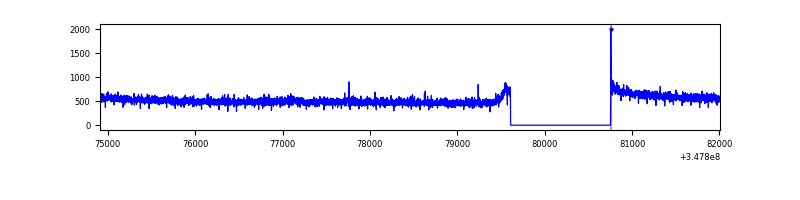 |
| B | 7095 | 5950 | 58 | 58 | 0.82% | 0.97% | 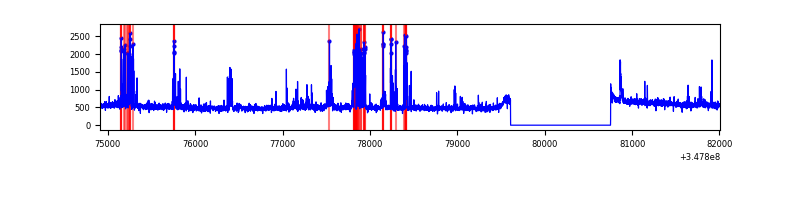 |
| C | 7095 | 5950 | 6 | 6 | 0.08% | 0.10% | 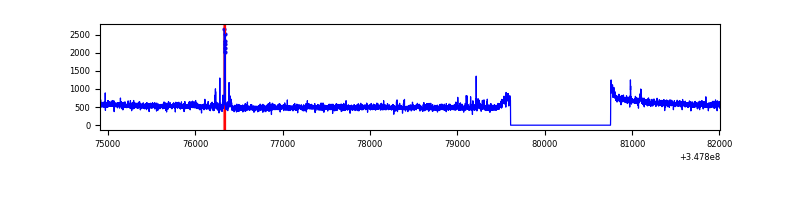 |
| D | 7094 | 5949 | 1245 | 1245 | 17.55% | 20.93% | 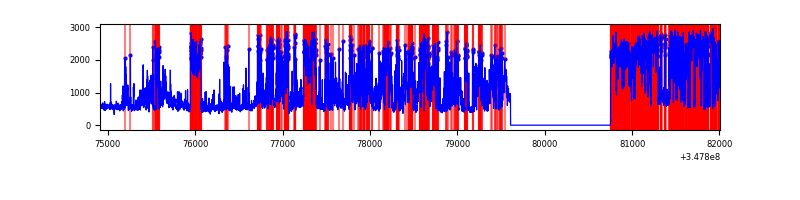 |
Top three noisy pixels from each quadrant. If the there are fewer than three noisy pixels in the level2.evt file, extra rows are filled as -1
| Pixel properties | Quadrant properties | ||||||
|---|---|---|---|---|---|---|---|
| Quadrant | DetID | PixID | Counts | Sigma | Mean | Median | Sigma |
| A | 10 | 67 | 10504 | 60.57 | 798 | 783 | 160.5 |
| A | 13 | 254 | 9102 | 51.83 | 798 | 783 | 160.5 |
| A | 3 | 137 | 7344 | 40.88 | 798 | 783 | 160.5 |
| B | 4 | 171 | 345998 | 2303.61 | 782 | 764 | 149.9 |
| B | 15 | 33 | 40394 | 264.44 | 782 | 764 | 149.9 |
| B | 12 | 111 | 17972 | 114.82 | 782 | 764 | 149.9 |
| C | 14 | 238 | 124438 | 688.01 | 767 | 773 | 179.7 |
| C | 7 | 247 | 80332 | 442.63 | 767 | 773 | 179.7 |
| C | 0 | 10 | 6069 | 29.46 | 767 | 773 | 179.7 |
| D | 1 | 52 | 3839471 | 22676.93 | 706 | 687 | 169.3 |
| D | 8 | 195 | 473251 | 2791.59 | 706 | 687 | 169.3 |
| D | 2 | 250 | 297651 | 1754.26 | 706 | 687 | 169.3 |
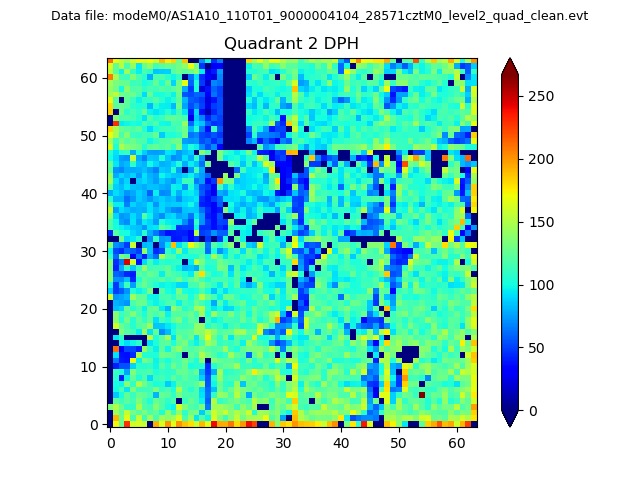
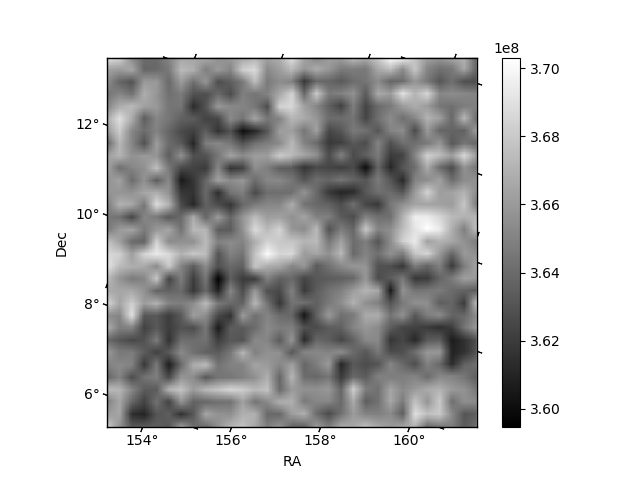
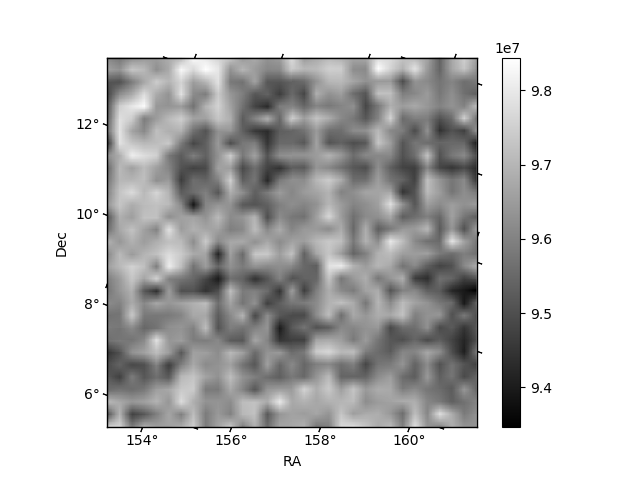
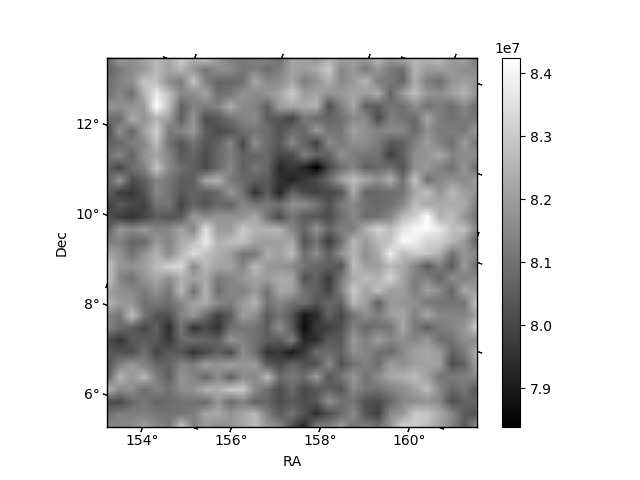
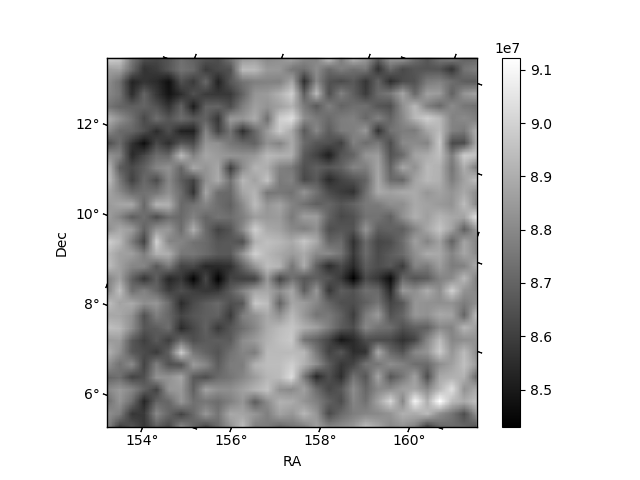
Histogram calculated using DETX and DETY for each event in the final _common_clean file
| Quadrant A | 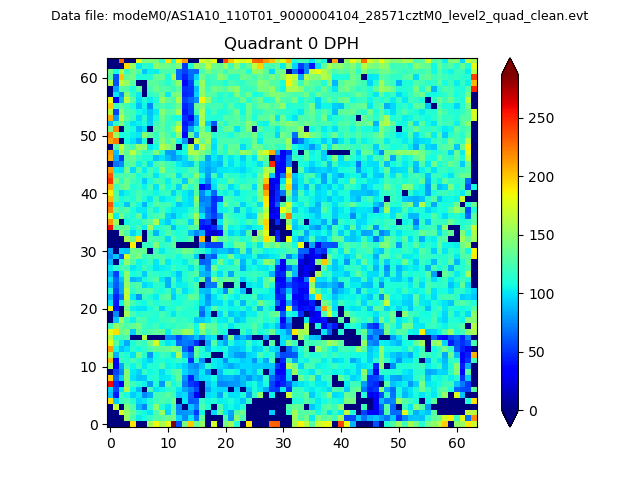 |
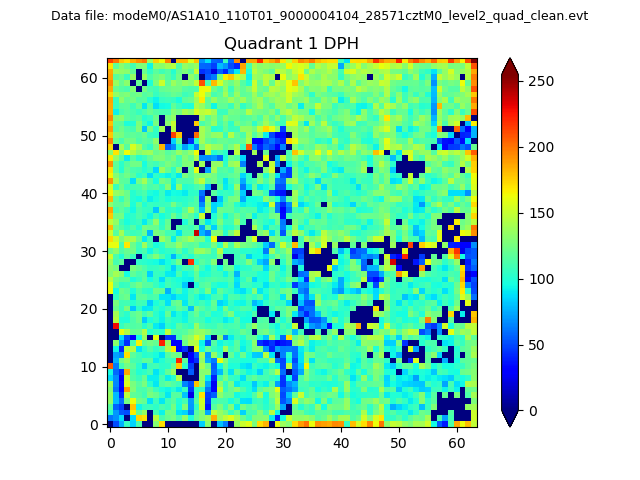 |
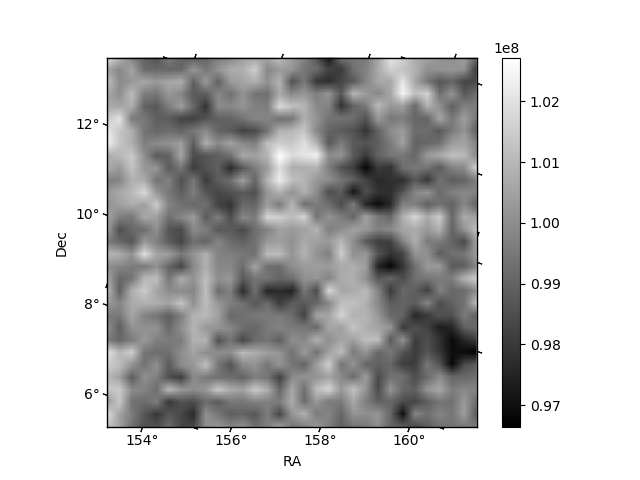
Quadrant B |
|---|---|---|---|
| Quadrant D | 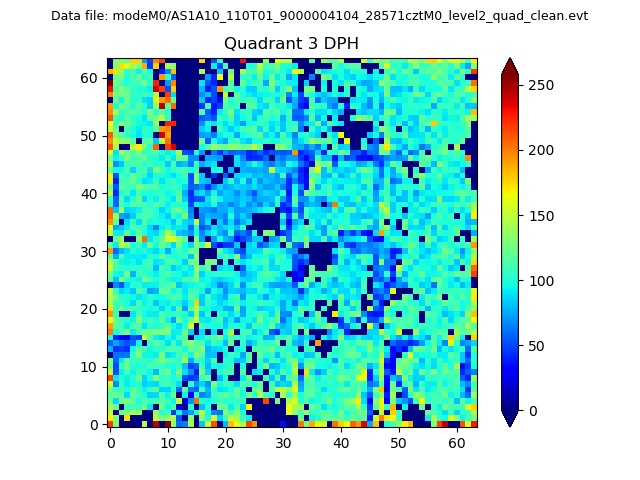 |
 |
Quadrant C |
| Plot type | Count rate plots | Images |
|---|---|---|
| Comparison with Poisson distribution Blue bars denote a histogram of data divided into 1 sec bins. Red curve is a Poisson curve with rate = median count rate of data. |
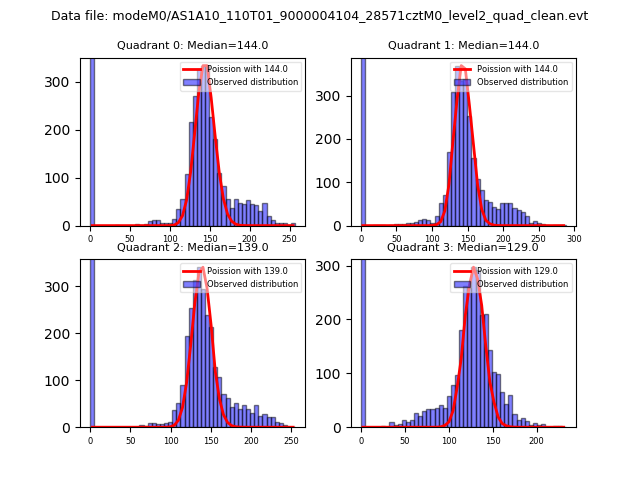 |
 |
| Quadrant-wise count rates Data is divided into 100 sec bins |
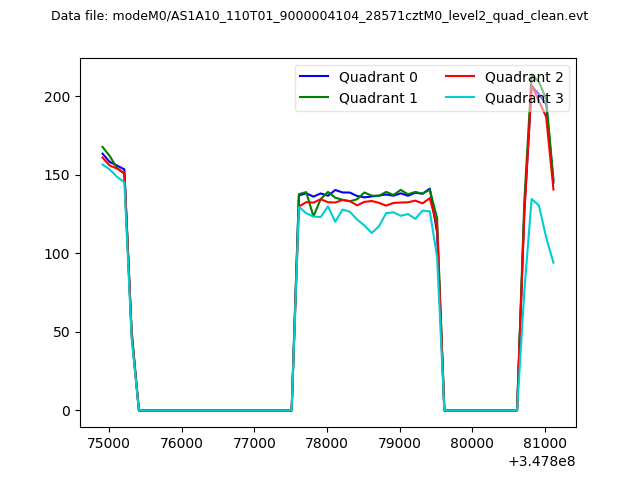 |
|
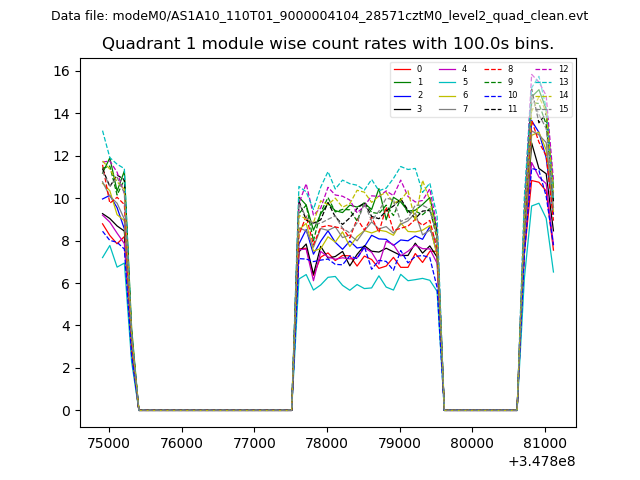
| Module-wise count rates for Quadrant A Data is divided into 100 sec bins |
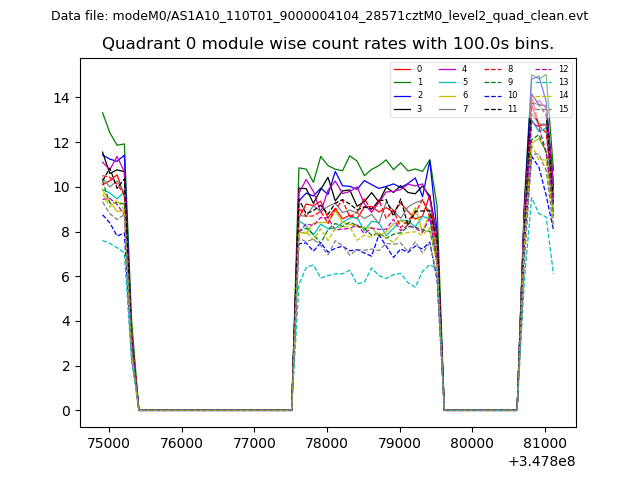 |
 |
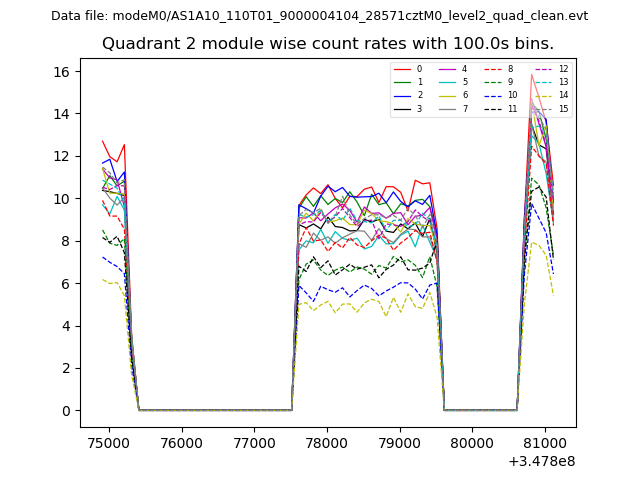
| Module-wise count rates for Quadrant B Data is divided into 100 sec bins |
 |
 |
| Module-wise count rates for Quadrant C Data is divided into 100 sec bins |
 |
 |
| Module-wise count rates for Quadrant D Data is divided into 100 sec bins |
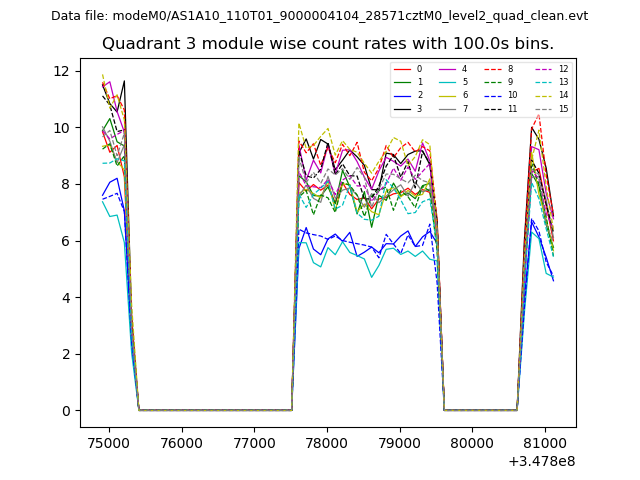 |
 |
| Parameter | Plot |
|---|---|
| CZT HV Monitor | 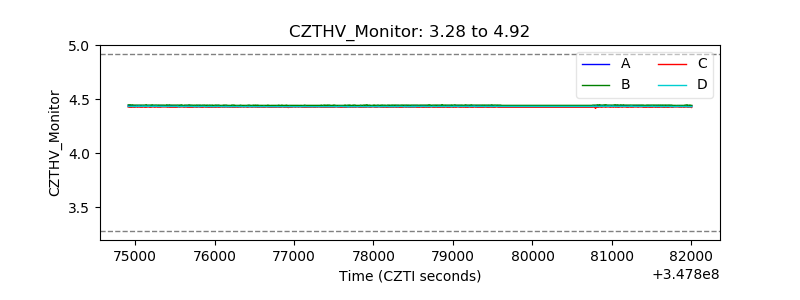 |
| D_VDD | 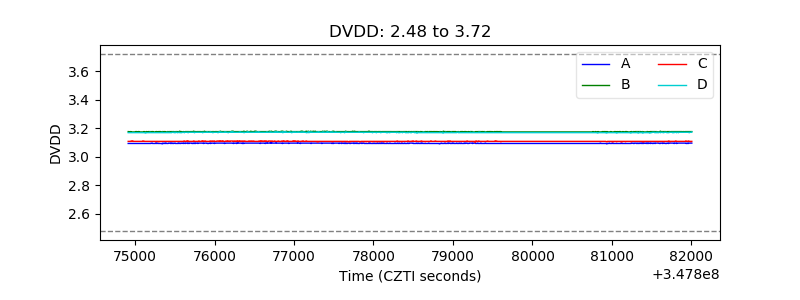 |
| Temperature 1 | 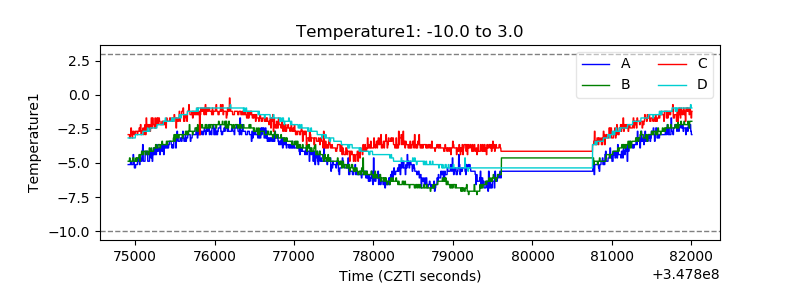 |
| Veto HV Monitor | 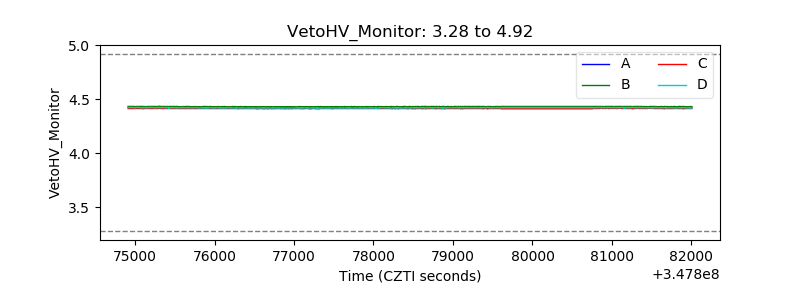 |
| Veto LLD | 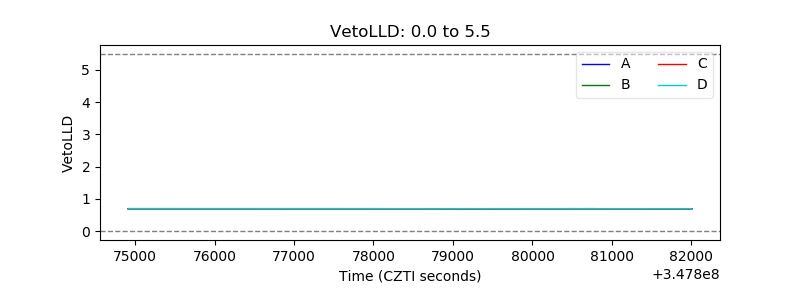 |
| Alpha Counter | 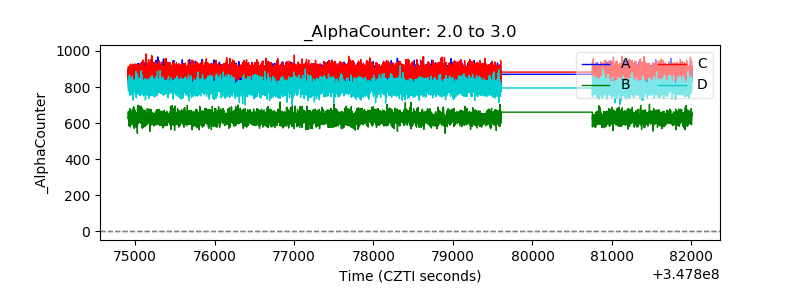 |
| _CPM_Rate | 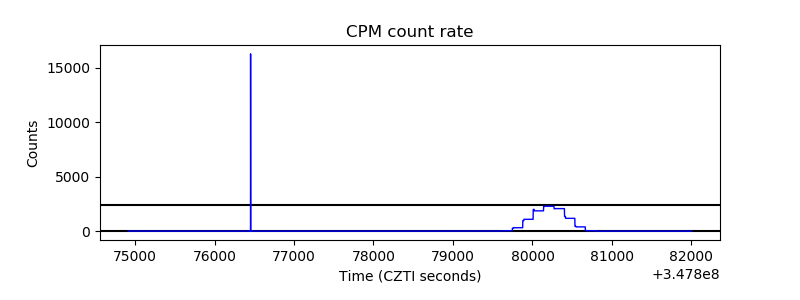 |
| CZT Counter | 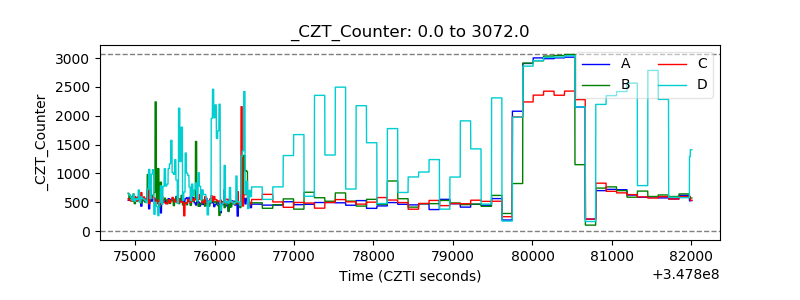 |
| +2.5 Volts monitor |  |
| +5 Volts monitor |  |
| _ROLL_ROT | 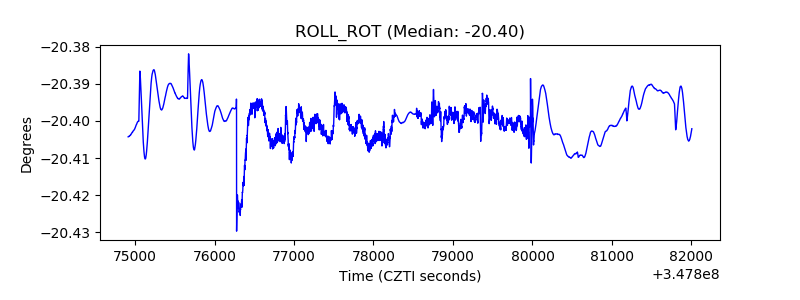 |
| _Roll_DEC | 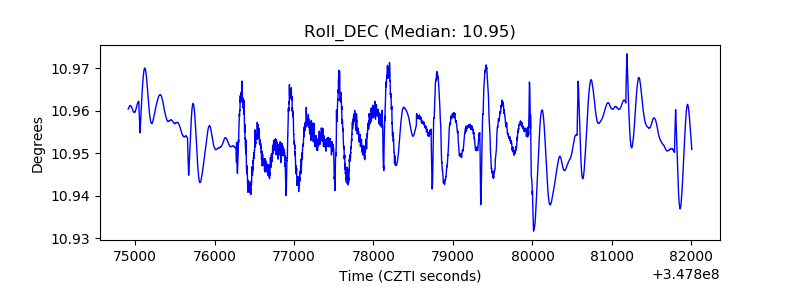 |
| _Roll_RA | 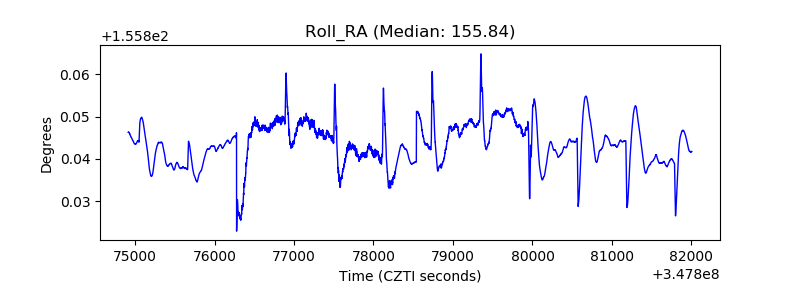 |
| Veto Counter | 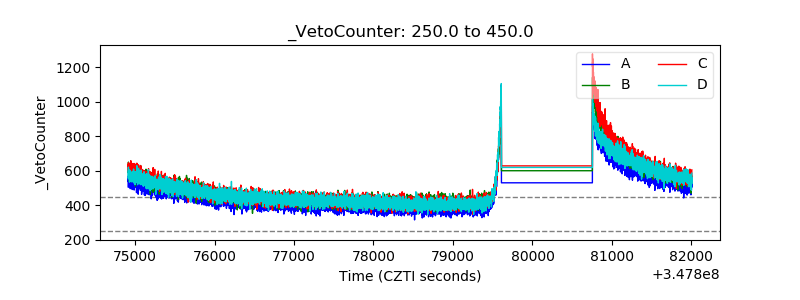 |