| Param | Original file | Final file |
|---|---|---|
| Filename | modeM0/AS1A10_110T01_9000004104_28572cztM0_level2.evt | modeM0/AS1A10_110T01_9000004104_28572cztM0_level2_quad_clean.evt |
| Size (bytes) | 623,013,120 | 67,173,120 |
| Size | 594.2 MB | 64.1 MB |
| Events in quadrant A | 3,546,623 | 411,541 |
| Events in quadrant B | 3,866,637 | 415,290 |
| Events in quadrant C | 3,637,821 | 400,245 |
| Events in quadrant D | 7,380,863 | 357,037 |
| Mode SS | |||
|---|---|---|---|
| Quadrant | BADHDUFLAG | Total packets | Discarded packets |
| A | 0 | 130 | 0 |
| B | 0 | 130 | 0 |
| C | 0 | 130 | 0 |
| D | 0 | 130 | 0 |
| Mode M0 | |||
|---|---|---|---|
| Quadrant | BADHDUFLAG | Total packets | Discarded packets |
| A | 0 | 14629 | 1 |
| B | 0 | 15668 | 1 |
| C | 0 | 14890 | 1 |
| D | 0 | 26482 | 1 |
| Mode M9 | |||
|---|---|---|---|
| Quadrant | BADHDUFLAG | Total packets | Discarded packets |
| A | 0 | 13 | 0 |
| B | 0 | 13 | 0 |
| C | 0 | 13 | 0 |
| D | 0 | 13 | 0 |
| Quadrant | Total seconds | Saturated seconds | Saturation percentage |
|---|---|---|---|
| A | 6444 | 71 | 1.101800% |
| B | 6445 | 102 | 1.582622% |
| C | 6445 | 102 | 1.582622% |
| D | 6445 | 1436 | 22.280838% |
Noise dominated data is calculated using 1-second bins in cleaned event files. If a bin has >2000 counts, and if more than 50% of those come from <1% of pixels, then it is considered to be noise-dominated and hence unusable.
| Quadrant | # 1 sec bins | Bins with >0 counts | Bins with >2000 counts | High rate bins dominated by noise | Noise dominated (total time) | Noise dominated (detector-on time) | Marked lightcurve |
|---|---|---|---|---|---|---|---|
| A | 7699 | 6444 | 0 | 0 | 0.00% | 0.00% | 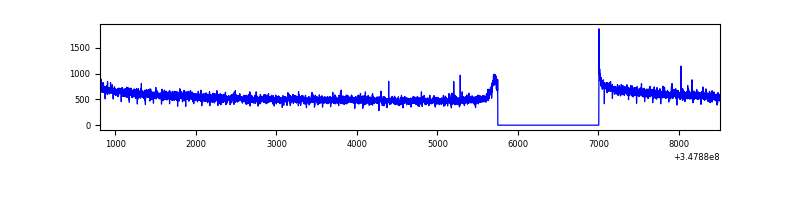 |
| B | 7700 | 6445 | 8 | 8 | 0.10% | 0.12% | 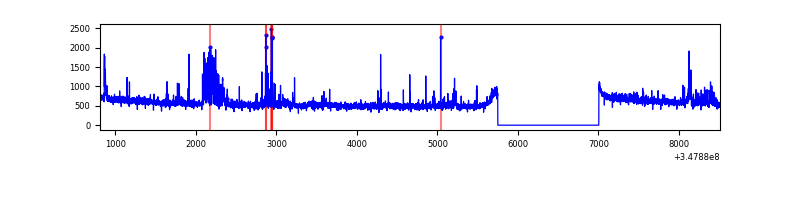 |
| C | 7700 | 6445 | 0 | 0 | 0.00% | 0.00% | 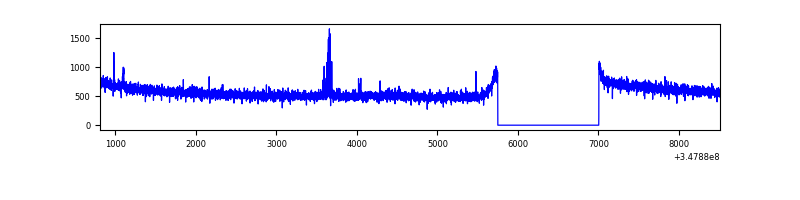 |
| D | 7700 | 6445 | 1196 | 1196 | 15.53% | 18.56% | 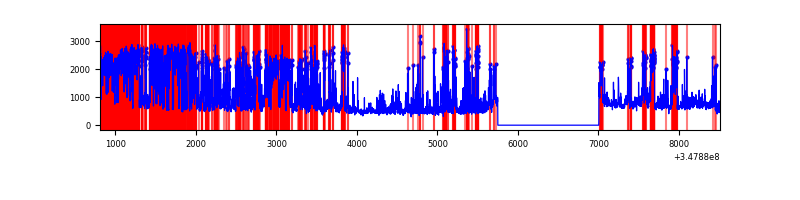 |
Top three noisy pixels from each quadrant. If the there are fewer than three noisy pixels in the level2.evt file, extra rows are filled as -1
| Pixel properties | Quadrant properties | ||||||
|---|---|---|---|---|---|---|---|
| Quadrant | DetID | PixID | Counts | Sigma | Mean | Median | Sigma |
| A | 13 | 254 | 9397 | 46.54 | 918 | 906 | 182.4 |
| A | 3 | 137 | 8018 | 38.98 | 918 | 906 | 182.4 |
| A | 0 | 226 | 7752 | 37.53 | 918 | 906 | 182.4 |
| B | 15 | 33 | 212323 | 1243.79 | 903 | 883 | 170.0 |
| B | 4 | 171 | 58520 | 339.05 | 903 | 883 | 170.0 |
| B | 10 | 247 | 37073 | 212.89 | 903 | 883 | 170.0 |
| C | 14 | 238 | 144570 | 704.09 | 885 | 894 | 204.1 |
| C | 10 | 22 | 24736 | 116.84 | 885 | 894 | 204.1 |
| C | 7 | 247 | 20542 | 96.29 | 885 | 894 | 204.1 |
| D | 1 | 52 | 4138324 | 21736.23 | 813 | 796 | 190.4 |
| D | 8 | 195 | 108405 | 565.32 | 813 | 796 | 190.4 |
| D | 2 | 250 | 45535 | 235.03 | 813 | 796 | 190.4 |
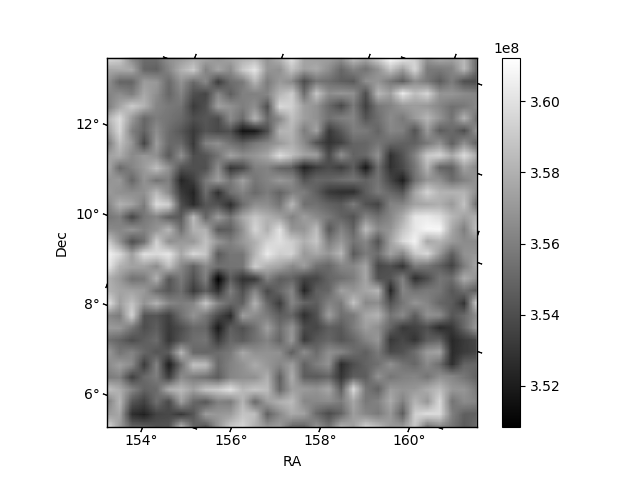
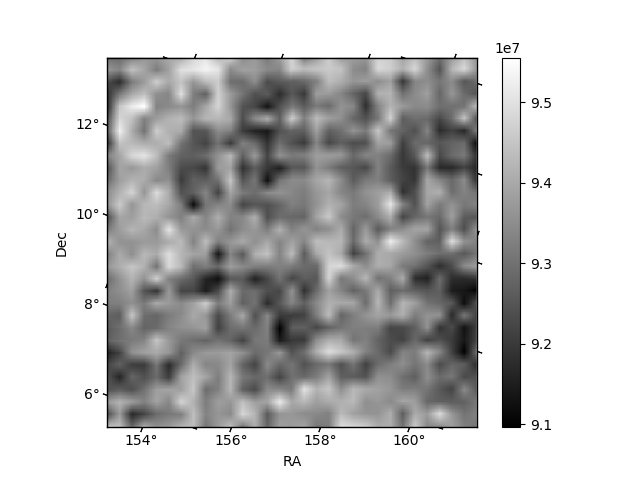
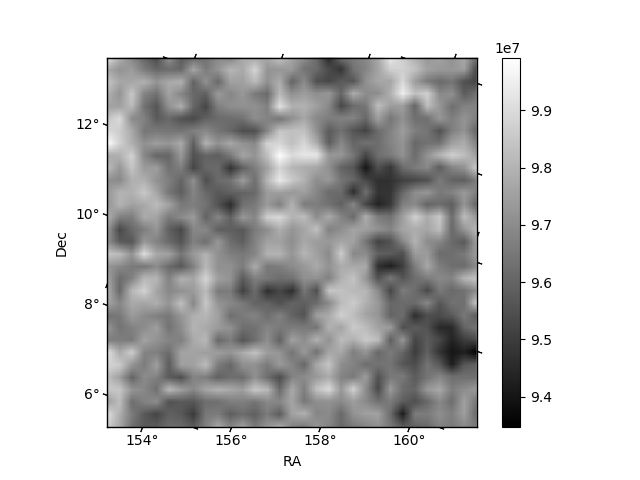
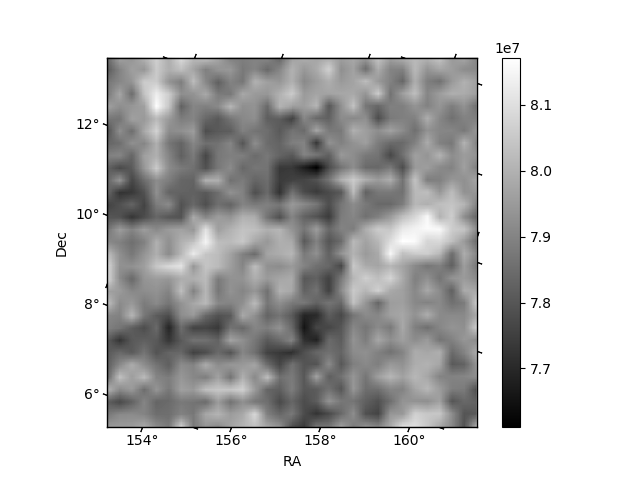
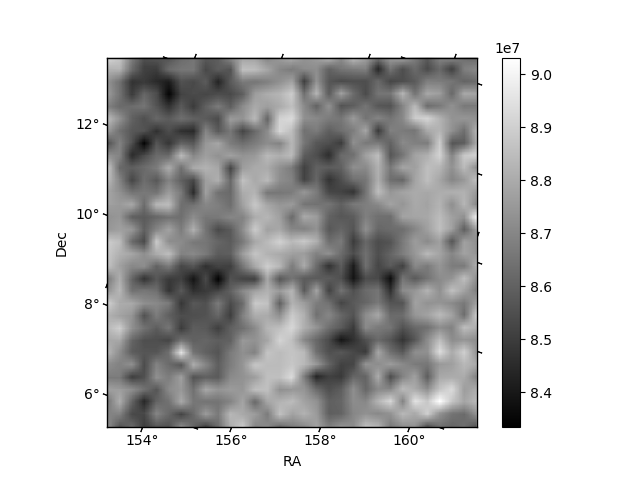
Histogram calculated using DETX and DETY for each event in the final _common_clean file
| Quadrant A | 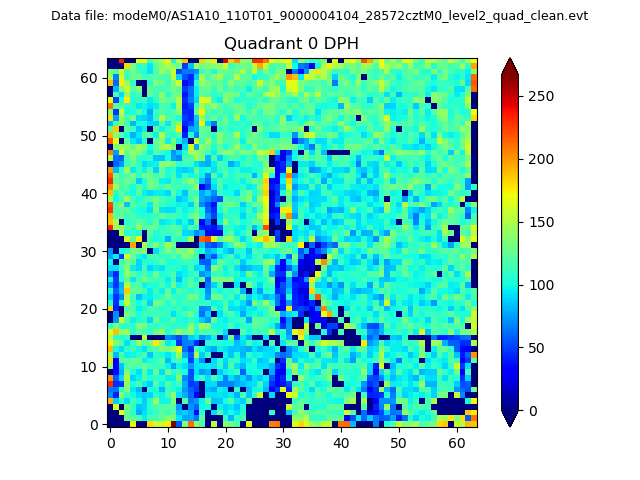 |
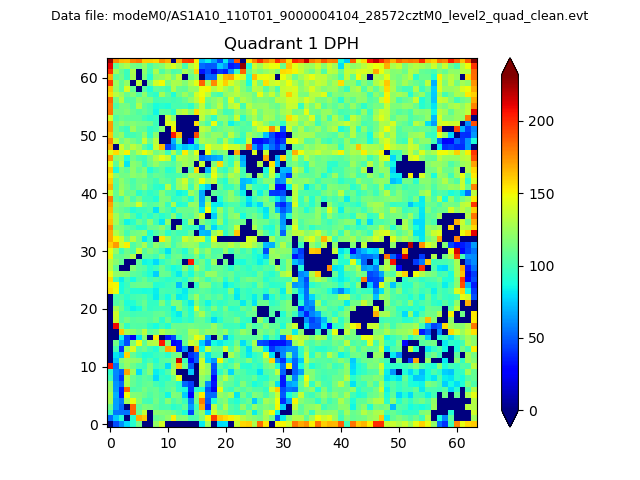 |
Quadrant B |
|---|---|---|---|
| Quadrant D | 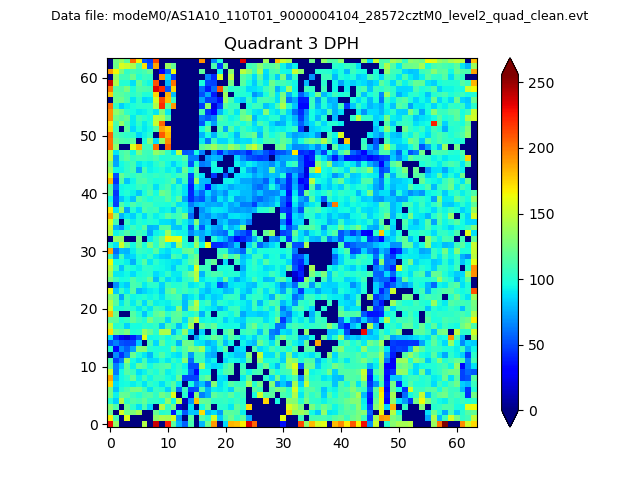 |
 |
Quadrant C |
| Plot type | Count rate plots | Images |
|---|---|---|
| Comparison with Poisson distribution Blue bars denote a histogram of data divided into 1 sec bins. Red curve is a Poisson curve with rate = median count rate of data. |
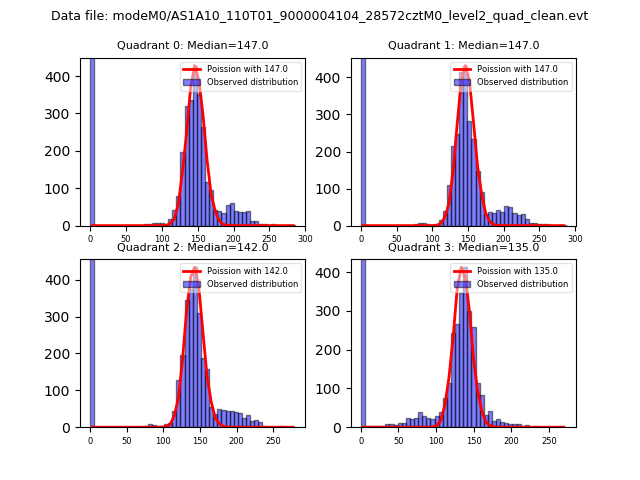 |
 |
| Quadrant-wise count rates Data is divided into 100 sec bins |
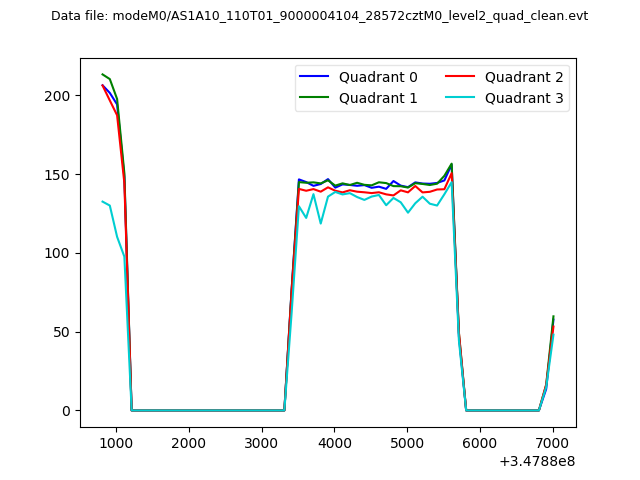 |
|
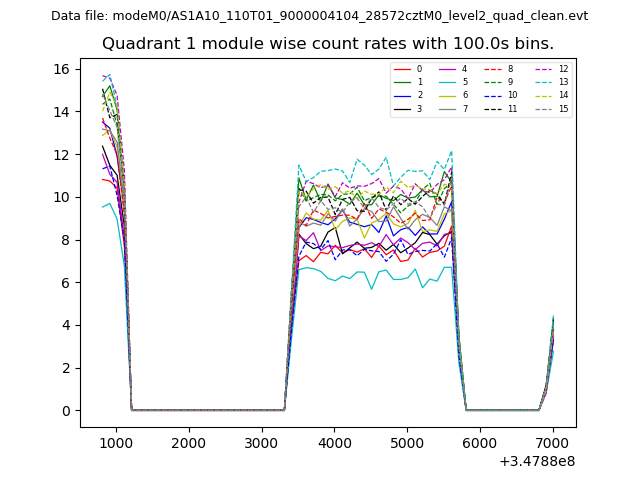
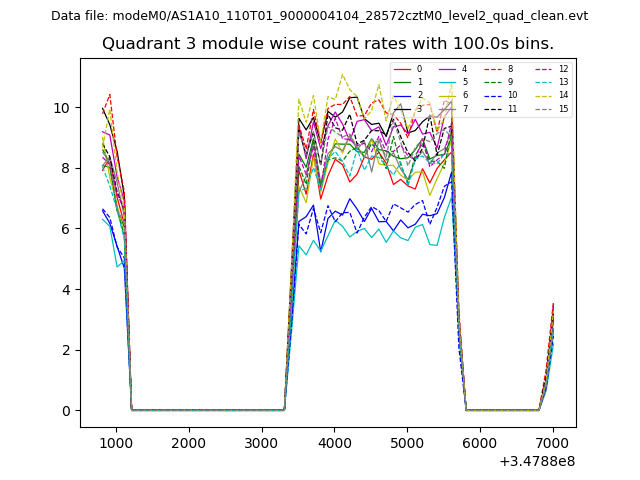
| Module-wise count rates for Quadrant A Data is divided into 100 sec bins |
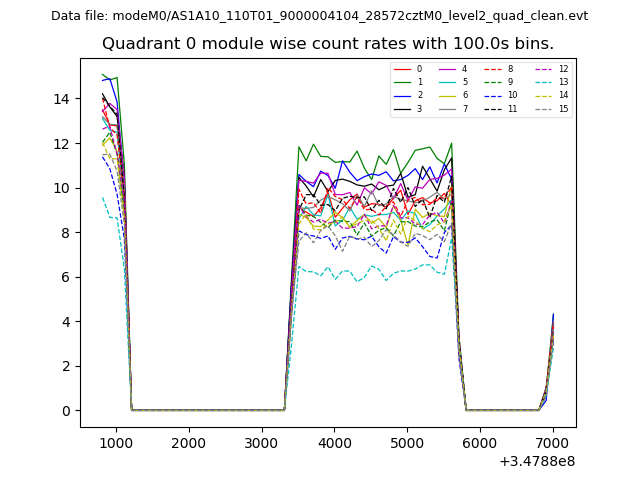 |
 |
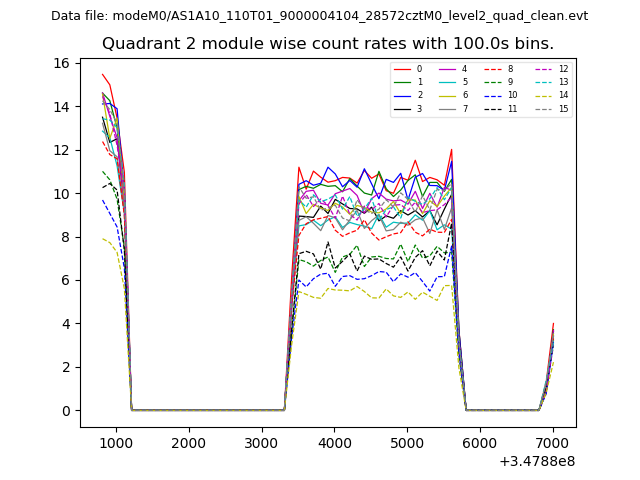
| Module-wise count rates for Quadrant B Data is divided into 100 sec bins |
 |
 |
| Module-wise count rates for Quadrant C Data is divided into 100 sec bins |
 |
 |
| Module-wise count rates for Quadrant D Data is divided into 100 sec bins |
 |
 |
| Parameter | Plot |
|---|---|
| CZT HV Monitor | 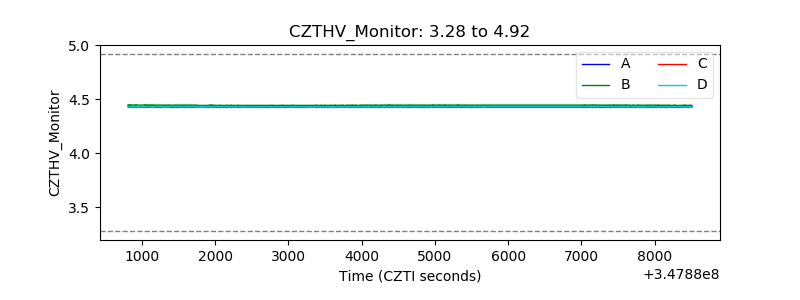 |
| D_VDD | 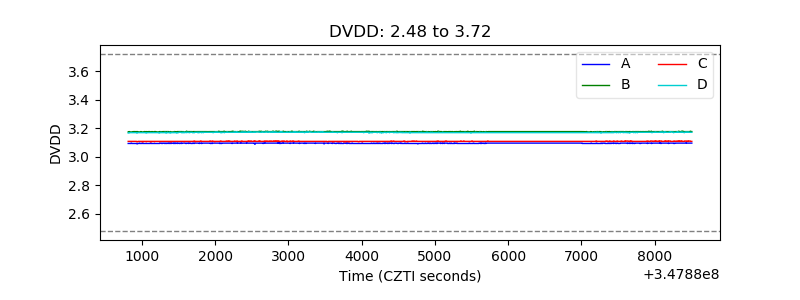 |
| Temperature 1 | 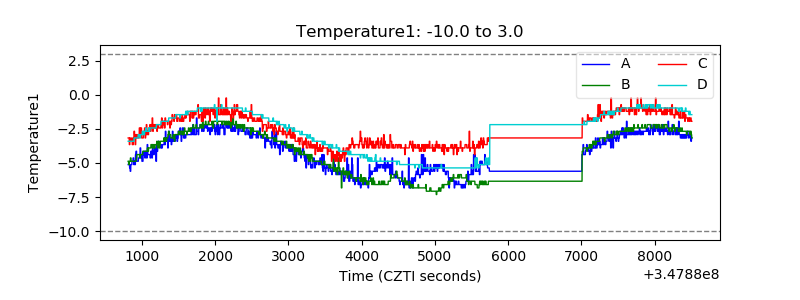 |
| Veto HV Monitor | 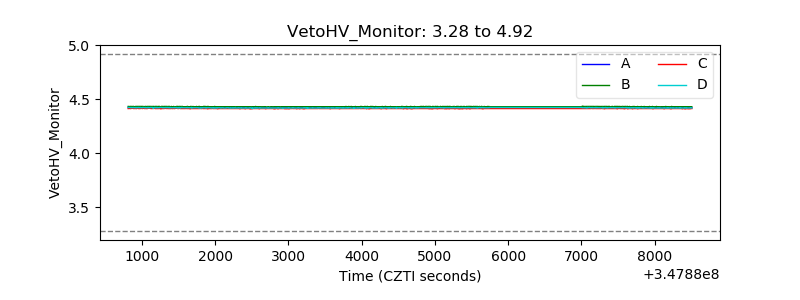 |
| Veto LLD | 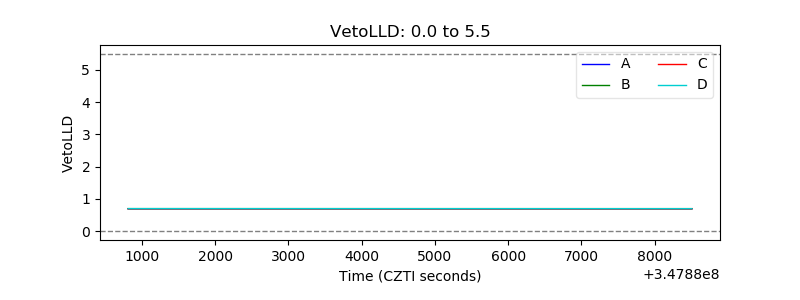 |
| Alpha Counter | 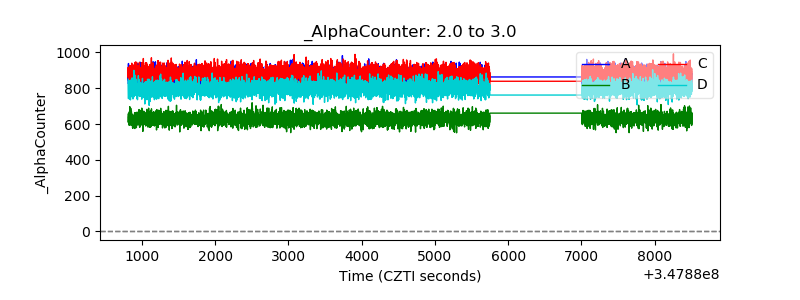 |
| _CPM_Rate | 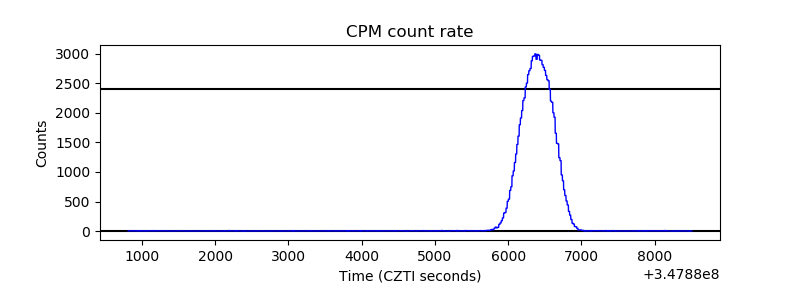 |
| CZT Counter | 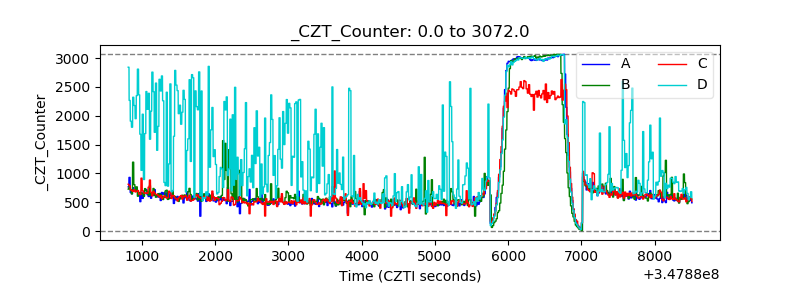 |
| +2.5 Volts monitor |  |
| +5 Volts monitor |  |
| _ROLL_ROT | 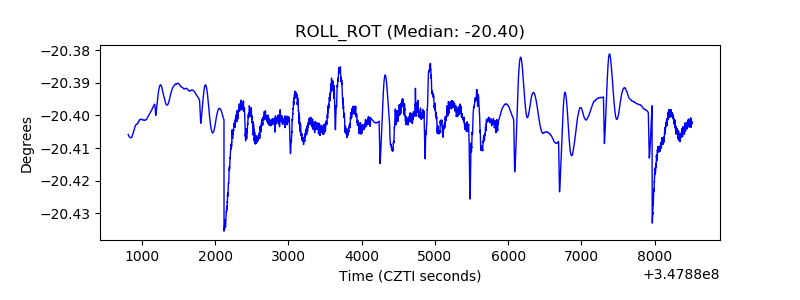 |
| _Roll_DEC | 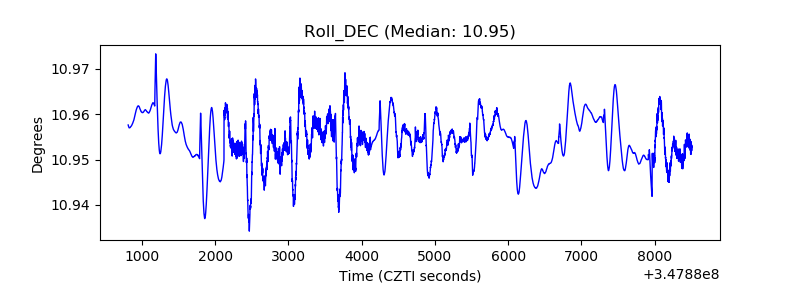 |
| _Roll_RA | 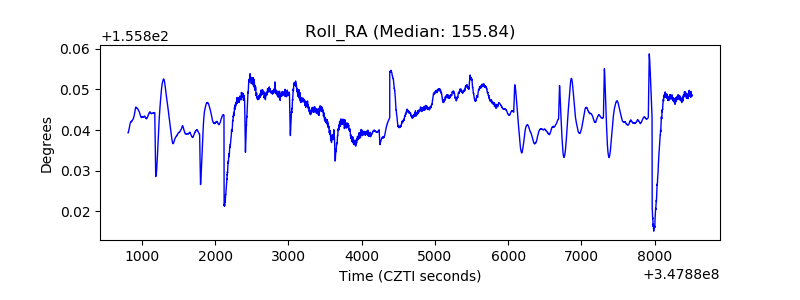 |
| Veto Counter | 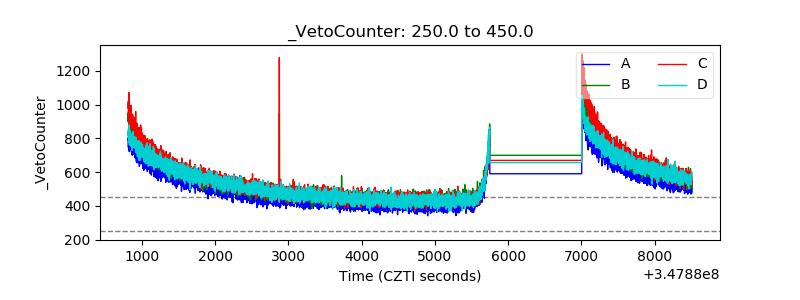 |