| Param | Original file | Final file |
|---|---|---|
| Filename | modeM0/AS1A10_110T01_9000004104_28573cztM0_level2.evt | modeM0/AS1A10_110T01_9000004104_28573cztM0_level2_quad_clean.evt |
| Size (bytes) | 573,122,880 | 67,374,720 |
| Size | 546.6 MB | 64.3 MB |
| Events in quadrant A | 3,772,145 | 402,404 |
| Events in quadrant B | 4,172,311 | 402,907 |
| Events in quadrant C | 3,848,301 | 393,760 |
| Events in quadrant D | 5,121,120 | 384,491 |
| Mode SS | |||
|---|---|---|---|
| Quadrant | BADHDUFLAG | Total packets | Discarded packets |
| A | 0 | 132 | 0 |
| B | 0 | 132 | 0 |
| C | 0 | 132 | 0 |
| D | 0 | 132 | 0 |
| Mode M0 | |||
|---|---|---|---|
| Quadrant | BADHDUFLAG | Total packets | Discarded packets |
| A | 0 | 15507 | 2 |
| B | 0 | 16734 | 2 |
| C | 0 | 15758 | 2 |
| D | 0 | 19794 | 2 |
| Mode M9 | |||
|---|---|---|---|
| Quadrant | BADHDUFLAG | Total packets | Discarded packets |
| A | 0 | 14 | 0 |
| B | 0 | 15 | 0 |
| C | 0 | 15 | 0 |
| D | 0 | 15 | 0 |
| Quadrant | Total seconds | Saturated seconds | Saturation percentage |
|---|---|---|---|
| A | 6547 | 121 | 1.848175% |
| B | 6547 | 192 | 2.932641% |
| C | 6547 | 191 | 2.917367% |
| D | 6547 | 376 | 5.743088% |
Noise dominated data is calculated using 1-second bins in cleaned event files. If a bin has >2000 counts, and if more than 50% of those come from <1% of pixels, then it is considered to be noise-dominated and hence unusable.
| Quadrant | # 1 sec bins | Bins with >0 counts | Bins with >2000 counts | High rate bins dominated by noise | Noise dominated (total time) | Noise dominated (detector-on time) | Marked lightcurve |
|---|---|---|---|---|---|---|---|
| A | 7827 | 6547 | 0 | 0 | 0.00% | 0.00% | 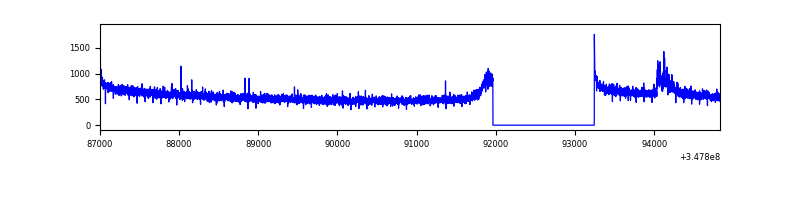 |
| B | 7827 | 6547 | 43 | 43 | 0.55% | 0.66% | 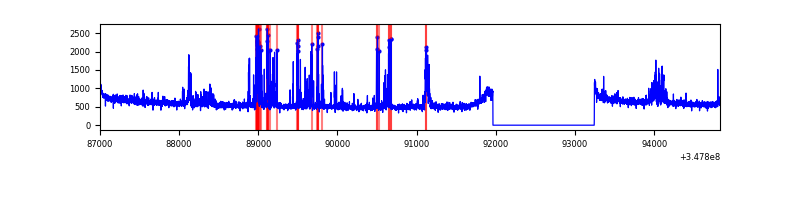 |
| C | 7827 | 6547 | 9 | 9 | 0.11% | 0.14% | 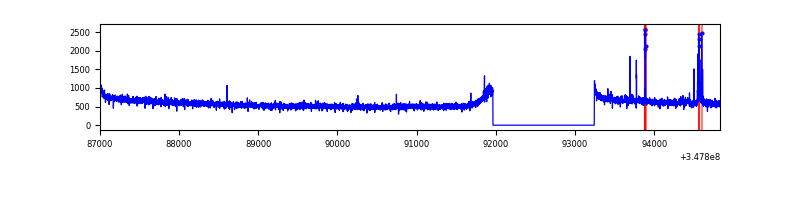 |
| D | 7826 | 6546 | 240 | 240 | 3.07% | 3.67% | 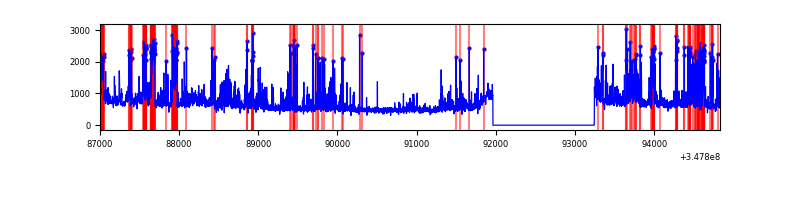 |
Top three noisy pixels from each quadrant. If the there are fewer than three noisy pixels in the level2.evt file, extra rows are filled as -1
| Pixel properties | Quadrant properties | ||||||
|---|---|---|---|---|---|---|---|
| Quadrant | DetID | PixID | Counts | Sigma | Mean | Median | Sigma |
| A | 15 | 174 | 76401 | 399.75 | 956 | 941 | 188.8 |
| A | 13 | 254 | 9909 | 47.51 | 956 | 941 | 188.8 |
| A | 8 | 192 | 8846 | 41.87 | 956 | 941 | 188.8 |
| B | 4 | 171 | 346785 | 1992.62 | 937 | 917 | 173.6 |
| B | 15 | 33 | 115014 | 657.34 | 937 | 917 | 173.6 |
| B | 12 | 111 | 20430 | 112.42 | 937 | 917 | 173.6 |
| C | 14 | 238 | 152240 | 710.31 | 925 | 936 | 213.0 |
| C | 0 | 207 | 56994 | 263.17 | 925 | 936 | 213.0 |
| C | 3 | 233 | 19611 | 87.67 | 925 | 936 | 213.0 |
| D | 1 | 52 | 1306776 | 5958.77 | 926 | 906 | 219.2 |
| D | 2 | 250 | 139094 | 630.56 | 926 | 906 | 219.2 |
| D | 8 | 195 | 134438 | 609.31 | 926 | 906 | 219.2 |
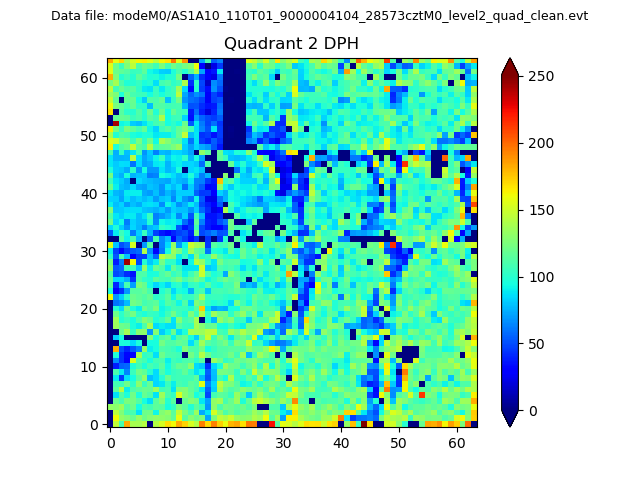
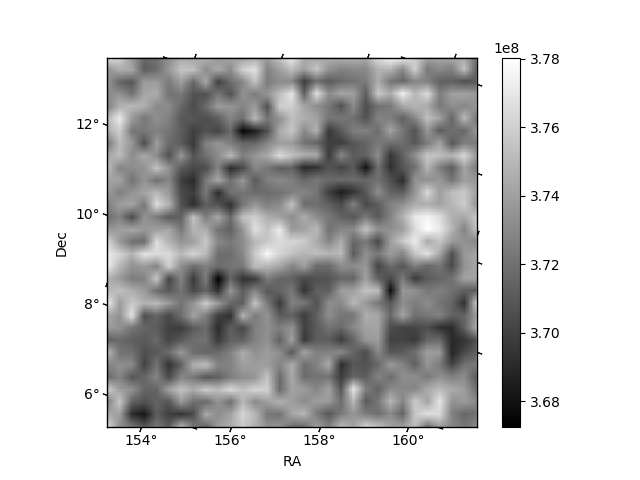
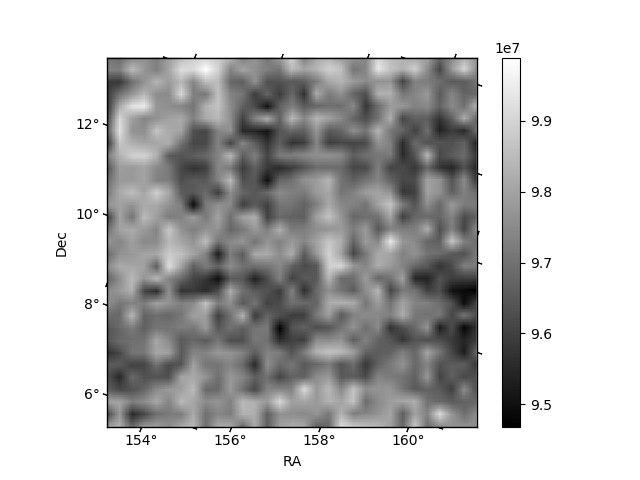
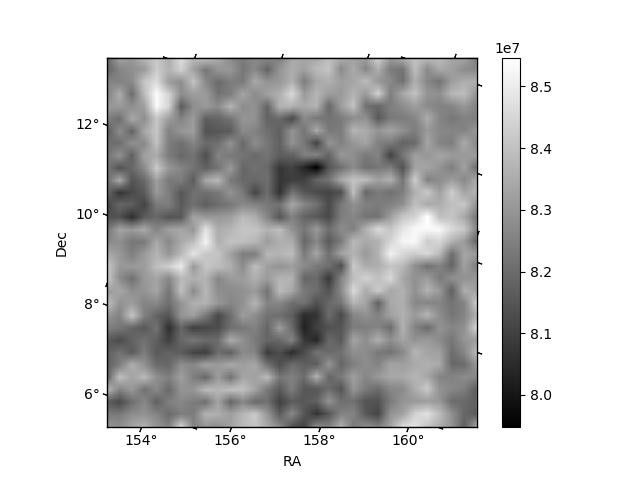
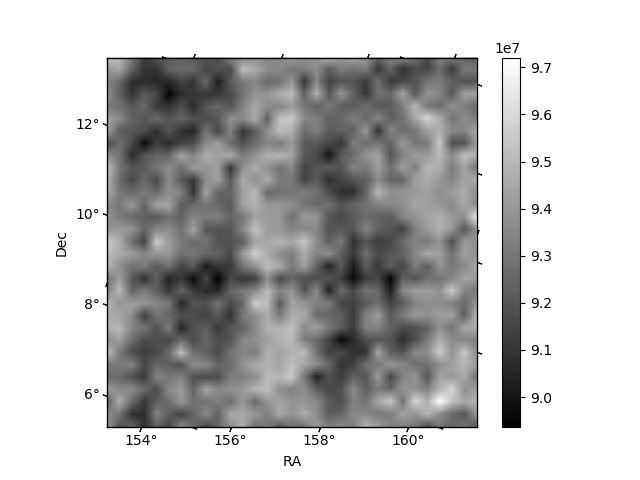
Histogram calculated using DETX and DETY for each event in the final _common_clean file
| Quadrant A | 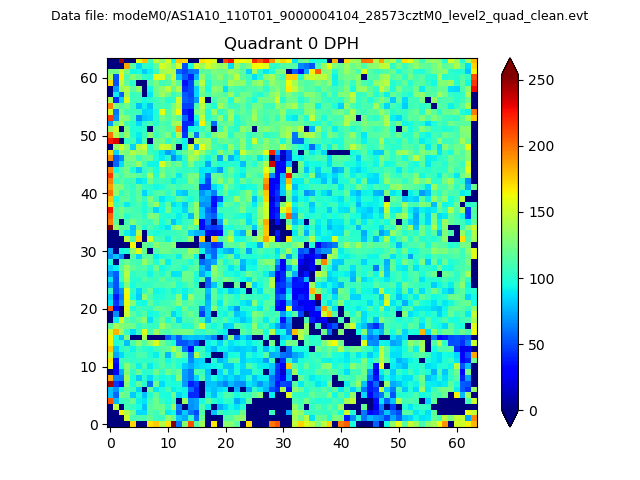 |
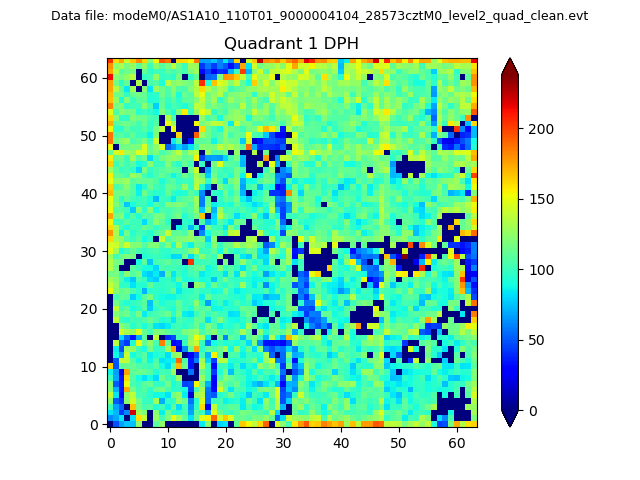 |
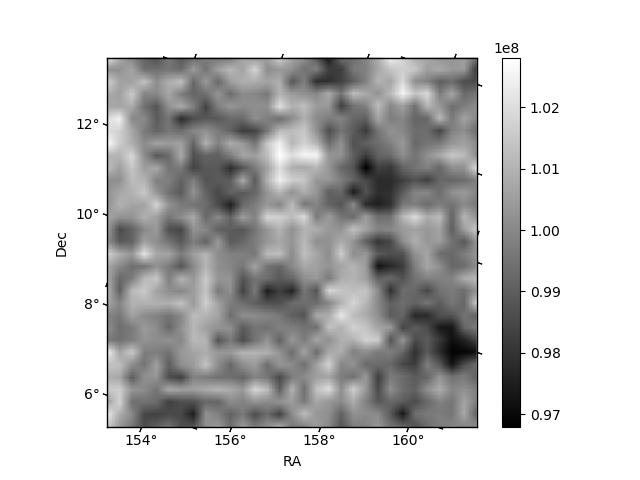
Quadrant B |
|---|---|---|---|
| Quadrant D | 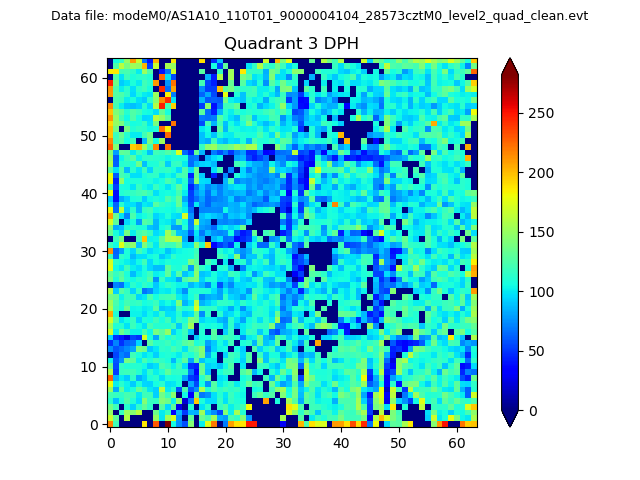 |
 |
Quadrant C |
| Plot type | Count rate plots | Images |
|---|---|---|
| Comparison with Poisson distribution Blue bars denote a histogram of data divided into 1 sec bins. Red curve is a Poisson curve with rate = median count rate of data. |
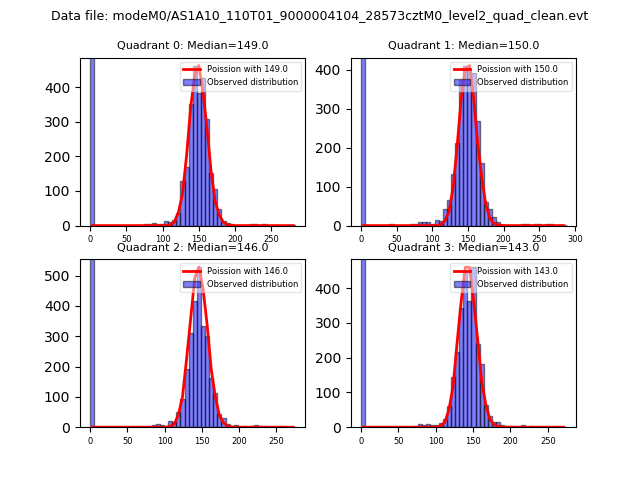 |
 |
| Quadrant-wise count rates Data is divided into 100 sec bins |
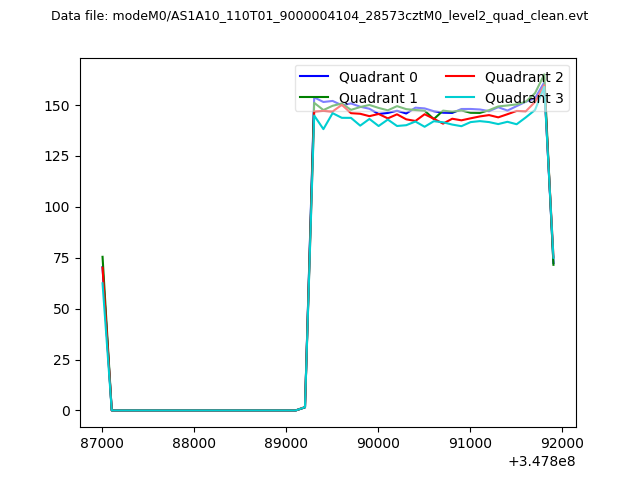 |
|
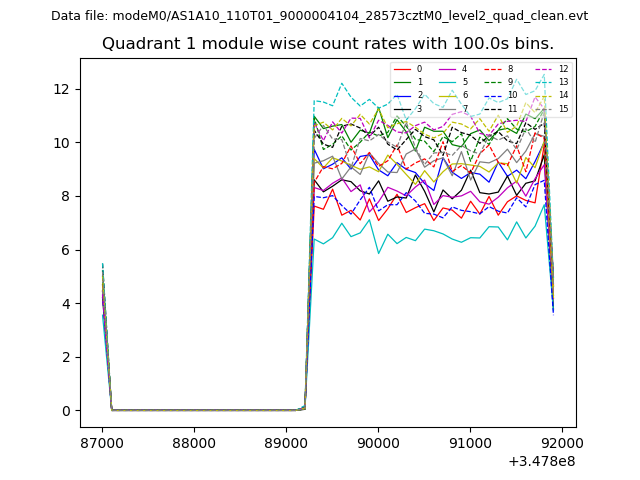
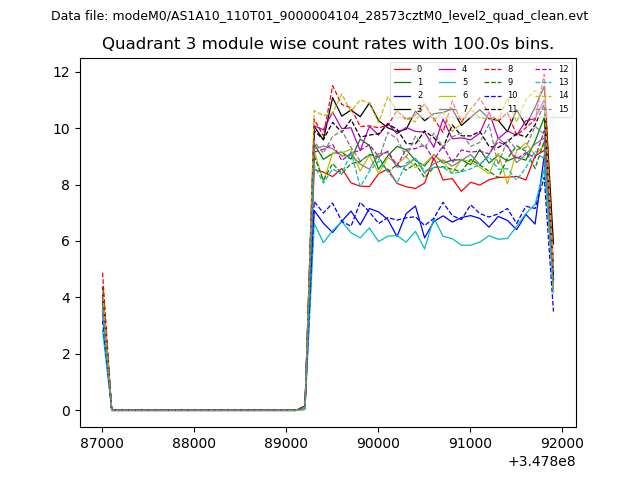
| Module-wise count rates for Quadrant A Data is divided into 100 sec bins |
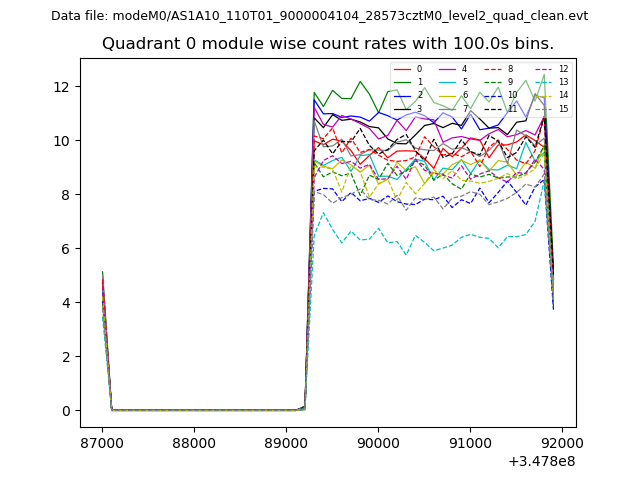 |
 |
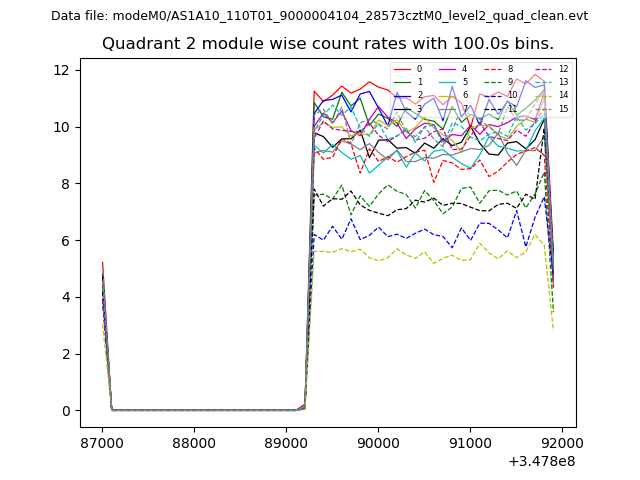
| Module-wise count rates for Quadrant B Data is divided into 100 sec bins |
 |
 |
| Module-wise count rates for Quadrant C Data is divided into 100 sec bins |
 |
 |
| Module-wise count rates for Quadrant D Data is divided into 100 sec bins |
 |
 |
| Parameter | Plot |
|---|---|
| CZT HV Monitor | 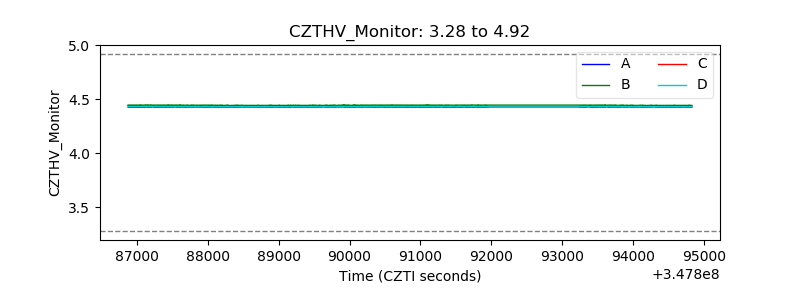 |
| D_VDD | 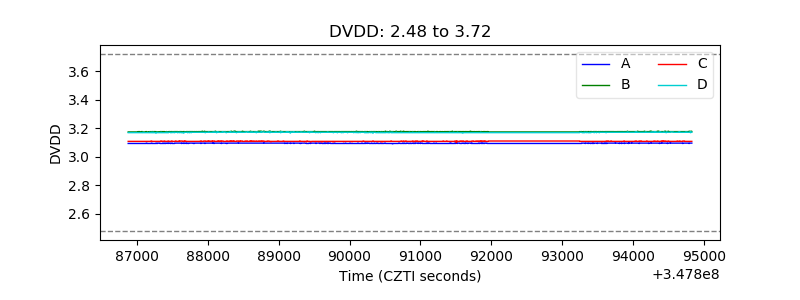 |
| Temperature 1 | 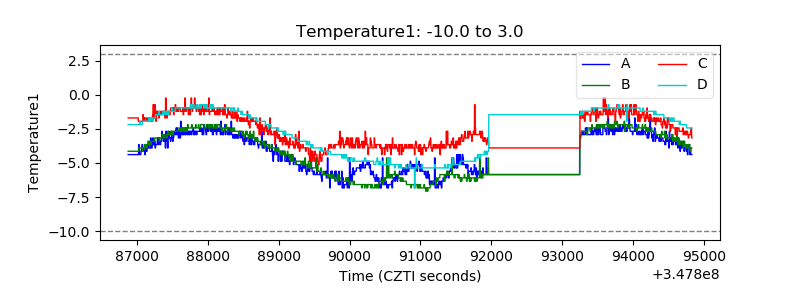 |
| Veto HV Monitor | 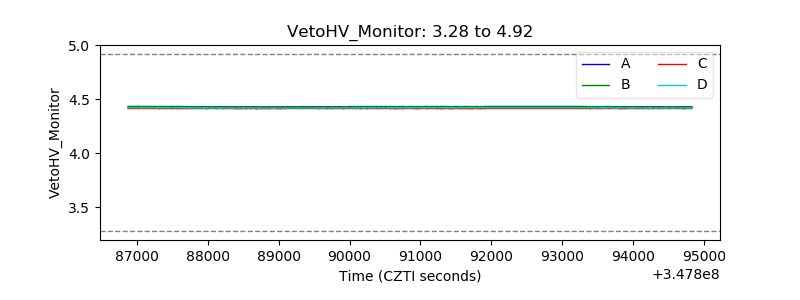 |
| Veto LLD | 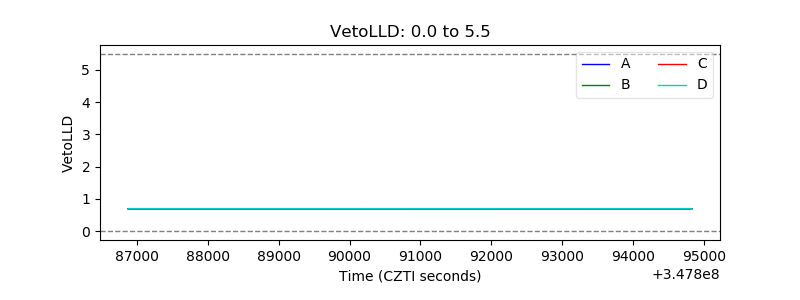 |
| Alpha Counter | 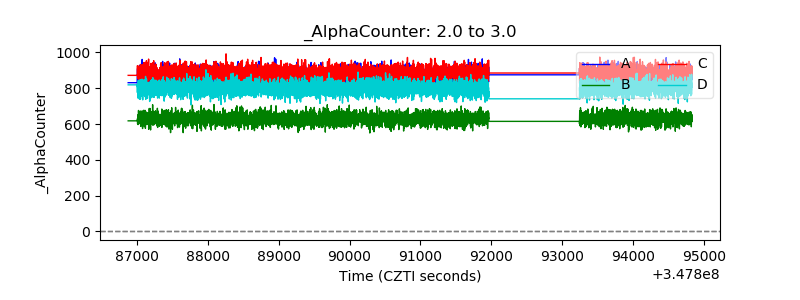 |
| _CPM_Rate | 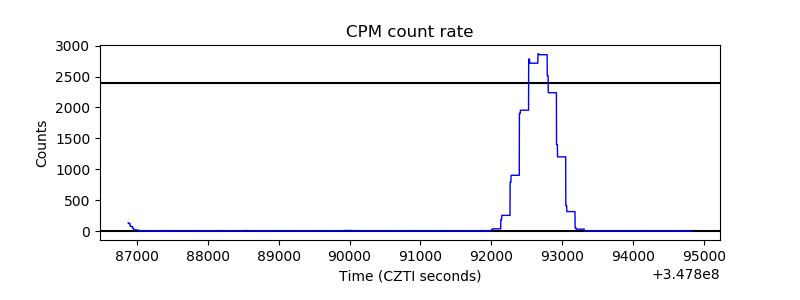 |
| CZT Counter | 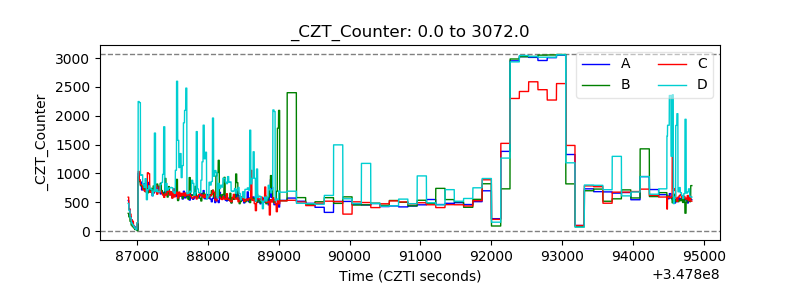 |
| +2.5 Volts monitor |  |
| +5 Volts monitor | 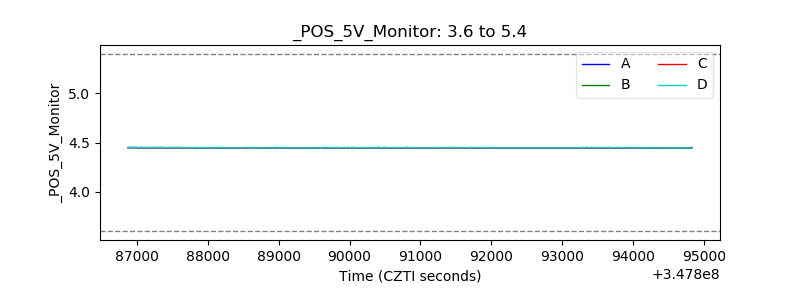 |
| _ROLL_ROT | 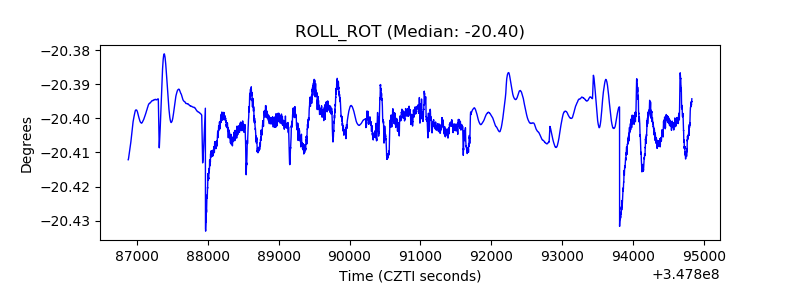 |
| _Roll_DEC |  |
| _Roll_RA | 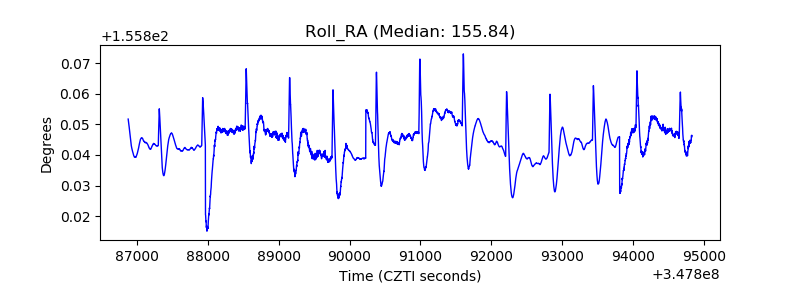 |
| Veto Counter | 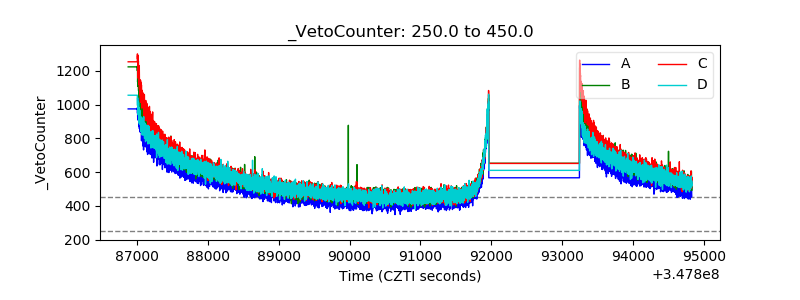 |