| Param | Original file | Final file |
|---|---|---|
| Filename | modeM0/AS1A10_110T01_9000004104_28574cztM0_level2.evt | modeM0/AS1A10_110T01_9000004104_28574cztM0_level2_quad_clean.evt |
| Size (bytes) | 526,973,760 | 72,610,560 |
| Size | 502.6 MB | 69.2 MB |
| Events in quadrant A | 3,446,452 | 452,927 |
| Events in quadrant B | 3,491,244 | 458,020 |
| Events in quadrant C | 3,445,361 | 442,543 |
| Events in quadrant D | 5,167,462 | 423,608 |
| Mode SS | |||
|---|---|---|---|
| Quadrant | BADHDUFLAG | Total packets | Discarded packets |
| A | 0 | 124 | 0 |
| B | 0 | 124 | 0 |
| C | 0 | 124 | 0 |
| D | 0 | 124 | 0 |
| Mode M0 | |||
|---|---|---|---|
| Quadrant | BADHDUFLAG | Total packets | Discarded packets |
| A | 0 | 14174 | 1 |
| B | 0 | 14198 | 1 |
| C | 0 | 14151 | 1 |
| D | 0 | 19540 | 1 |
| Mode M9 | |||
|---|---|---|---|
| Quadrant | BADHDUFLAG | Total packets | Discarded packets |
| A | 0 | 13 | 0 |
| B | 0 | 13 | 0 |
| C | 0 | 13 | 0 |
| D | 0 | 13 | 0 |
| Quadrant | Total seconds | Saturated seconds | Saturation percentage |
|---|---|---|---|
| A | 6029 | 91 | 1.509371% |
| B | 6030 | 135 | 2.238806% |
| C | 6030 | 171 | 2.835821% |
| D | 6030 | 450 | 7.462687% |
Noise dominated data is calculated using 1-second bins in cleaned event files. If a bin has >2000 counts, and if more than 50% of those come from <1% of pixels, then it is considered to be noise-dominated and hence unusable.
| Quadrant | # 1 sec bins | Bins with >0 counts | Bins with >2000 counts | High rate bins dominated by noise | Noise dominated (total time) | Noise dominated (detector-on time) | Marked lightcurve |
|---|---|---|---|---|---|---|---|
| A | 7314 | 6029 | 0 | 0 | 0.00% | 0.00% | 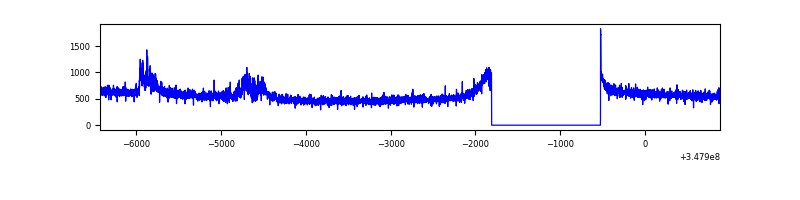 |
| B | 7315 | 6030 | 6 | 6 | 0.08% | 0.10% | 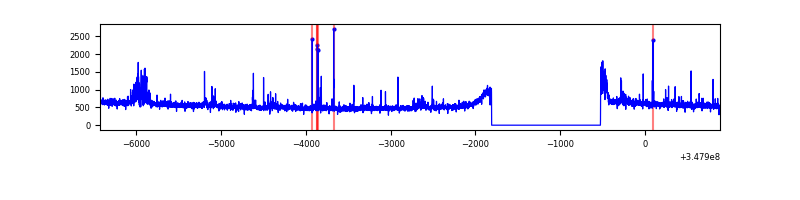 |
| C | 7315 | 6030 | 9 | 9 | 0.12% | 0.15% | 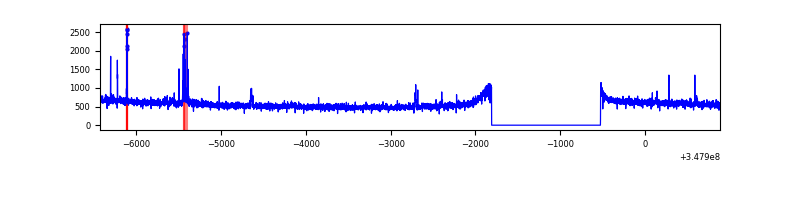 |
| D | 7315 | 6030 | 338 | 338 | 4.62% | 5.61% | 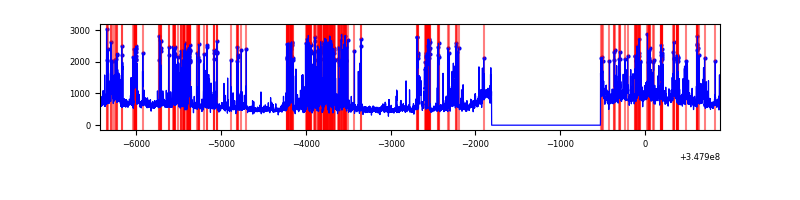 |
Top three noisy pixels from each quadrant. If the there are fewer than three noisy pixels in the level2.evt file, extra rows are filled as -1
| Pixel properties | Quadrant properties | ||||||
|---|---|---|---|---|---|---|---|
| Quadrant | DetID | PixID | Counts | Sigma | Mean | Median | Sigma |
| A | 15 | 174 | 167563 | 986.62 | 848 | 834 | 169.0 |
| A | 13 | 254 | 9733 | 52.66 | 848 | 834 | 169.0 |
| A | 3 | 137 | 7746 | 40.9 | 848 | 834 | 169.0 |
| B | 15 | 33 | 117310 | 742.61 | 838 | 819 | 156.9 |
| B | 4 | 171 | 40534 | 253.18 | 838 | 819 | 156.9 |
| B | 12 | 111 | 18221 | 110.93 | 838 | 819 | 156.9 |
| C | 14 | 238 | 135267 | 709.39 | 822 | 829 | 189.5 |
| C | 0 | 207 | 60569 | 315.23 | 822 | 829 | 189.5 |
| C | 7 | 247 | 28080 | 143.79 | 822 | 829 | 189.5 |
| D | 1 | 52 | 1537634 | 7959.62 | 813 | 794 | 193.1 |
| D | 8 | 195 | 269956 | 1394.05 | 813 | 794 | 193.1 |
| D | 2 | 250 | 177616 | 915.8 | 813 | 794 | 193.1 |
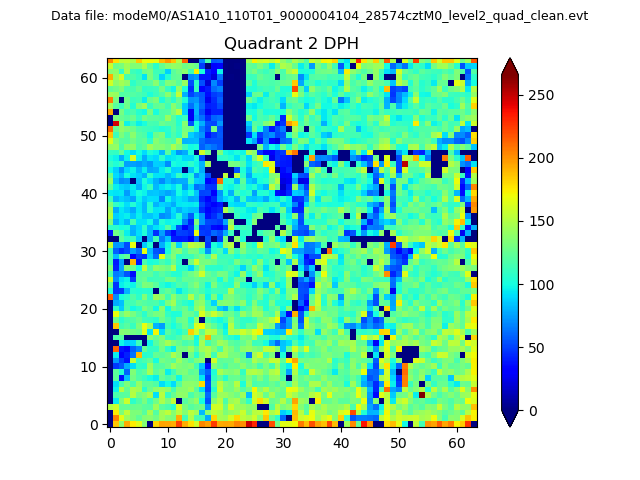
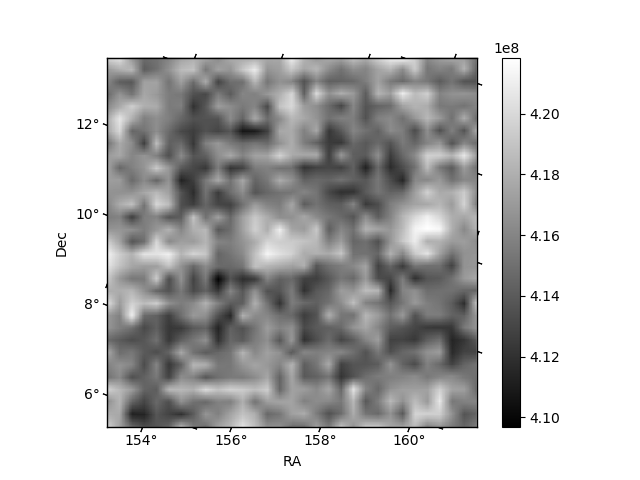
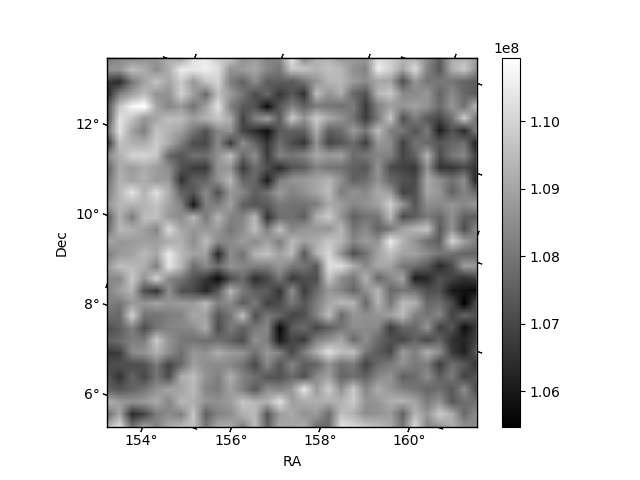
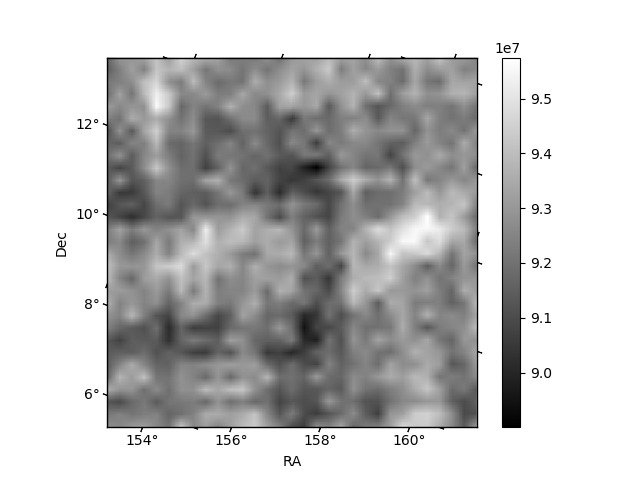
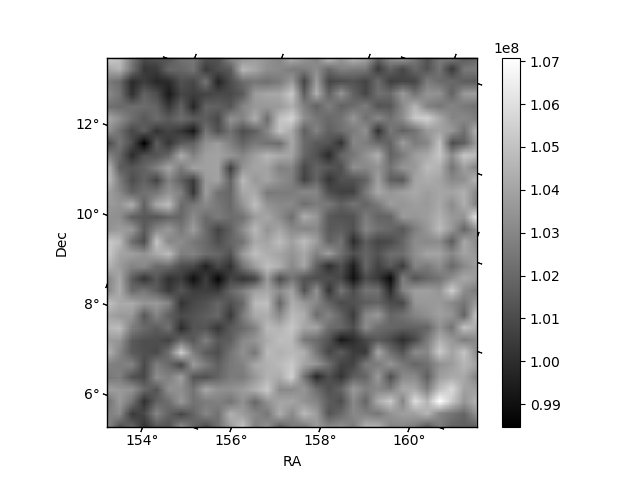
Histogram calculated using DETX and DETY for each event in the final _common_clean file
| Quadrant A | 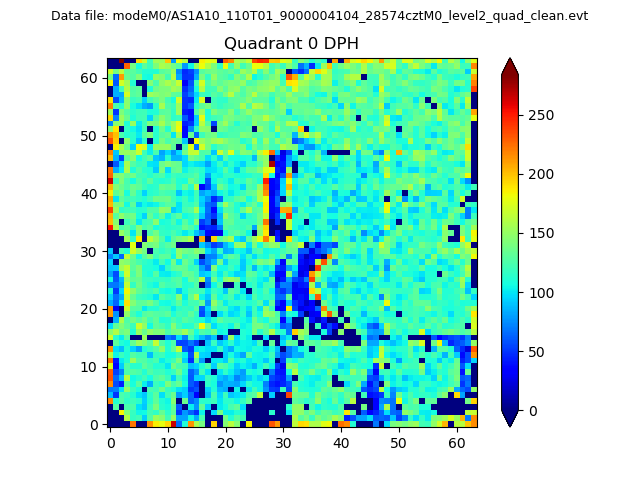 |
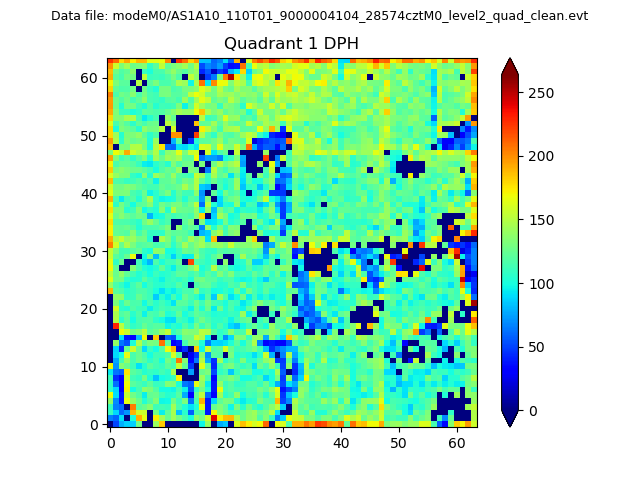 |
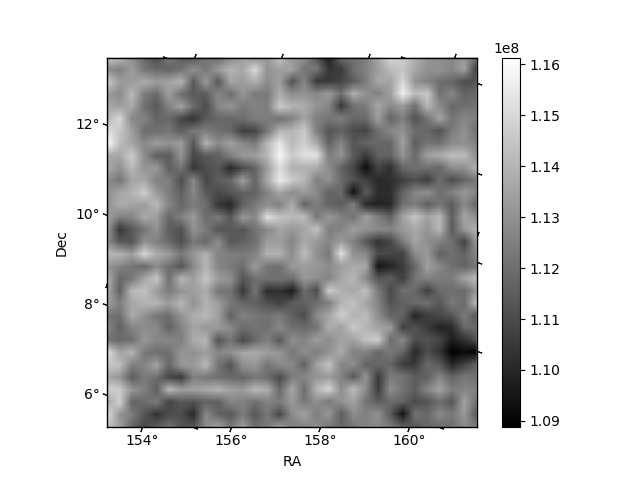
Quadrant B |
|---|---|---|---|
| Quadrant D | 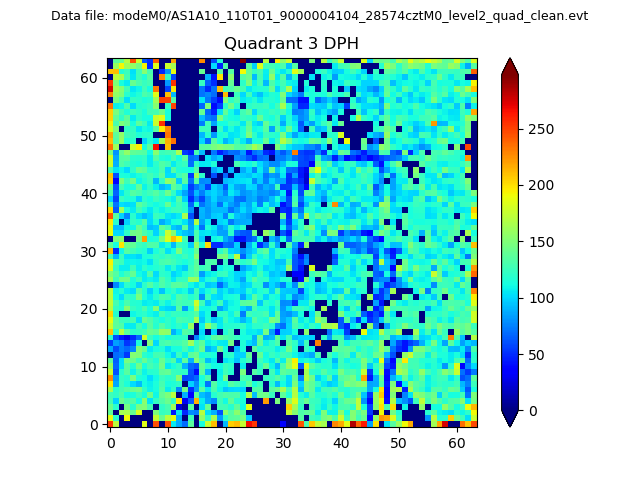 |
 |
Quadrant C |
| Plot type | Count rate plots | Images |
|---|---|---|
| Comparison with Poisson distribution Blue bars denote a histogram of data divided into 1 sec bins. Red curve is a Poisson curve with rate = median count rate of data. |
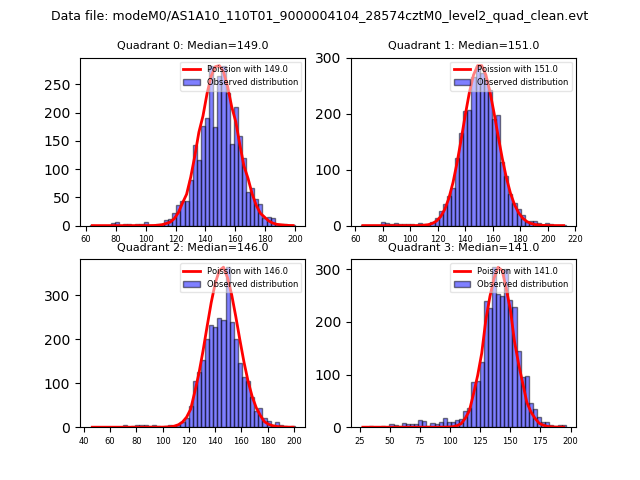 |
 |
| Quadrant-wise count rates Data is divided into 100 sec bins |
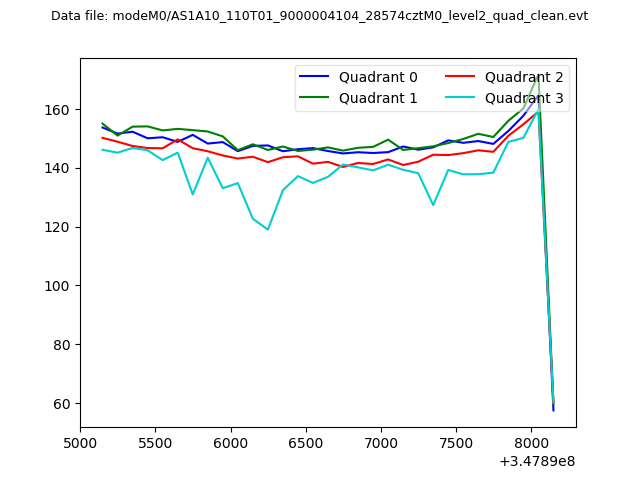 |
|
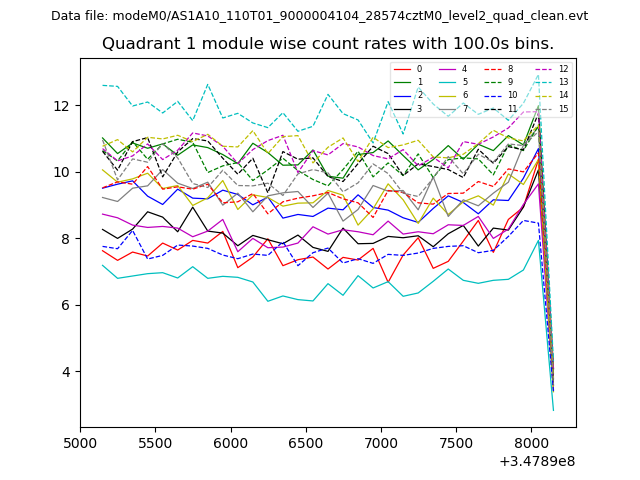
| Module-wise count rates for Quadrant A Data is divided into 100 sec bins |
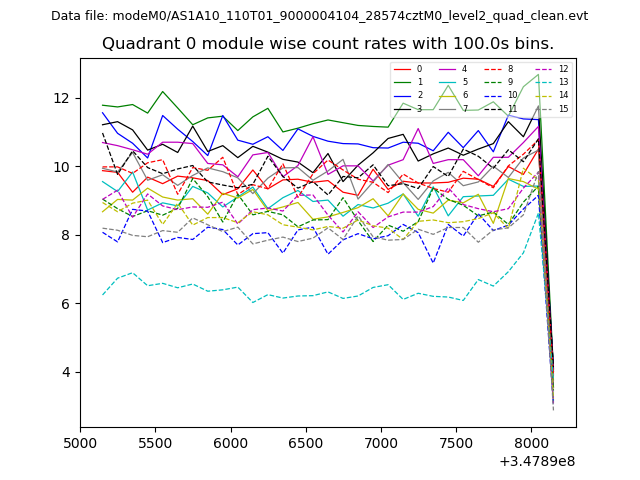 |
 |
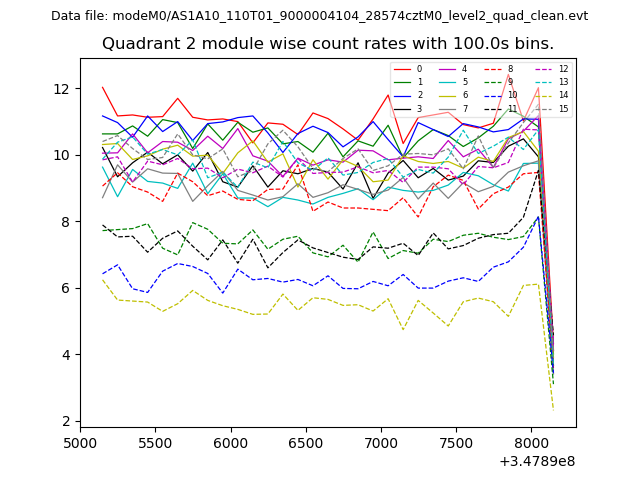
| Module-wise count rates for Quadrant B Data is divided into 100 sec bins |
 |
 |
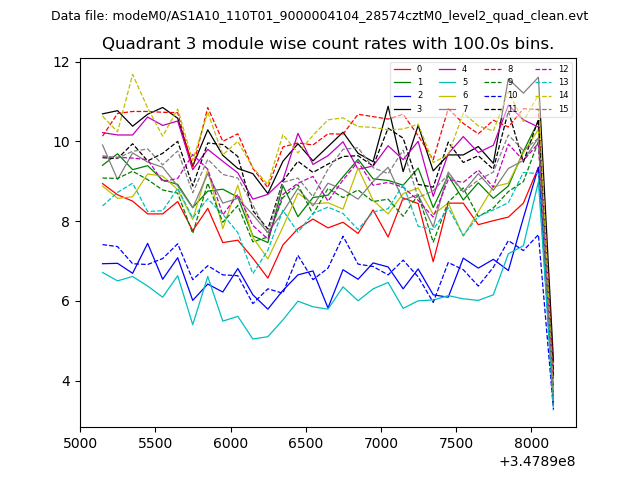
| Module-wise count rates for Quadrant C Data is divided into 100 sec bins |
 |
 |
| Module-wise count rates for Quadrant D Data is divided into 100 sec bins |
 |
 |
| Parameter | Plot |
|---|---|
| CZT HV Monitor | 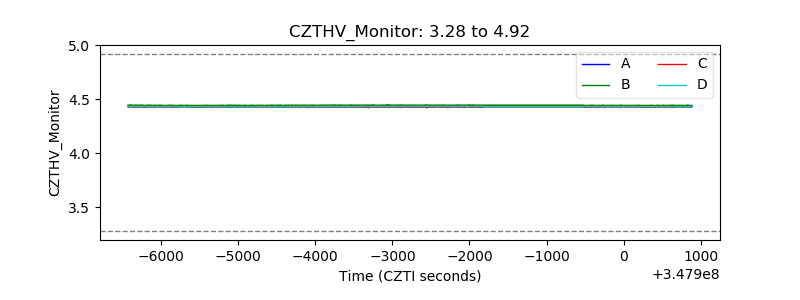 |
| D_VDD | 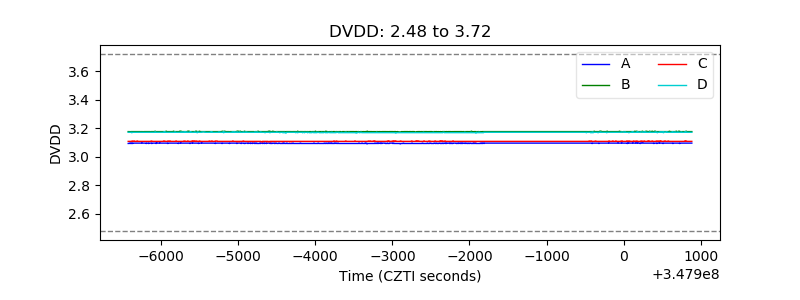 |
| Temperature 1 | 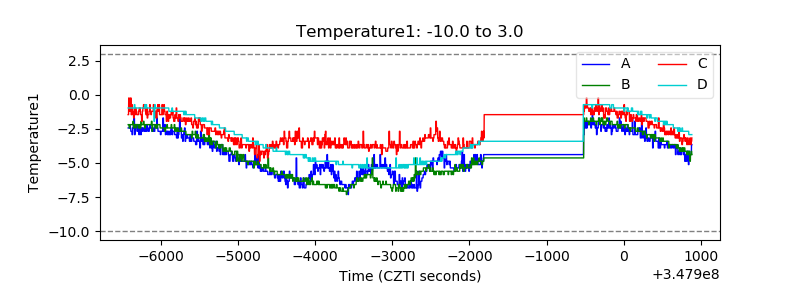 |
| Veto HV Monitor | 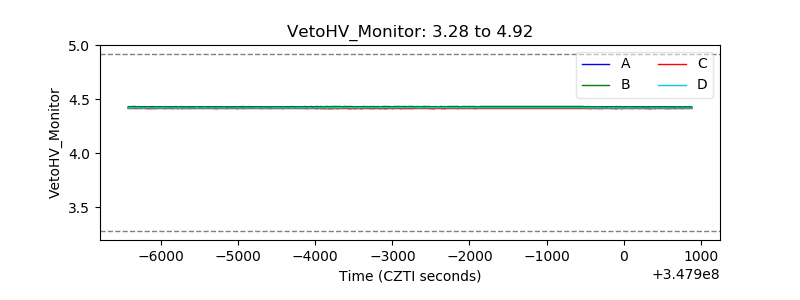 |
| Veto LLD | 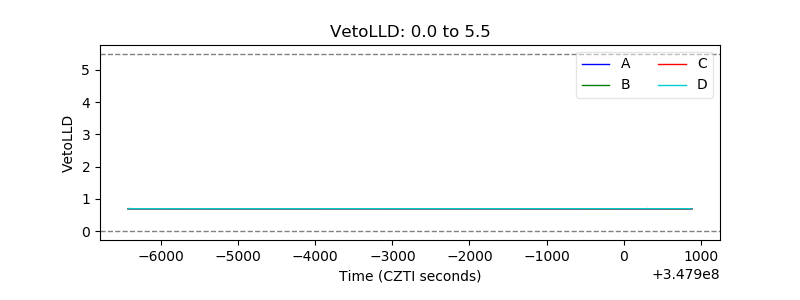 |
| Alpha Counter | 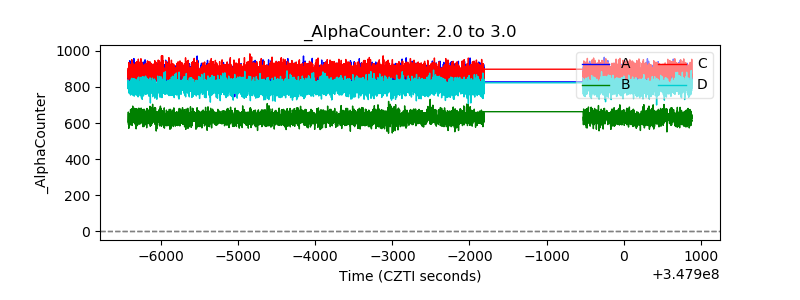 |
| _CPM_Rate | 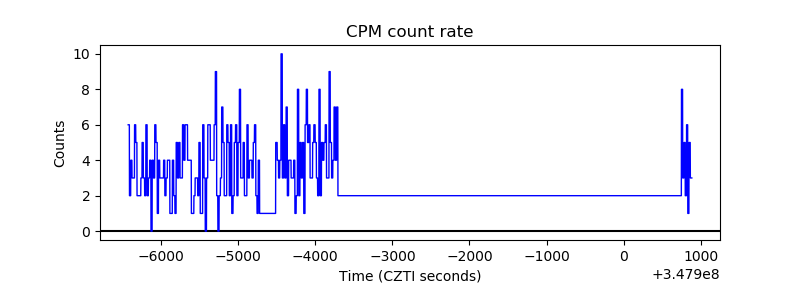 |
| CZT Counter | 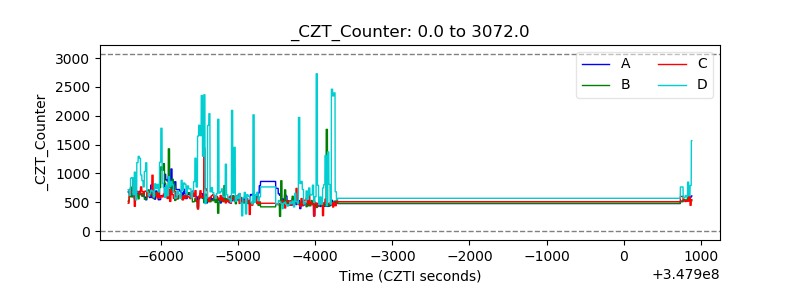 |
| +2.5 Volts monitor |  |
| +5 Volts monitor |  |
| _ROLL_ROT | 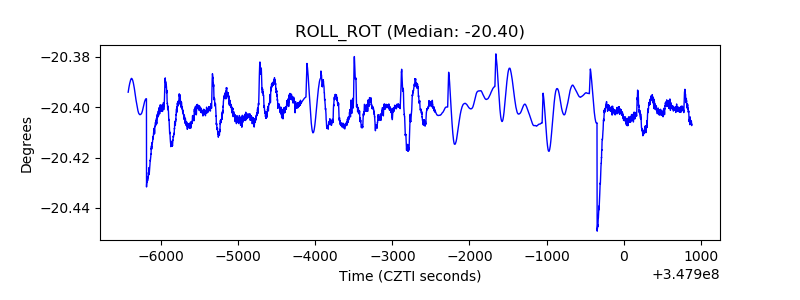 |
| _Roll_DEC | 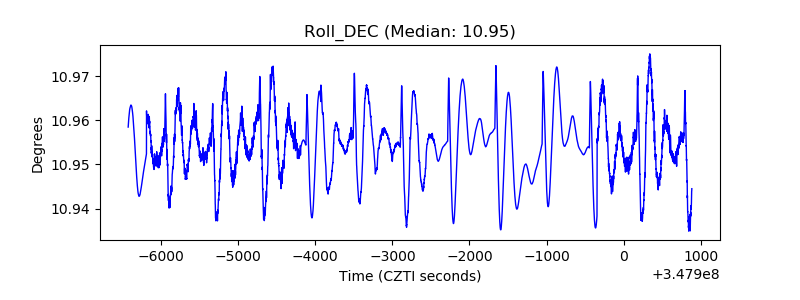 |
| _Roll_RA | 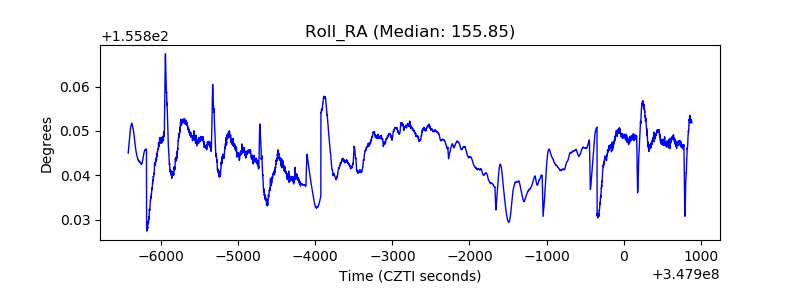 |
| Veto Counter | 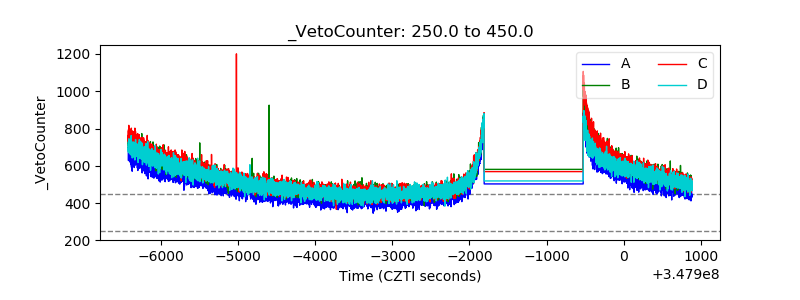 |