| Param | Original file | Final file |
|---|---|---|
| Filename | modeM0/AS1A10_110T01_9000004104_28575cztM0_level2.evt | modeM0/AS1A10_110T01_9000004104_28575cztM0_level2_quad_clean.evt |
| Size (bytes) | 574,899,840 | 84,124,800 |
| Size | 548.3 MB | 80.2 MB |
| Events in quadrant A | 3,544,449 | 541,014 |
| Events in quadrant B | 3,533,717 | 549,971 |
| Events in quadrant C | 3,477,213 | 531,098 |
| Events in quadrant D | 6,422,019 | 478,871 |
| Mode SS | |||
|---|---|---|---|
| Quadrant | BADHDUFLAG | Total packets | Discarded packets |
| A | 0 | 128 | 0 |
| B | 0 | 128 | 0 |
| C | 0 | 128 | 0 |
| D | 0 | 128 | 0 |
| Mode M0 | |||
|---|---|---|---|
| Quadrant | BADHDUFLAG | Total packets | Discarded packets |
| A | 0 | 14572 | 2 |
| B | 0 | 14479 | 2 |
| C | 0 | 14325 | 2 |
| D | 0 | 23460 | 3 |
| Mode M9 | |||
|---|---|---|---|
| Quadrant | BADHDUFLAG | Total packets | Discarded packets |
| A | 0 | 22 | 0 |
| B | 0 | 23 | 0 |
| C | 0 | 23 | 0 |
| D | 0 | 23 | 0 |
| Quadrant | Total seconds | Saturated seconds | Saturation percentage |
|---|---|---|---|
| A | 6400 | 116 | 1.812500% |
| B | 6400 | 161 | 2.515625% |
| C | 6400 | 161 | 2.515625% |
| D | 6399 | 1149 | 17.955931% |
Noise dominated data is calculated using 1-second bins in cleaned event files. If a bin has >2000 counts, and if more than 50% of those come from <1% of pixels, then it is considered to be noise-dominated and hence unusable.
| Quadrant | # 1 sec bins | Bins with >0 counts | Bins with >2000 counts | High rate bins dominated by noise | Noise dominated (total time) | Noise dominated (detector-on time) | Marked lightcurve |
|---|---|---|---|---|---|---|---|
| A | 7575 | 6400 | 22 | 22 | 0.29% | 0.34% | 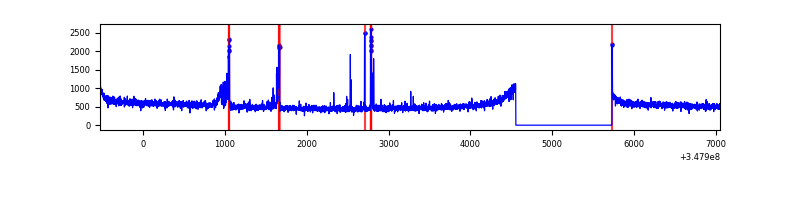 |
| B | 7575 | 6400 | 4 | 4 | 0.05% | 0.06% | 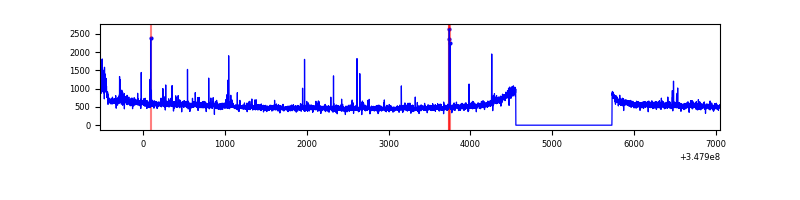 |
| C | 7575 | 6400 | 2 | 2 | 0.03% | 0.03% | 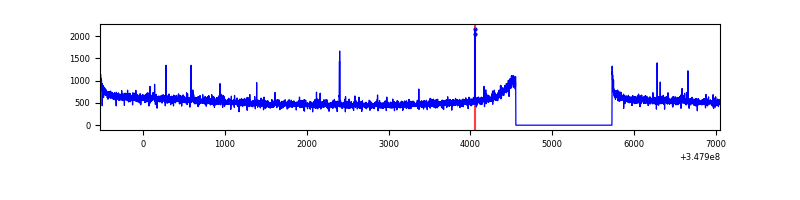 |
| D | 7574 | 6399 | 548 | 548 | 7.24% | 8.56% | 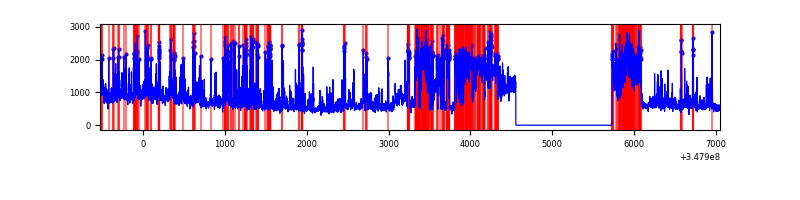 |
Top three noisy pixels from each quadrant. If the there are fewer than three noisy pixels in the level2.evt file, extra rows are filled as -1
| Pixel properties | Quadrant properties | ||||||
|---|---|---|---|---|---|---|---|
| Quadrant | DetID | PixID | Counts | Sigma | Mean | Median | Sigma |
| A | 15 | 174 | 121194 | 691.94 | 872 | 858 | 173.9 |
| A | 1 | 113 | 45987 | 259.5 | 872 | 858 | 173.9 |
| A | 8 | 192 | 11665 | 62.14 | 872 | 858 | 173.9 |
| B | 15 | 33 | 47912 | 285.25 | 865 | 844 | 165.0 |
| B | 4 | 171 | 33415 | 197.39 | 865 | 844 | 165.0 |
| B | 0 | 230 | 21592 | 125.74 | 865 | 844 | 165.0 |
| C | 14 | 238 | 136371 | 690.11 | 844 | 852 | 196.4 |
| C | 7 | 247 | 23144 | 113.52 | 844 | 852 | 196.4 |
| C | 0 | 207 | 18371 | 89.21 | 844 | 852 | 196.4 |
| D | 1 | 52 | 2888185 | 15662.47 | 776 | 758 | 184.4 |
| D | 8 | 195 | 376090 | 2035.94 | 776 | 758 | 184.4 |
| D | 2 | 250 | 111326 | 599.76 | 776 | 758 | 184.4 |
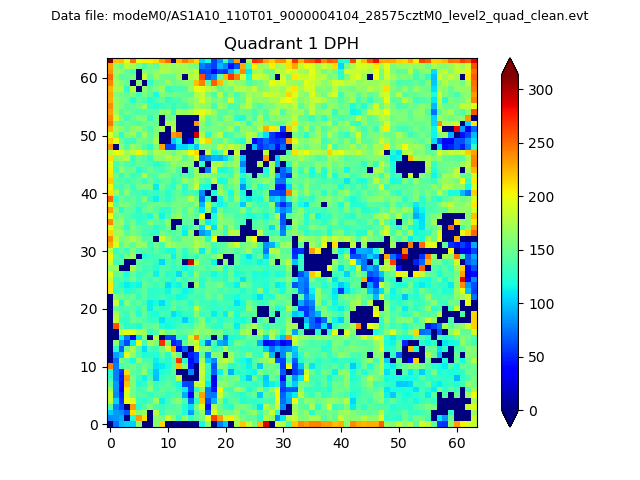
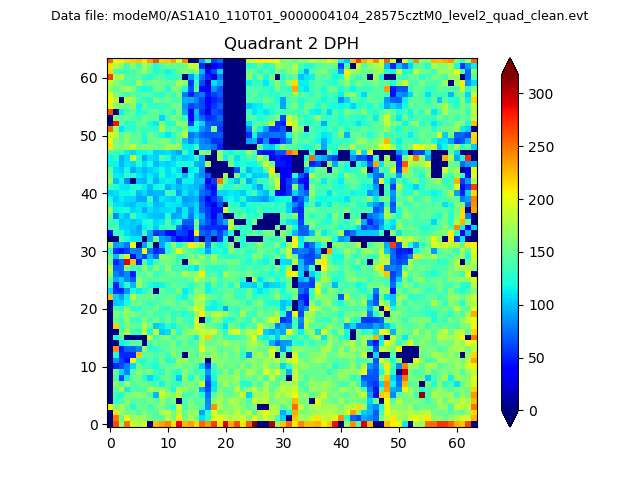
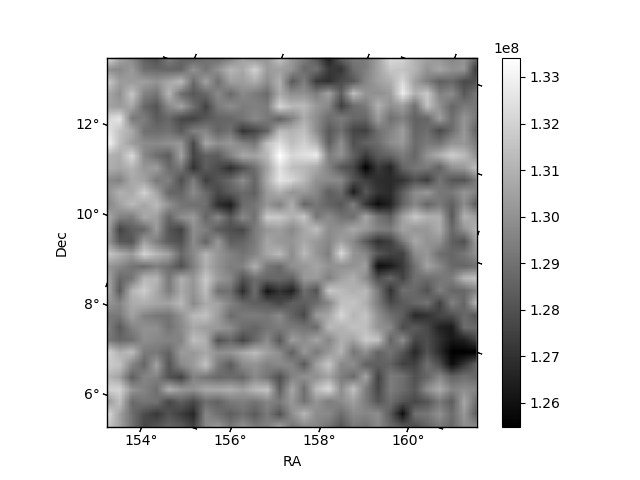
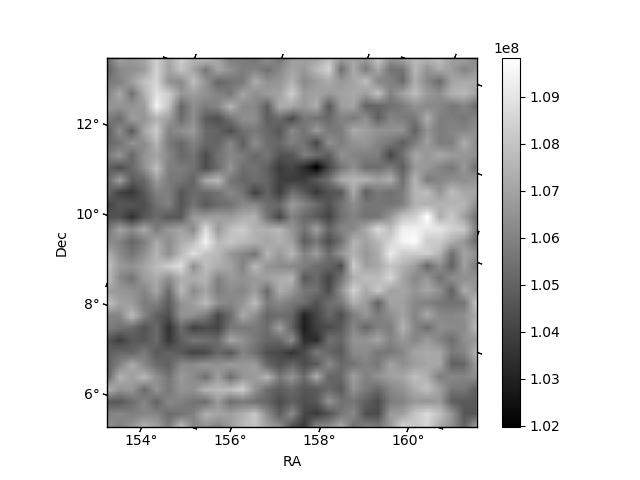
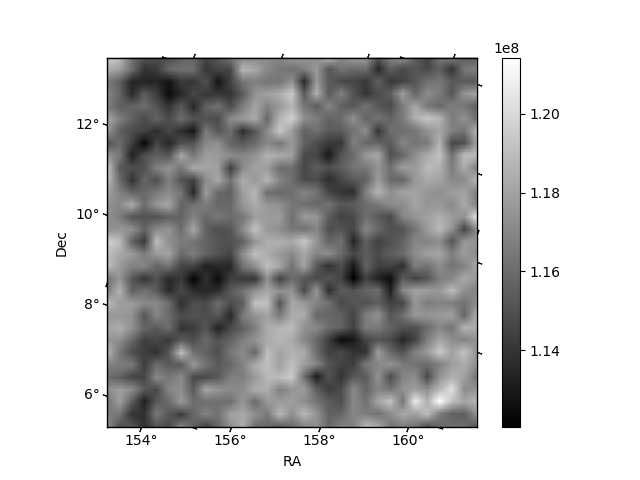
Histogram calculated using DETX and DETY for each event in the final _common_clean file
| Quadrant A |  |
 |
Quadrant B |
|---|---|---|---|
| Quadrant D | 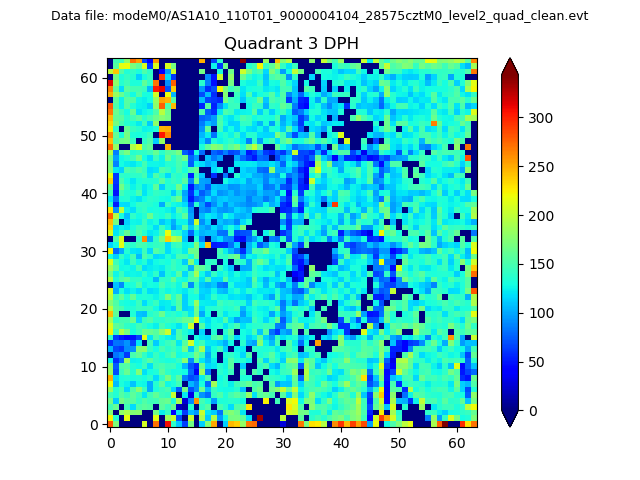 |
 |
Quadrant C |
| Plot type | Count rate plots | Images |
|---|---|---|
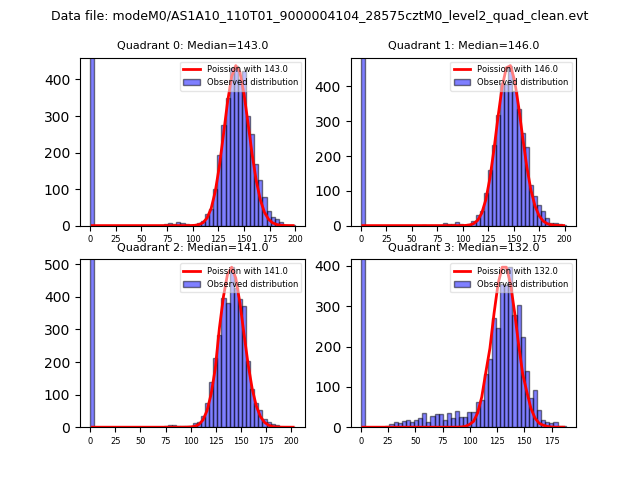
| Comparison with Poisson distribution Blue bars denote a histogram of data divided into 1 sec bins. Red curve is a Poisson curve with rate = median count rate of data. |
 |
 |
| Quadrant-wise count rates Data is divided into 100 sec bins |
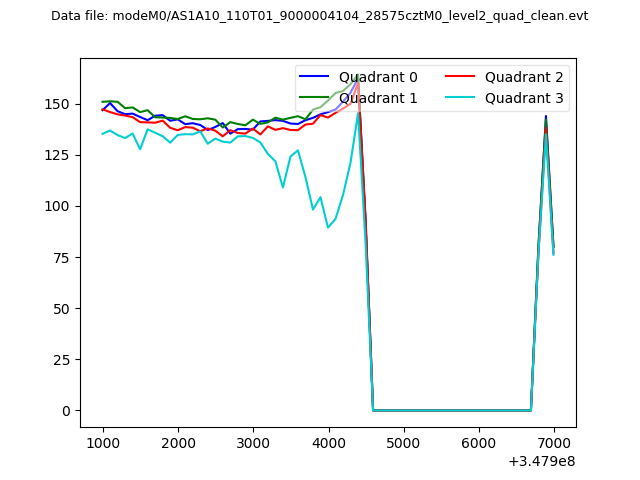 |
|
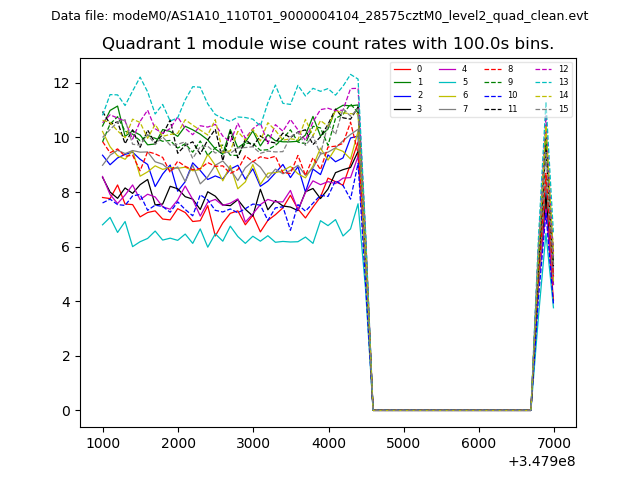
| Module-wise count rates for Quadrant A Data is divided into 100 sec bins |
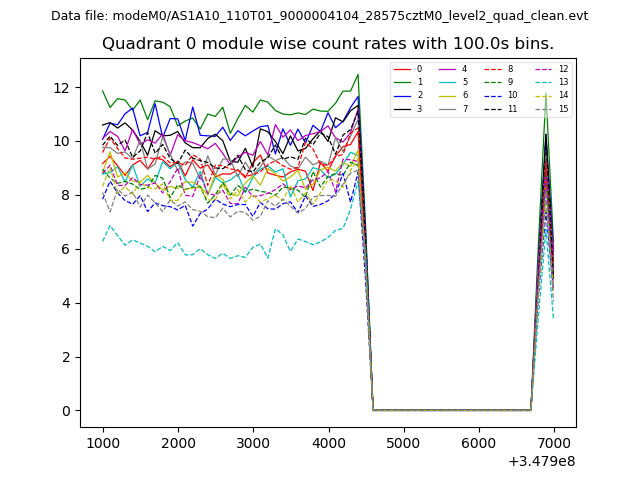 |
 |
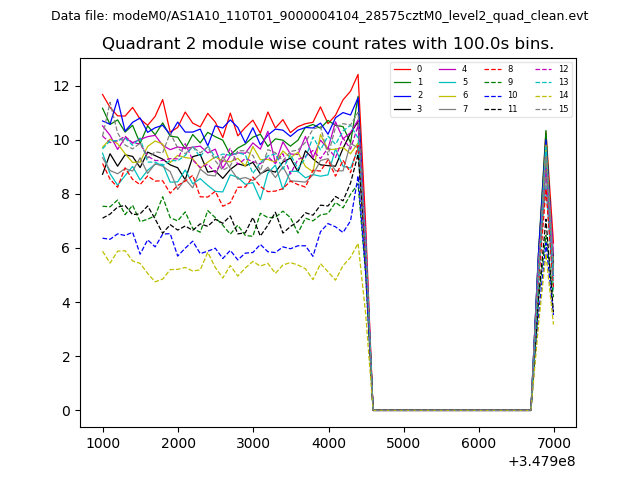
| Module-wise count rates for Quadrant B Data is divided into 100 sec bins |
 |
 |
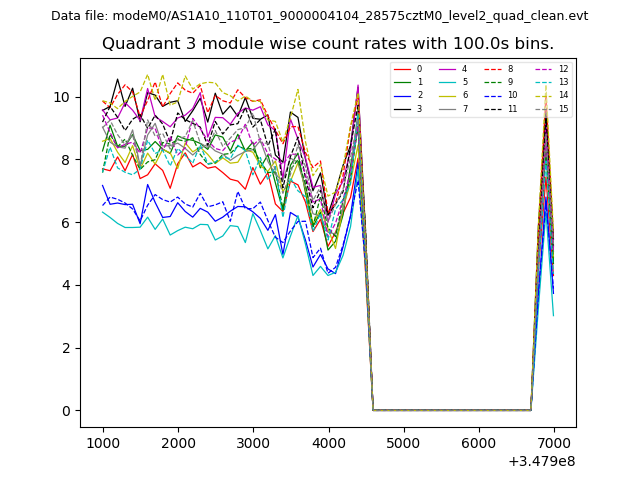
| Module-wise count rates for Quadrant C Data is divided into 100 sec bins |
 |
 |
| Module-wise count rates for Quadrant D Data is divided into 100 sec bins |
 |
 |
| Parameter | Plot |
|---|---|
| CZT HV Monitor | 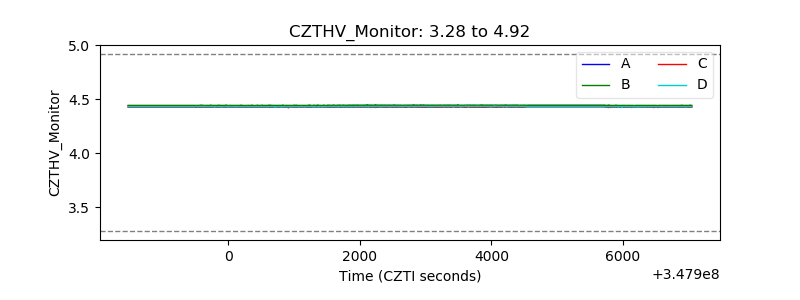 |
| D_VDD | 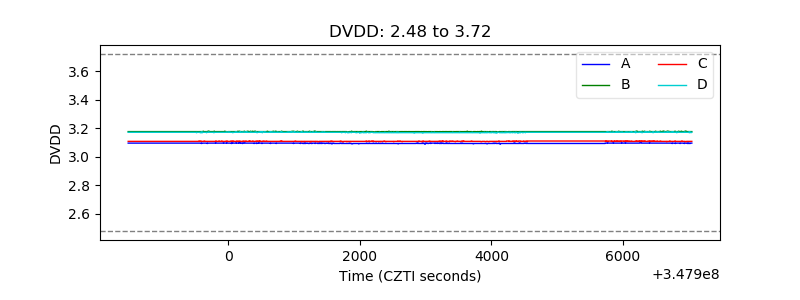 |
| Temperature 1 | 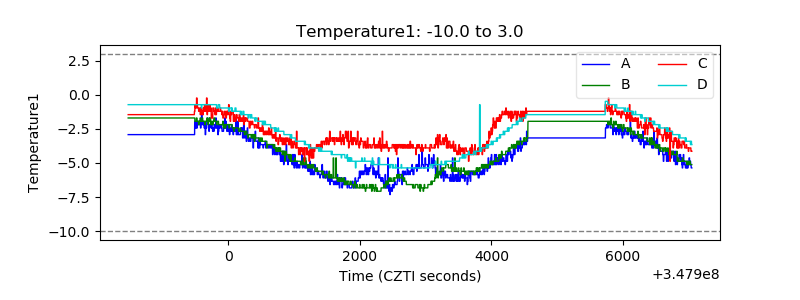 |
| Veto HV Monitor | 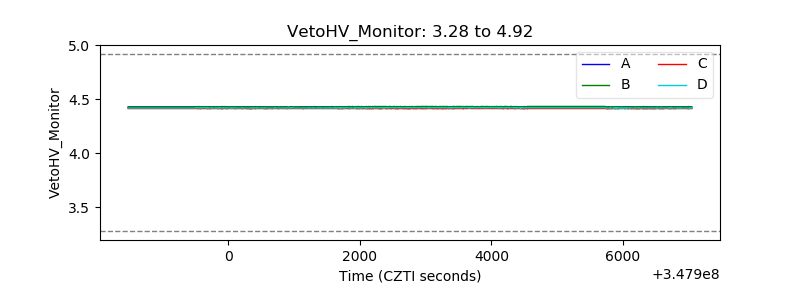 |
| Veto LLD | 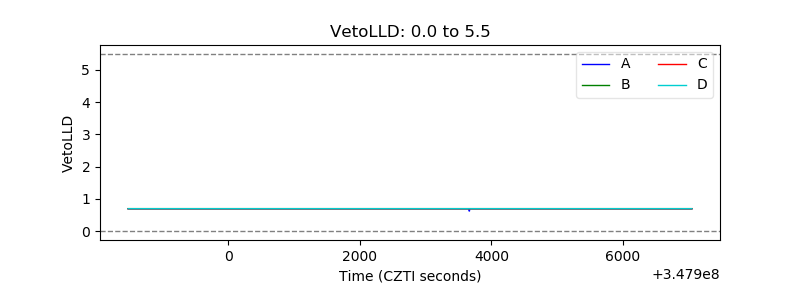 |
| Alpha Counter | 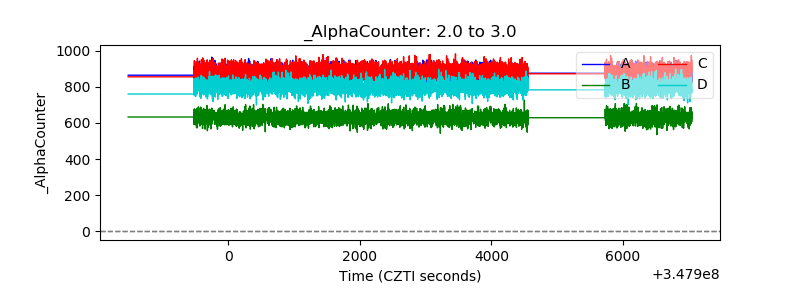 |
| _CPM_Rate | 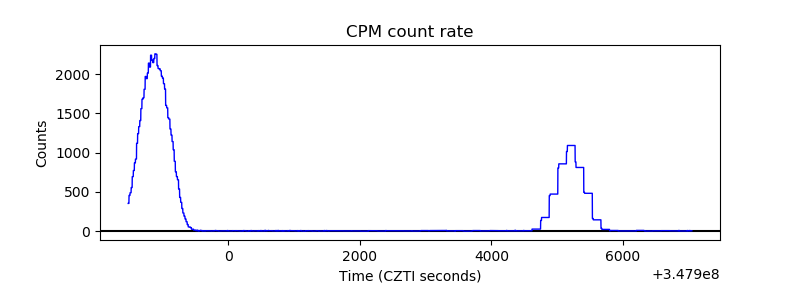 |
| CZT Counter | 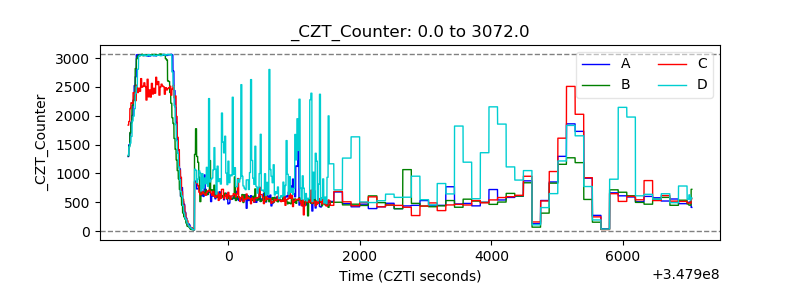 |
| +2.5 Volts monitor | 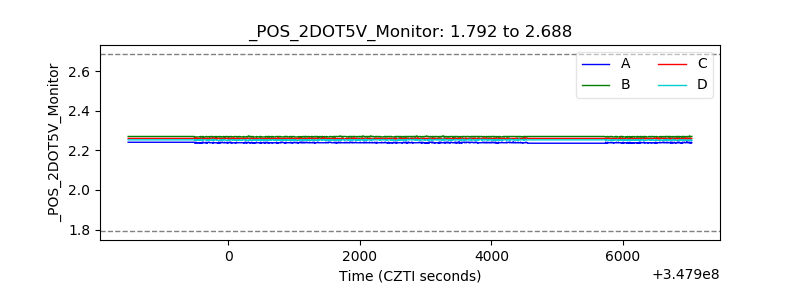 |
| +5 Volts monitor |  |
| _ROLL_ROT | 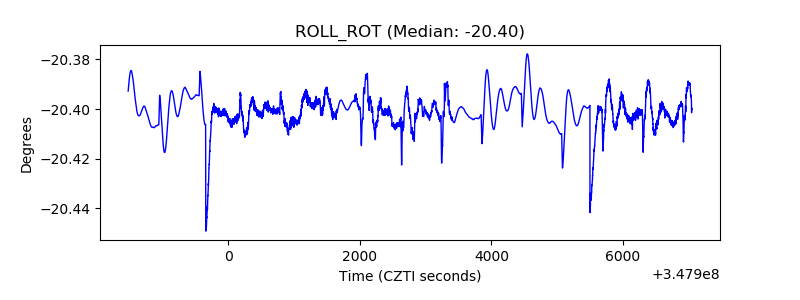 |
| _Roll_DEC | 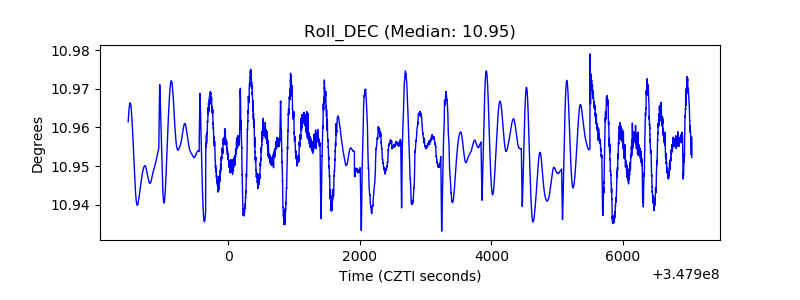 |
| _Roll_RA | 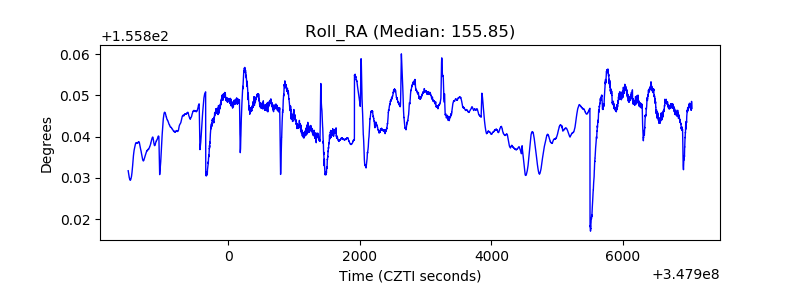 |
| Veto Counter | 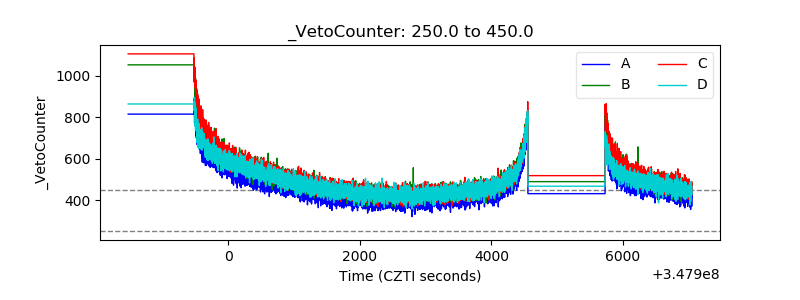 |