| Param | Original file | Final file |
|---|---|---|
| Filename | modeM0/AS1A10_102T03_9000004106_28578cztM0_level2.evt | modeM0/AS1A10_102T03_9000004106_28578cztM0_level2_quad_clean.evt |
| Size (bytes) | 554,060,160 | 99,743,040 |
| Size | 528.4 MB | 95.1 MB |
| Events in quadrant A | 3,622,211 | 634,673 |
| Events in quadrant B | 3,806,680 | 645,257 |
| Events in quadrant C | 3,652,027 | 622,415 |
| Events in quadrant D | 5,197,889 | 604,577 |
| Mode M9 | |||
|---|---|---|---|
| Quadrant | BADHDUFLAG | Total packets | Discarded packets |
| A | 0 | 3 | 0 |
| B | 0 | 3 | 0 |
| C | 0 | 3 | 0 |
| D | 0 | 3 | 0 |
| Mode M0 | |||
|---|---|---|---|
| Quadrant | BADHDUFLAG | Total packets | Discarded packets |
| A | 0 | 15543 | 1 |
| B | 0 | 15988 | 1 |
| C | 0 | 15566 | 1 |
| D | 0 | 20553 | 1 |
| Mode SS | |||
|---|---|---|---|
| Quadrant | BADHDUFLAG | Total packets | Discarded packets |
| A | 0 | 152 | 0 |
| B | 0 | 152 | 0 |
| C | 0 | 152 | 0 |
| D | 0 | 152 | 0 |
| Quadrant | Total seconds | Saturated seconds | Saturation percentage |
|---|---|---|---|
| A | 7380 | 75 | 1.016260% |
| B | 7381 | 149 | 2.018697% |
| C | 7381 | 147 | 1.991600% |
| D | 7381 | 313 | 4.240618% |
Noise dominated data is calculated using 1-second bins in cleaned event files. If a bin has >2000 counts, and if more than 50% of those come from <1% of pixels, then it is considered to be noise-dominated and hence unusable.
| Quadrant | # 1 sec bins | Bins with >0 counts | Bins with >2000 counts | High rate bins dominated by noise | Noise dominated (total time) | Noise dominated (detector-on time) | Marked lightcurve |
|---|---|---|---|---|---|---|---|
| A | 7615 | 7381 | 1 | 1 | 0.01% | 0.01% | 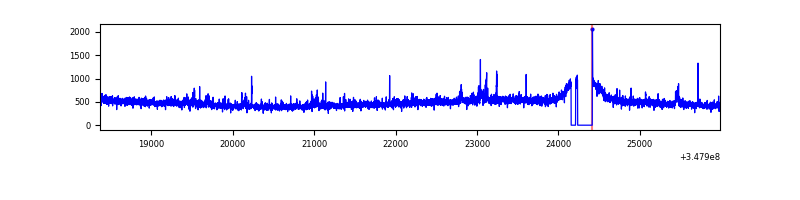 |
| B | 7616 | 7381 | 18 | 18 | 0.24% | 0.24% | 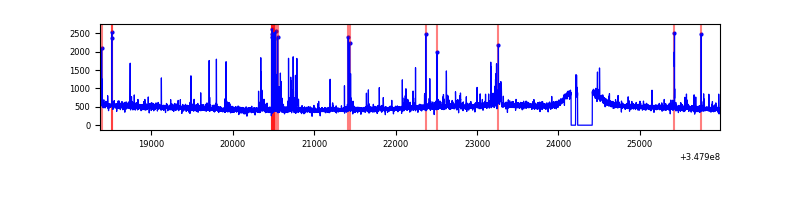 |
| C | 7616 | 7382 | 0 | 0 | 0.00% | 0.00% | 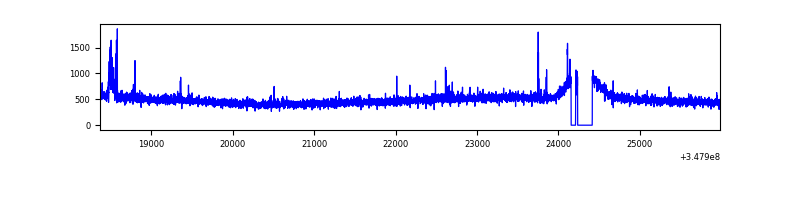 |
| D | 7616 | 7383 | 223 | 223 | 2.93% | 3.02% | 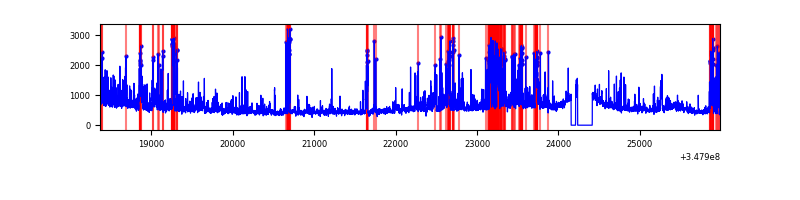 |
Top three noisy pixels from each quadrant. If the there are fewer than three noisy pixels in the level2.evt file, extra rows are filled as -1
| Pixel properties | Quadrant properties | ||||||
|---|---|---|---|---|---|---|---|
| Quadrant | DetID | PixID | Counts | Sigma | Mean | Median | Sigma |
| A | 15 | 174 | 86777 | 463.54 | 912 | 894 | 185.3 |
| A | 13 | 254 | 12865 | 64.61 | 912 | 894 | 185.3 |
| A | 3 | 137 | 9063 | 44.09 | 912 | 894 | 185.3 |
| B | 4 | 171 | 187326 | 1062.4 | 907 | 885 | 175.5 |
| B | 12 | 111 | 21777 | 119.05 | 907 | 885 | 175.5 |
| B | 11 | 111 | 19651 | 106.93 | 907 | 885 | 175.5 |
| C | 14 | 238 | 141228 | 673.08 | 876 | 882 | 208.5 |
| C | 0 | 207 | 40480 | 189.91 | 876 | 882 | 208.5 |
| C | 7 | 247 | 29730 | 138.35 | 876 | 882 | 208.5 |
| D | 1 | 52 | 1283663 | 6055.75 | 873 | 848 | 211.8 |
| D | 8 | 195 | 320188 | 1507.5 | 873 | 848 | 211.8 |
| D | 12 | 79 | 141807 | 665.42 | 873 | 848 | 211.8 |
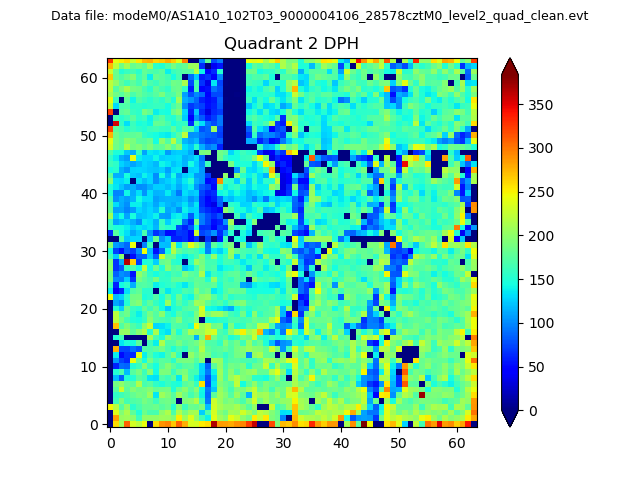
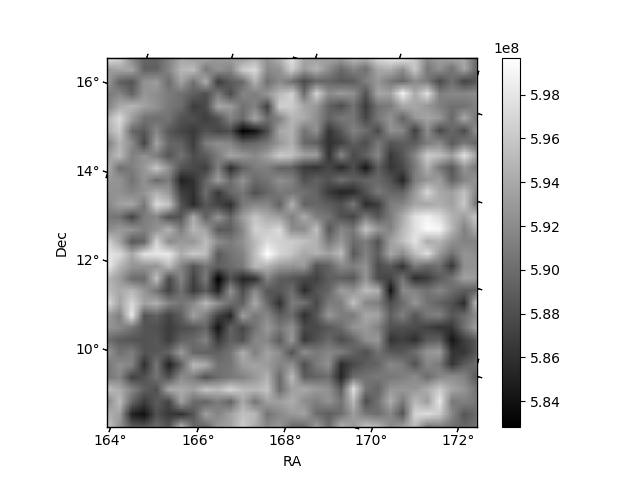
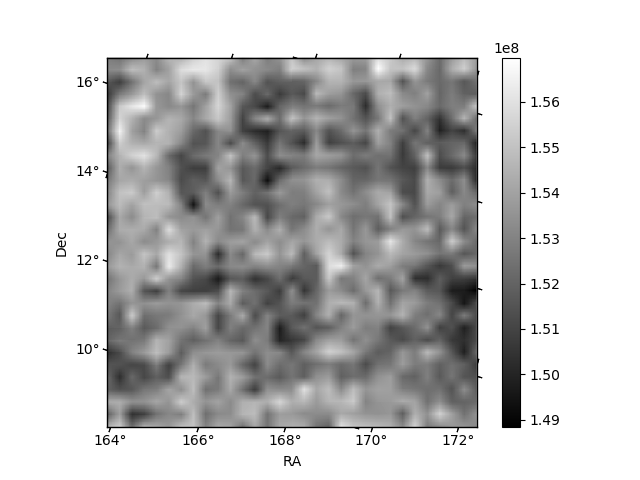
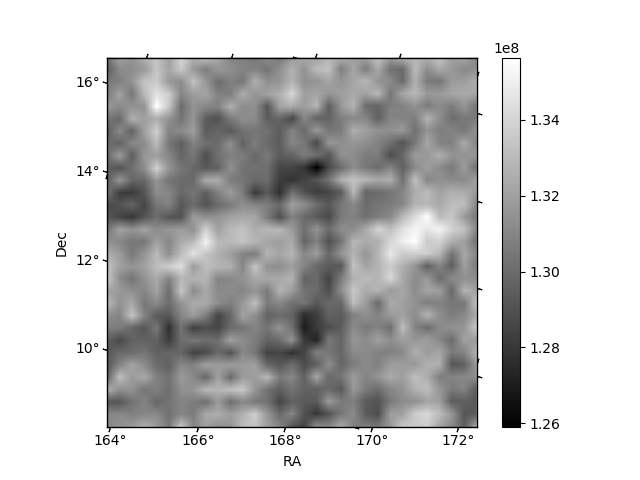
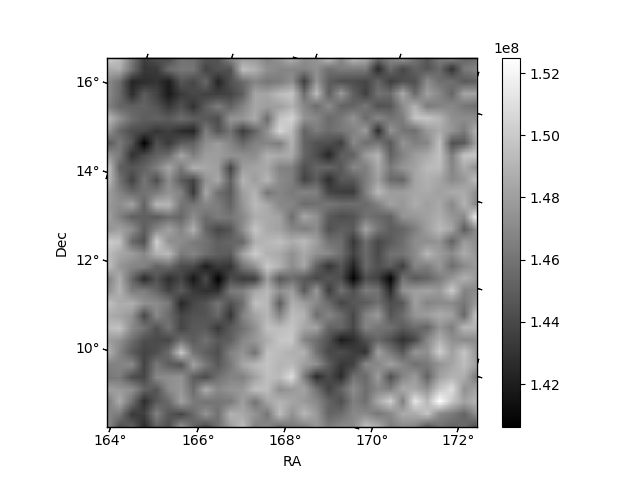
Histogram calculated using DETX and DETY for each event in the final _common_clean file
| Quadrant A | 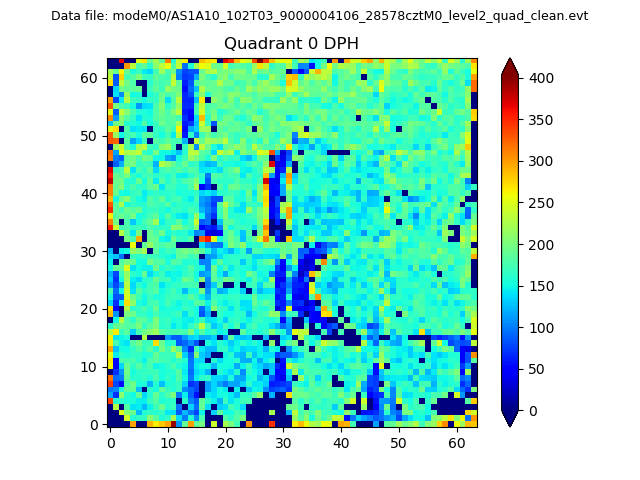 |
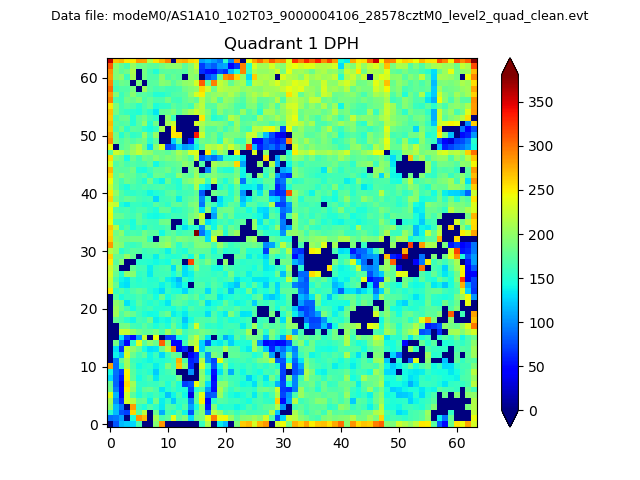 |
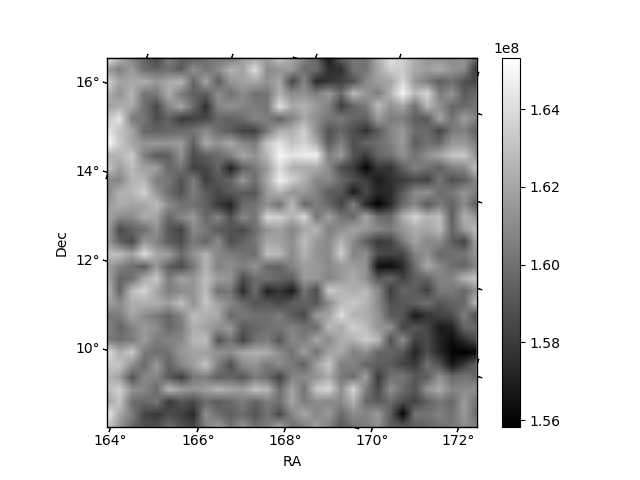
Quadrant B |
|---|---|---|---|
| Quadrant D | 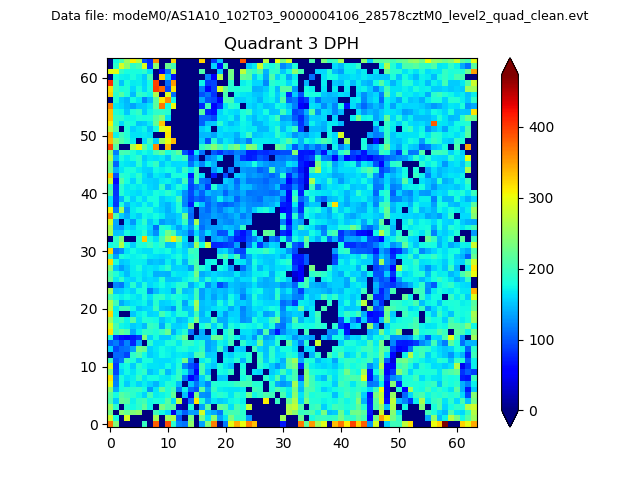 |
 |
Quadrant C |
| Plot type | Count rate plots | Images |
|---|---|---|
| Comparison with Poisson distribution Blue bars denote a histogram of data divided into 1 sec bins. Red curve is a Poisson curve with rate = median count rate of data. |
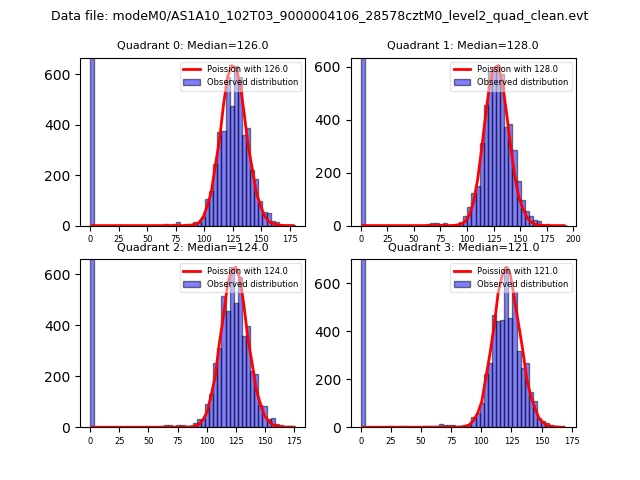 |
 |
| Quadrant-wise count rates Data is divided into 100 sec bins |
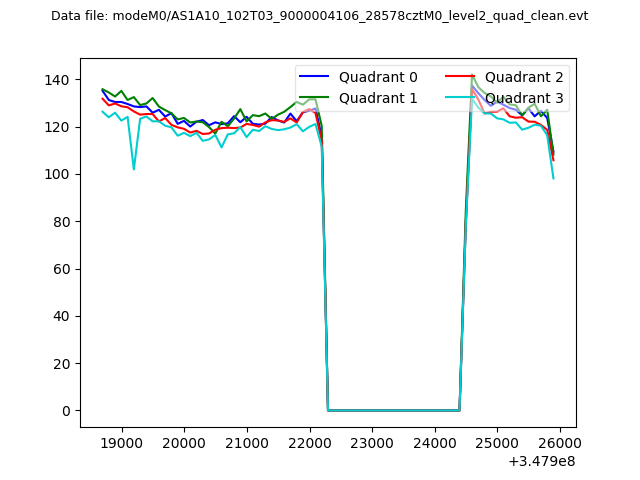 |
|
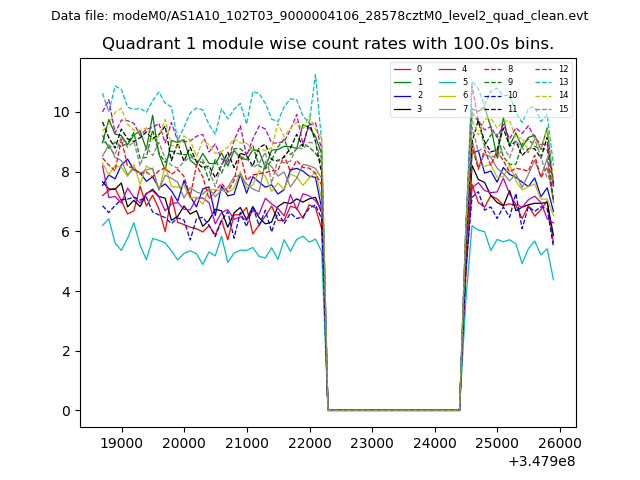
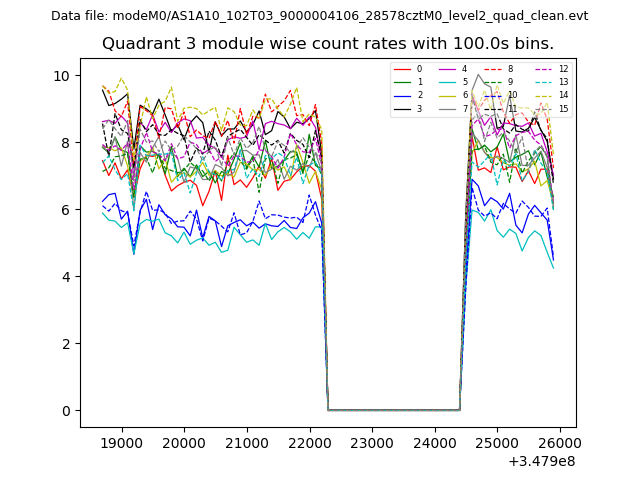
| Module-wise count rates for Quadrant A Data is divided into 100 sec bins |
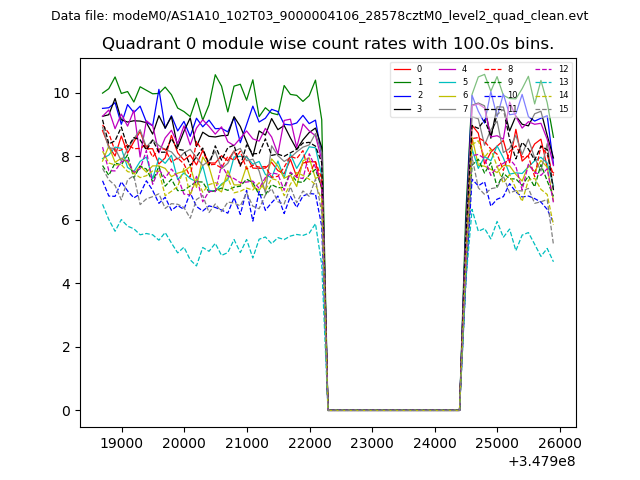 |
 |
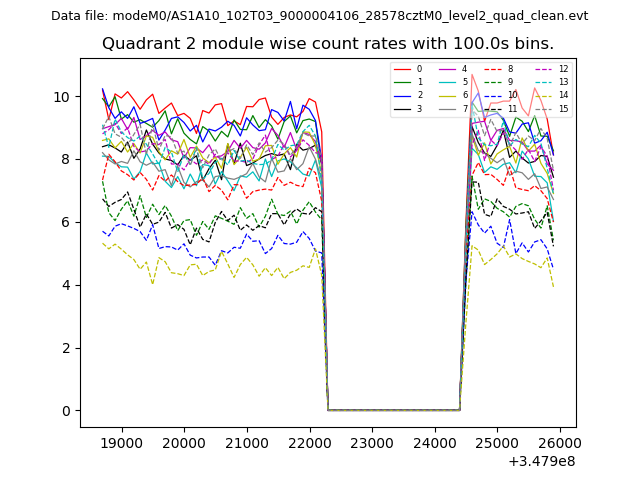
| Module-wise count rates for Quadrant B Data is divided into 100 sec bins |
 |
 |
| Module-wise count rates for Quadrant C Data is divided into 100 sec bins |
 |
 |
| Module-wise count rates for Quadrant D Data is divided into 100 sec bins |
 |
 |
| Parameter | Plot |
|---|---|
| CZT HV Monitor | 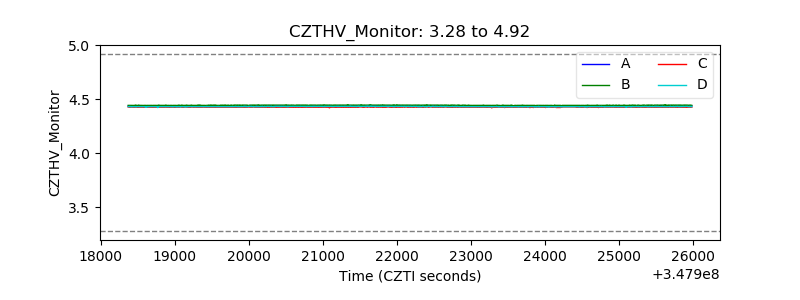 |
| D_VDD | 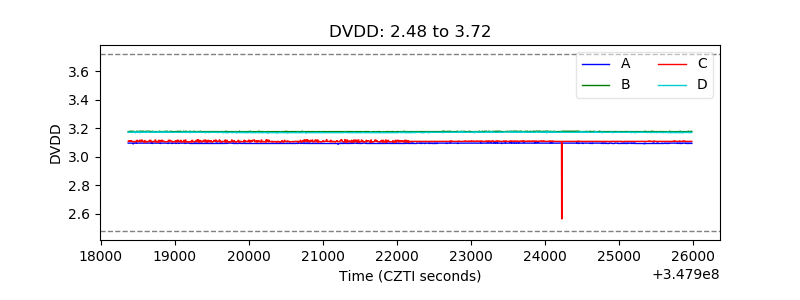 |
| Temperature 1 | 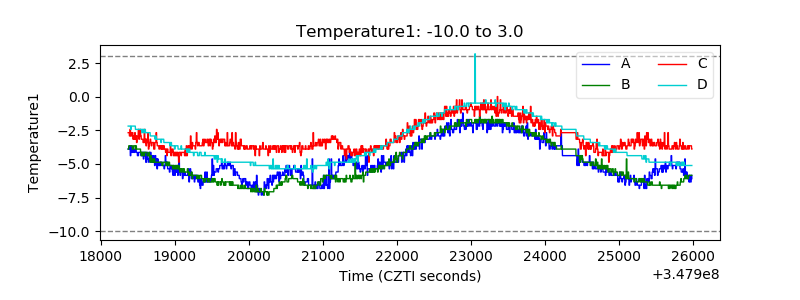 |
| Veto HV Monitor | 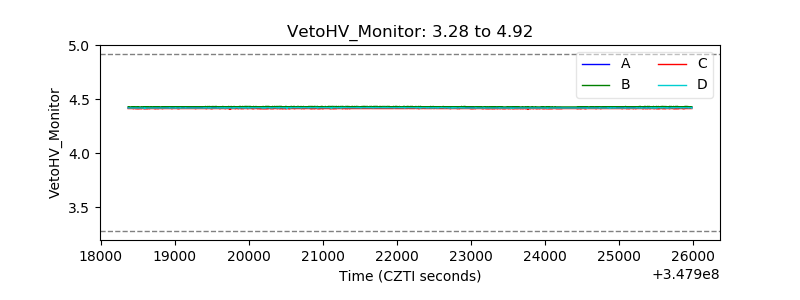 |
| Veto LLD | 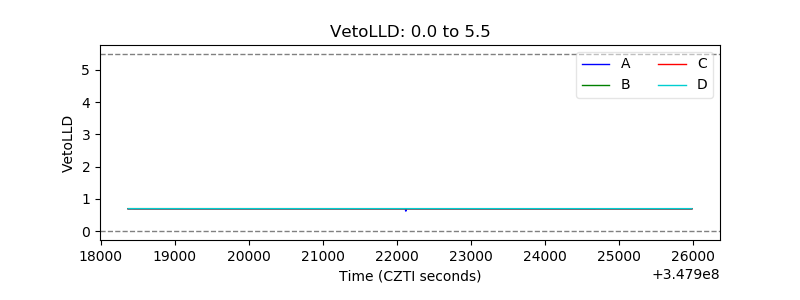 |
| Alpha Counter | 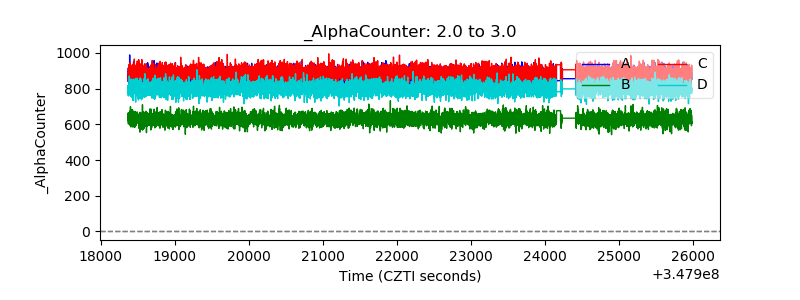 |
| _CPM_Rate | 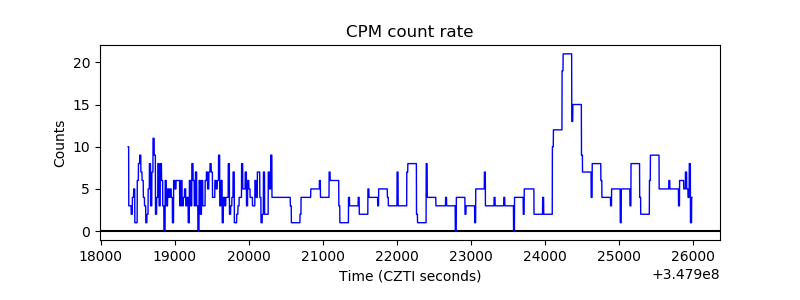 |
| CZT Counter | 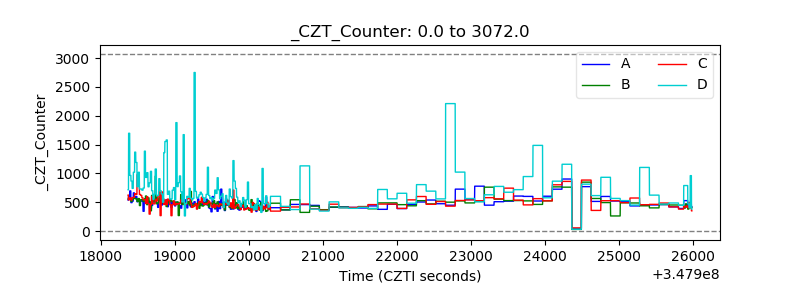 |
| +2.5 Volts monitor |  |
| +5 Volts monitor |  |
| _ROLL_ROT | 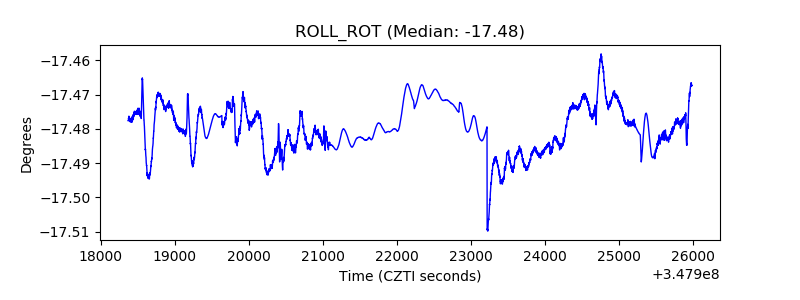 |
| _Roll_DEC | 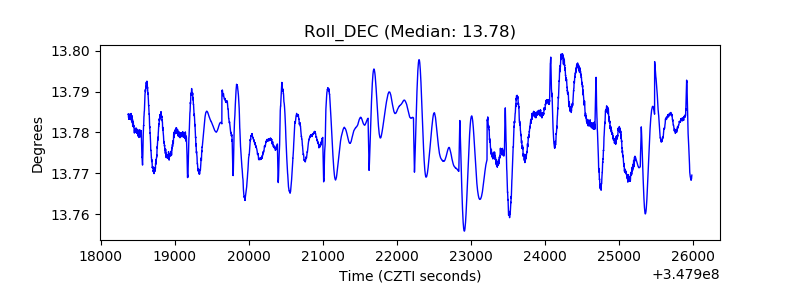 |
| _Roll_RA | 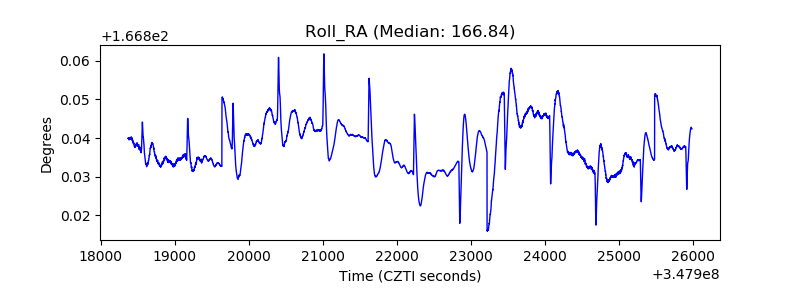 |
| Veto Counter | 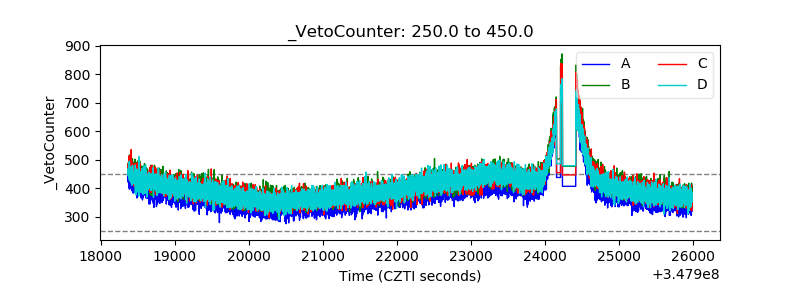 |