| Param | Original file | Final file |
|---|---|---|
| Filename | modeM0/AS1A10_102T03_9000004106_28583cztM0_level2.evt | modeM0/AS1A10_102T03_9000004106_28583cztM0_level2_quad_clean.evt |
| Size (bytes) | 472,222,080 | 90,665,280 |
| Size | 450.3 MB | 86.5 MB |
| Events in quadrant A | 3,173,848 | 579,377 |
| Events in quadrant B | 3,253,395 | 589,997 |
| Events in quadrant C | 3,194,007 | 567,546 |
| Events in quadrant D | 4,234,102 | 550,801 |
| Mode M9 | |||
|---|---|---|---|
| Quadrant | BADHDUFLAG | Total packets | Discarded packets |
| A | 0 | 10 | 0 |
| B | 0 | 10 | 0 |
| C | 0 | 10 | 0 |
| D | 0 | 10 | 0 |
| Mode M0 | |||
|---|---|---|---|
| Quadrant | BADHDUFLAG | Total packets | Discarded packets |
| A | 0 | 13439 | 1 |
| B | 0 | 13638 | 1 |
| C | 0 | 13458 | 1 |
| D | 0 | 16681 | 1 |
| Mode SS | |||
|---|---|---|---|
| Quadrant | BADHDUFLAG | Total packets | Discarded packets |
| A | 0 | 132 | 0 |
| B | 0 | 132 | 0 |
| C | 0 | 132 | 0 |
| D | 0 | 132 | 0 |
| Quadrant | Total seconds | Saturated seconds | Saturation percentage |
|---|---|---|---|
| A | 6570 | 44 | 0.669711% |
| B | 6571 | 54 | 0.821793% |
| C | 6571 | 65 | 0.989195% |
| D | 6571 | 119 | 1.810988% |
Noise dominated data is calculated using 1-second bins in cleaned event files. If a bin has >2000 counts, and if more than 50% of those come from <1% of pixels, then it is considered to be noise-dominated and hence unusable.
| Quadrant | # 1 sec bins | Bins with >0 counts | Bins with >2000 counts | High rate bins dominated by noise | Noise dominated (total time) | Noise dominated (detector-on time) | Marked lightcurve |
|---|---|---|---|---|---|---|---|
| A | 7550 | 6570 | 0 | 0 | 0.00% | 0.00% | 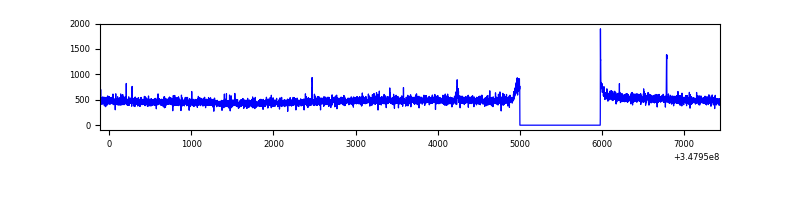 |
| B | 7551 | 6571 | 4 | 4 | 0.05% | 0.06% | 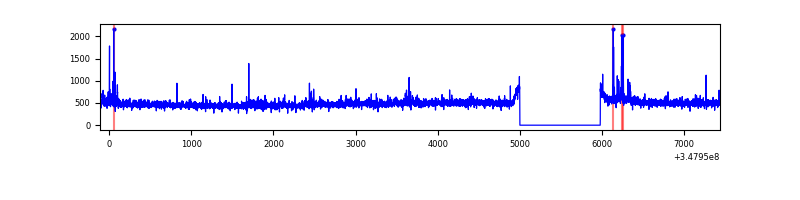 |
| C | 7551 | 6571 | 0 | 0 | 0.00% | 0.00% | 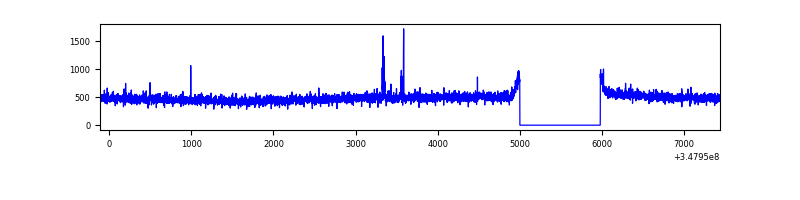 |
| D | 7551 | 6571 | 77 | 77 | 1.02% | 1.17% | 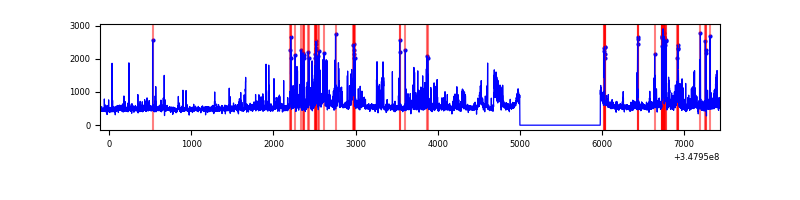 |
Top three noisy pixels from each quadrant. If the there are fewer than three noisy pixels in the level2.evt file, extra rows are filled as -1
| Pixel properties | Quadrant properties | ||||||
|---|---|---|---|---|---|---|---|
| Quadrant | DetID | PixID | Counts | Sigma | Mean | Median | Sigma |
| A | 15 | 47 | 13132 | 75.06 | 814 | 799 | 164.3 |
| A | 15 | 174 | 11059 | 62.44 | 814 | 799 | 164.3 |
| A | 13 | 254 | 10570 | 59.47 | 814 | 799 | 164.3 |
| B | 4 | 171 | 71812 | 458.56 | 803 | 782 | 154.9 |
| B | 12 | 111 | 19071 | 118.07 | 803 | 782 | 154.9 |
| B | 11 | 111 | 17754 | 109.57 | 803 | 782 | 154.9 |
| C | 14 | 238 | 124246 | 674.76 | 779 | 783 | 183.0 |
| C | 7 | 247 | 31178 | 166.12 | 779 | 783 | 183.0 |
| C | 13 | 61 | 5402 | 25.24 | 779 | 783 | 183.0 |
| D | 1 | 52 | 692623 | 3710.51 | 785 | 763 | 186.5 |
| D | 8 | 195 | 357468 | 1913.04 | 785 | 763 | 186.5 |
| D | 7 | 80 | 203585 | 1087.75 | 785 | 763 | 186.5 |
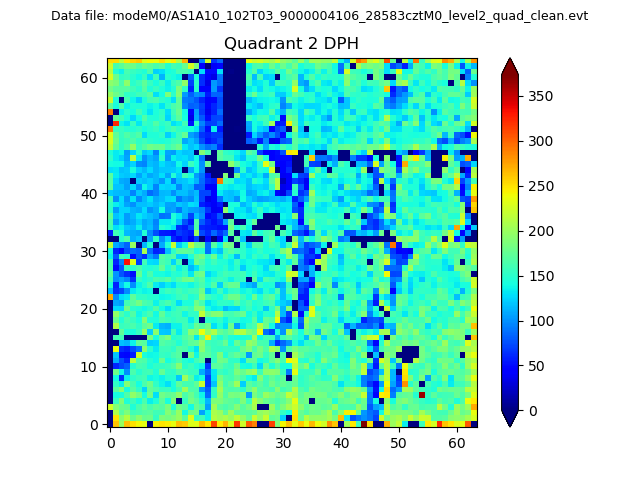
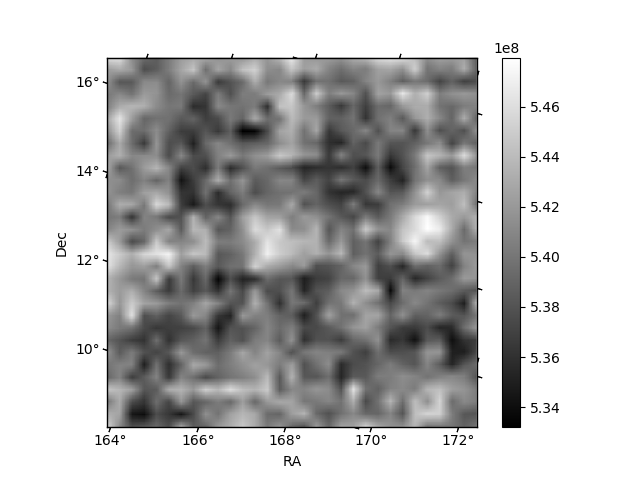
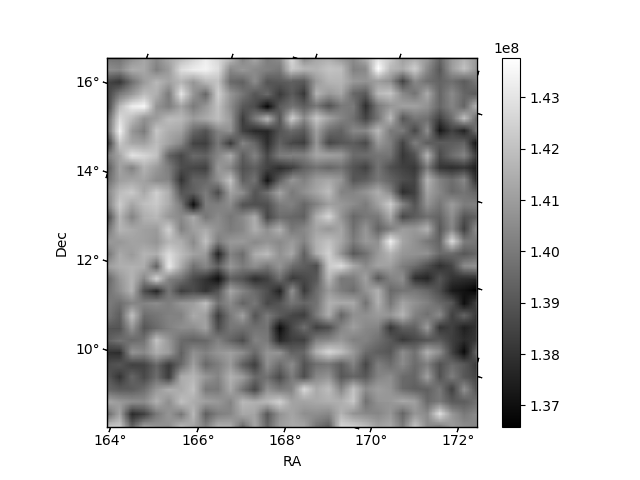
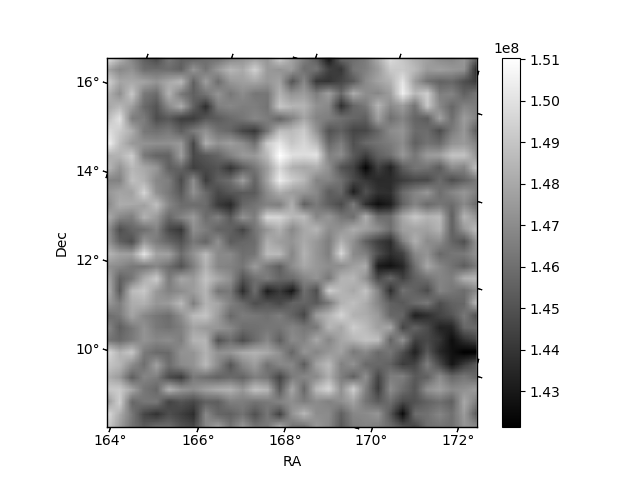
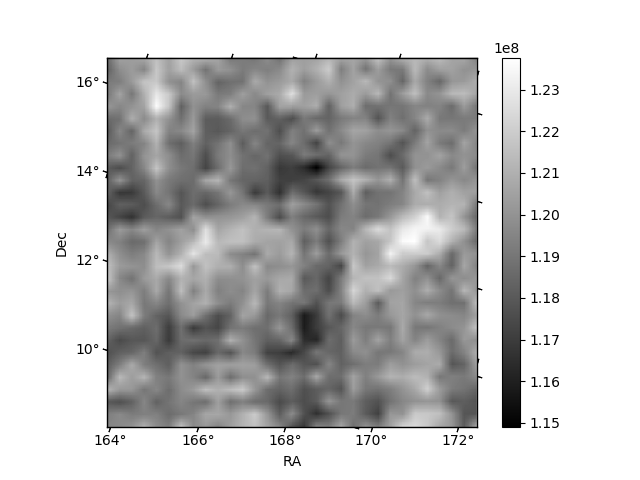
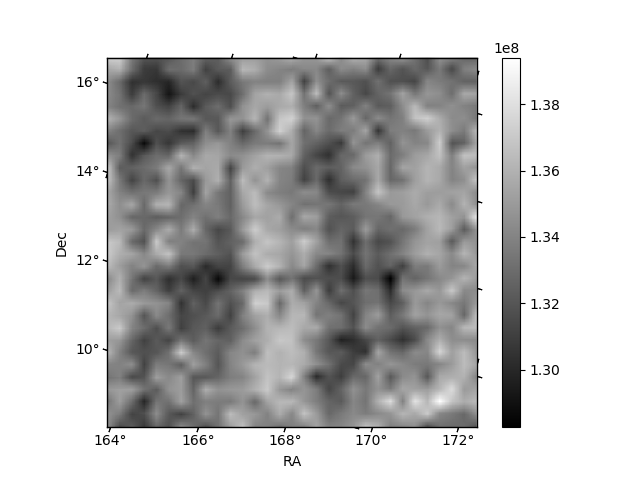
Histogram calculated using DETX and DETY for each event in the final _common_clean file
| Quadrant A | 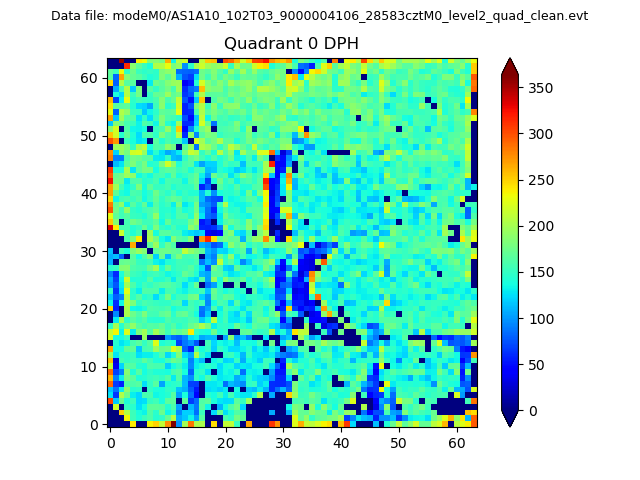 |
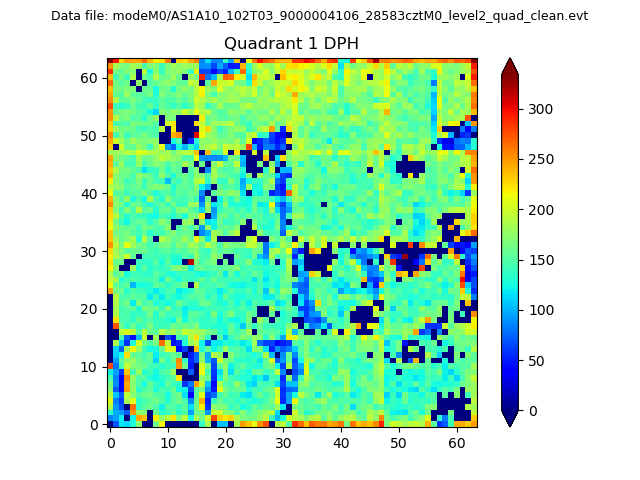 |
Quadrant B |
|---|---|---|---|
| Quadrant D | 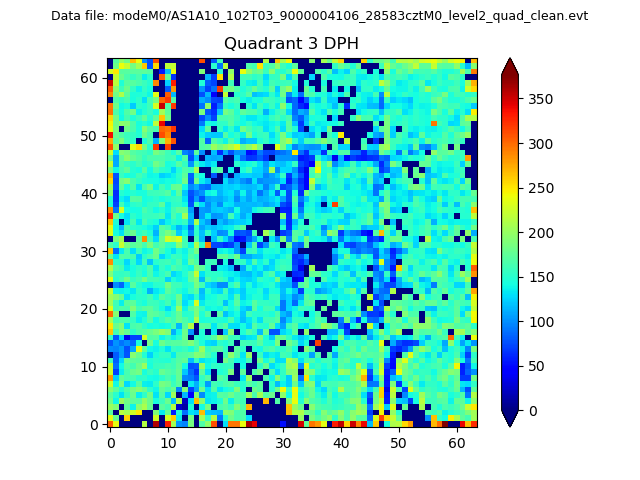 |
 |
Quadrant C |
| Plot type | Count rate plots | Images |
|---|---|---|
| Comparison with Poisson distribution Blue bars denote a histogram of data divided into 1 sec bins. Red curve is a Poisson curve with rate = median count rate of data. |
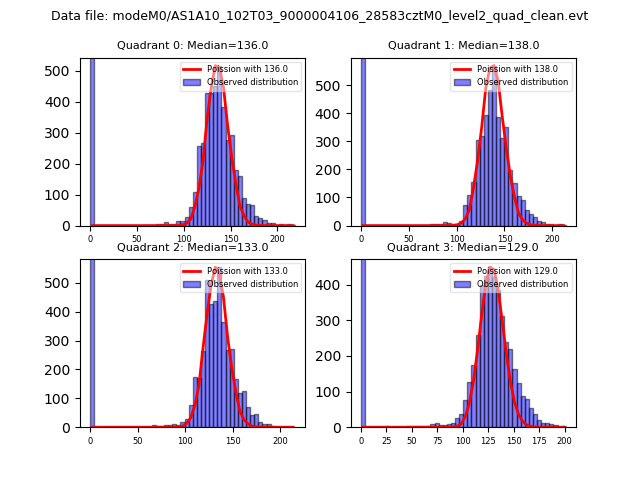 |
 |
| Quadrant-wise count rates Data is divided into 100 sec bins |
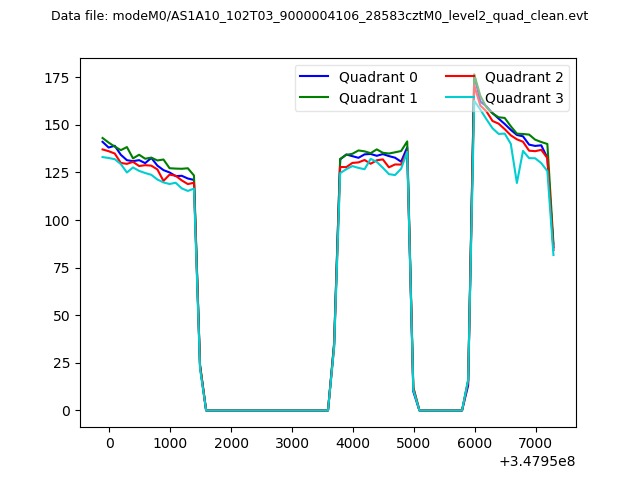 |
|
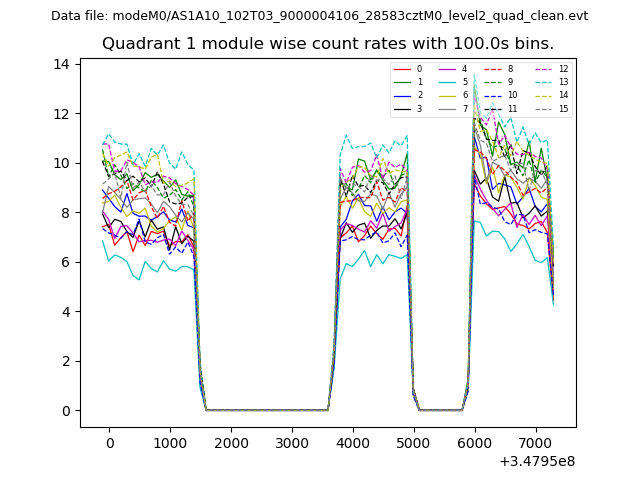
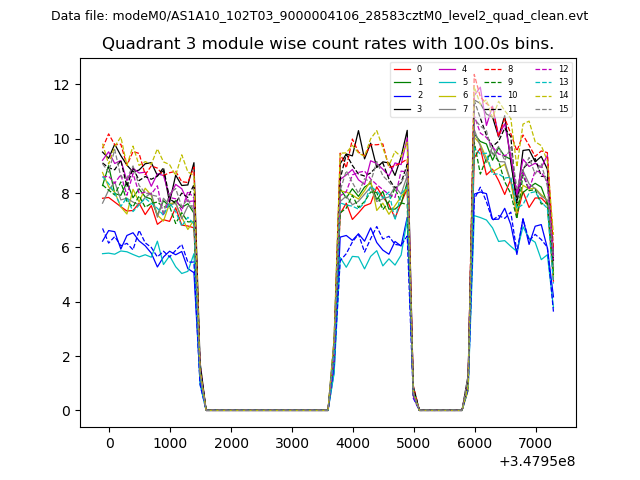
| Module-wise count rates for Quadrant A Data is divided into 100 sec bins |
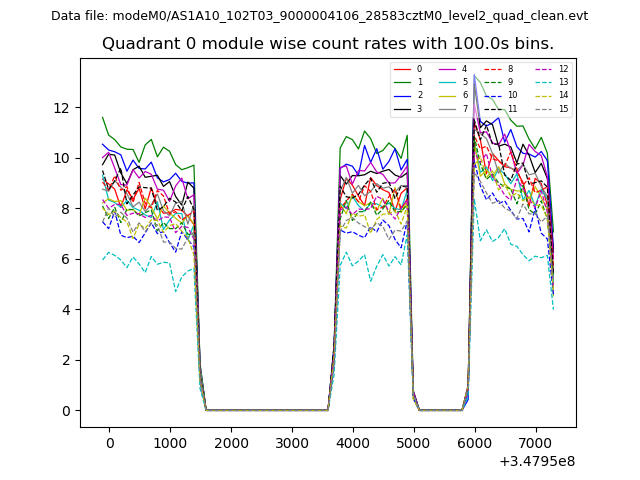 |
 |
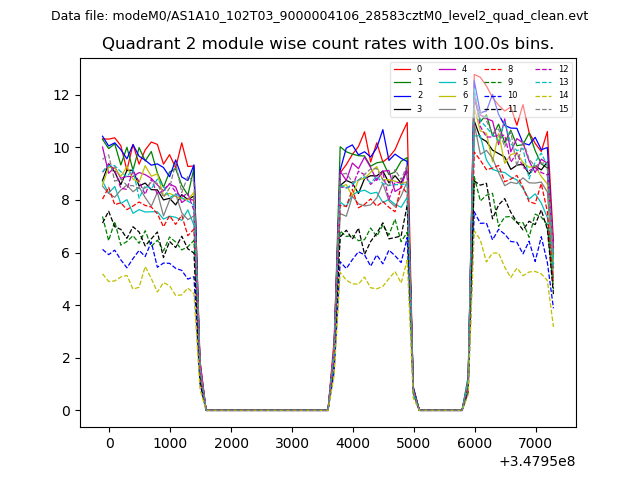
| Module-wise count rates for Quadrant B Data is divided into 100 sec bins |
 |
 |
| Module-wise count rates for Quadrant C Data is divided into 100 sec bins |
 |
 |
| Module-wise count rates for Quadrant D Data is divided into 100 sec bins |
 |
 |
| Parameter | Plot |
|---|---|
| CZT HV Monitor | 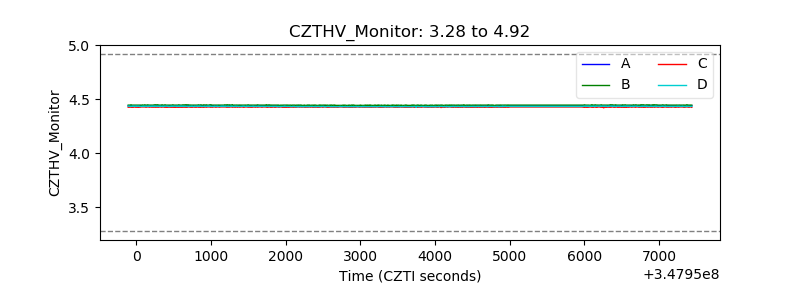 |
| D_VDD | 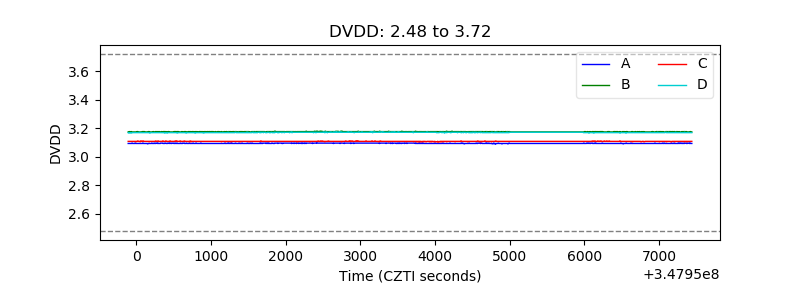 |
| Temperature 1 | 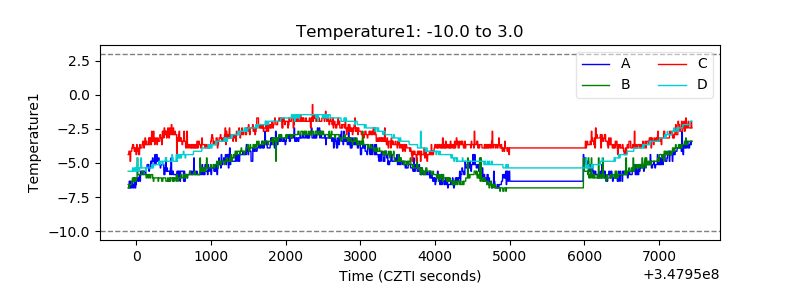 |
| Veto HV Monitor | 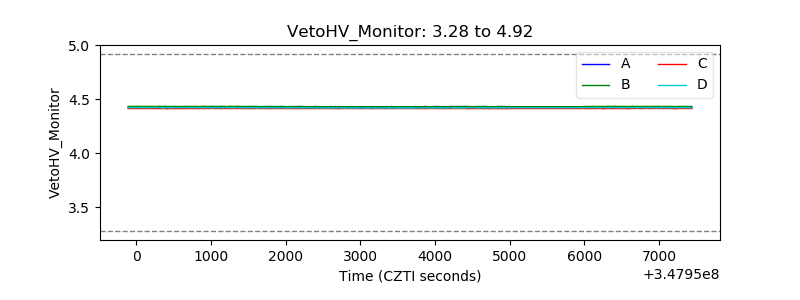 |
| Veto LLD | 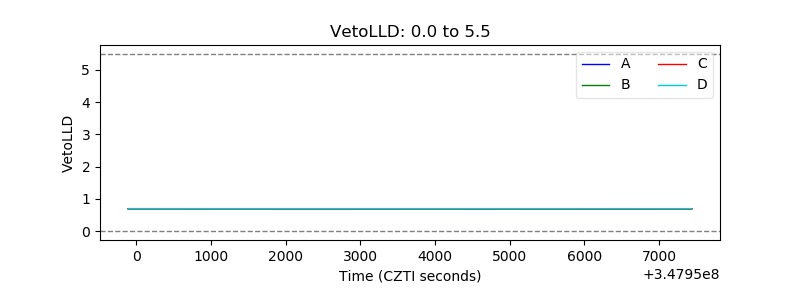 |
| Alpha Counter | 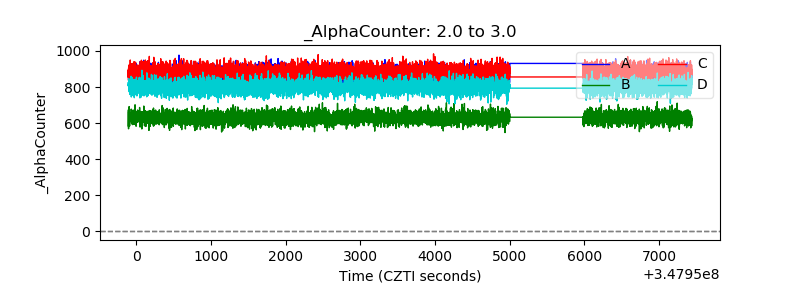 |
| _CPM_Rate | 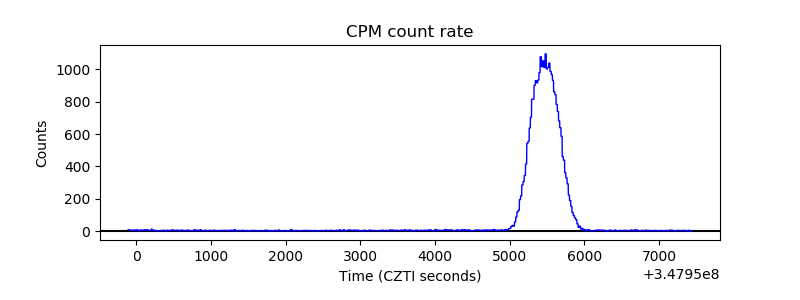 |
| CZT Counter | 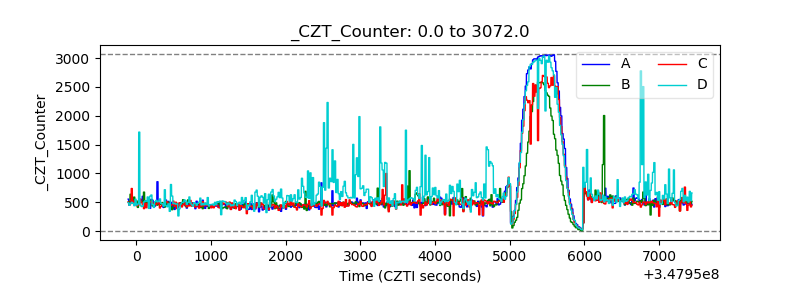 |
| +2.5 Volts monitor |  |
| +5 Volts monitor |  |
| _ROLL_ROT | 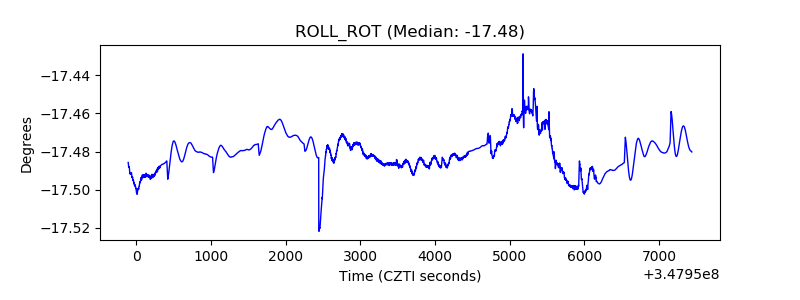 |
| _Roll_DEC | 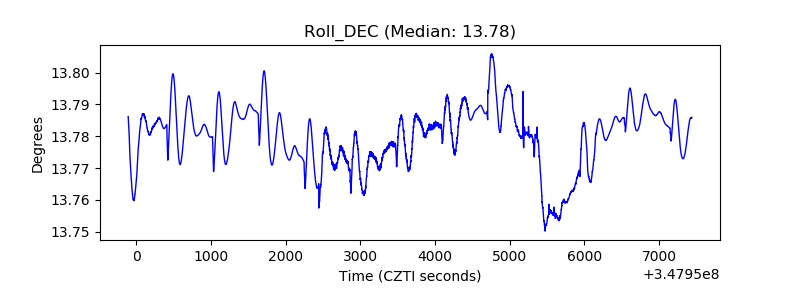 |
| _Roll_RA | 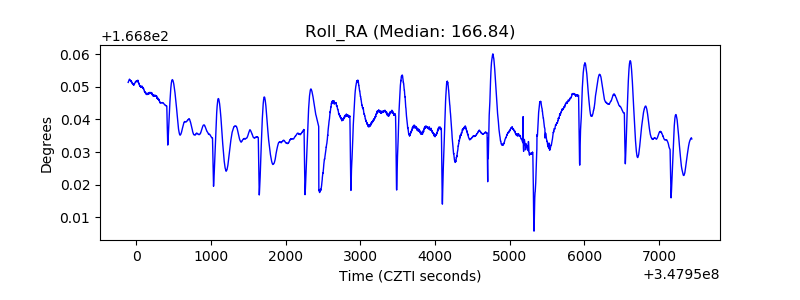 |
| Veto Counter | 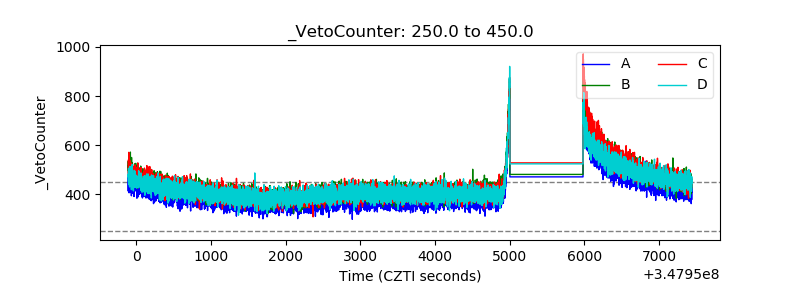 |