| Param | Original file | Final file |
|---|---|---|
| Filename | modeM0/AS1A10_102T03_9000004106_28585cztM0_level2.evt | modeM0/AS1A10_102T03_9000004106_28585cztM0_level2_quad_clean.evt |
| Size (bytes) | 495,855,360 | 75,827,520 |
| Size | 472.9 MB | 72.3 MB |
| Events in quadrant A | 2,994,386 | 480,235 |
| Events in quadrant B | 3,031,094 | 486,686 |
| Events in quadrant C | 3,032,751 | 467,204 |
| Events in quadrant D | 5,556,278 | 447,278 |
| Mode M9 | |||
|---|---|---|---|
| Quadrant | BADHDUFLAG | Total packets | Discarded packets |
| A | 0 | 11 | 0 |
| B | 0 | 11 | 0 |
| C | 0 | 11 | 0 |
| D | 0 | 11 | 0 |
| Mode M0 | |||
|---|---|---|---|
| Quadrant | BADHDUFLAG | Total packets | Discarded packets |
| A | 0 | 12489 | 1 |
| B | 0 | 12547 | 1 |
| C | 0 | 12532 | 1 |
| D | 0 | 20620 | 1 |
| Mode SS | |||
|---|---|---|---|
| Quadrant | BADHDUFLAG | Total packets | Discarded packets |
| A | 0 | 120 | 0 |
| B | 0 | 120 | 0 |
| C | 0 | 120 | 0 |
| D | 0 | 120 | 0 |
| Quadrant | Total seconds | Saturated seconds | Saturation percentage |
|---|---|---|---|
| A | 5936 | 56 | 0.943396% |
| B | 5937 | 53 | 0.892707% |
| C | 5937 | 87 | 1.465387% |
| D | 5937 | 519 | 8.741789% |
Noise dominated data is calculated using 1-second bins in cleaned event files. If a bin has >2000 counts, and if more than 50% of those come from <1% of pixels, then it is considered to be noise-dominated and hence unusable.
| Quadrant | # 1 sec bins | Bins with >0 counts | Bins with >2000 counts | High rate bins dominated by noise | Noise dominated (total time) | Noise dominated (detector-on time) | Marked lightcurve |
|---|---|---|---|---|---|---|---|
| A | 7036 | 5936 | 0 | 0 | 0.00% | 0.00% | 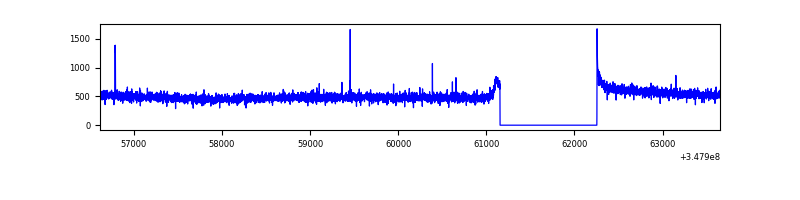 |
| B | 7037 | 5937 | 1 | 1 | 0.01% | 0.02% | 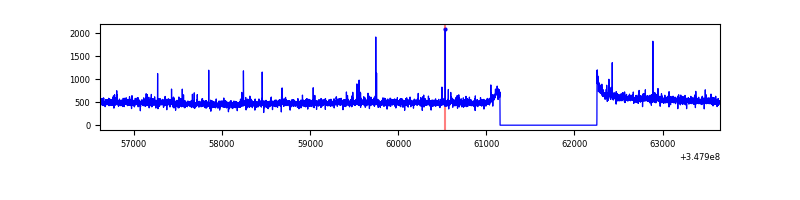 |
| C | 7037 | 5937 | 0 | 0 | 0.00% | 0.00% | 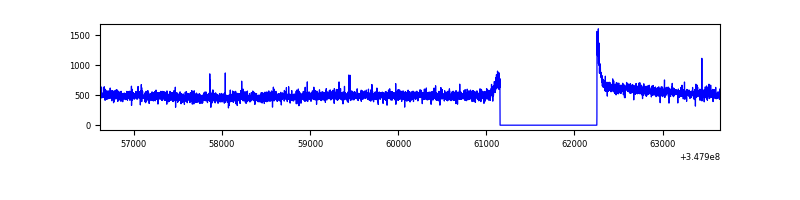 |
| D | 7037 | 5937 | 429 | 429 | 6.10% | 7.23% | 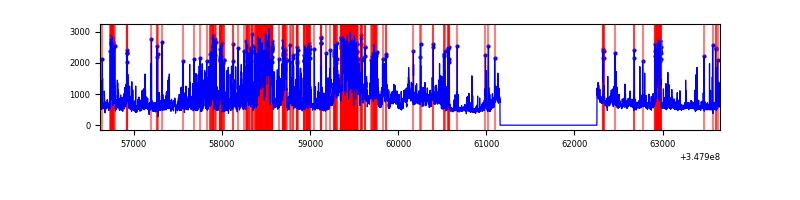 |
Top three noisy pixels from each quadrant. If the there are fewer than three noisy pixels in the level2.evt file, extra rows are filled as -1
| Pixel properties | Quadrant properties | ||||||
|---|---|---|---|---|---|---|---|
| Quadrant | DetID | PixID | Counts | Sigma | Mean | Median | Sigma |
| A | 13 | 254 | 8181 | 47.54 | 773 | 758 | 156.2 |
| A | 15 | 47 | 7573 | 43.64 | 773 | 758 | 156.2 |
| A | 3 | 137 | 7365 | 42.31 | 773 | 758 | 156.2 |
| B | 4 | 171 | 30841 | 208.84 | 757 | 739 | 144.1 |
| B | 12 | 111 | 17476 | 116.12 | 757 | 739 | 144.1 |
| B | 11 | 111 | 16454 | 109.03 | 757 | 739 | 144.1 |
| C | 14 | 238 | 121978 | 700.93 | 738 | 742 | 173.0 |
| C | 7 | 247 | 18034 | 99.97 | 738 | 742 | 173.0 |
| C | 0 | 10 | 14664 | 80.49 | 738 | 742 | 173.0 |
| D | 1 | 52 | 1771209 | 10150.49 | 729 | 711 | 174.4 |
| D | 8 | 195 | 703001 | 4026.32 | 729 | 711 | 174.4 |
| D | 7 | 80 | 299293 | 1711.81 | 729 | 711 | 174.4 |
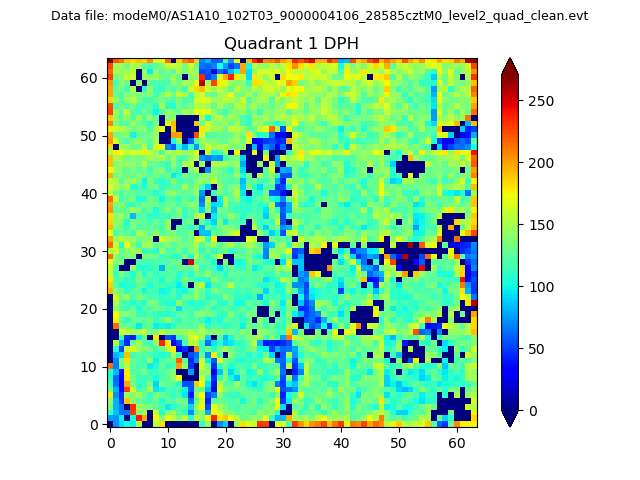
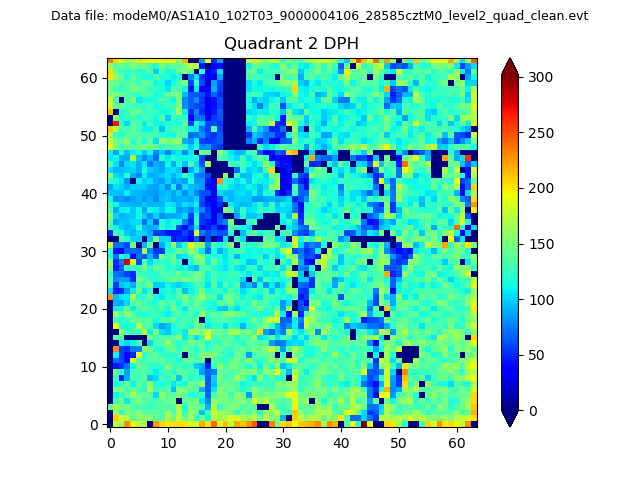
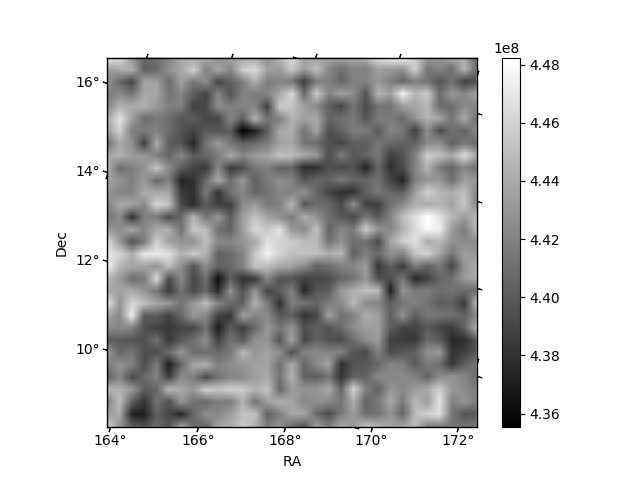
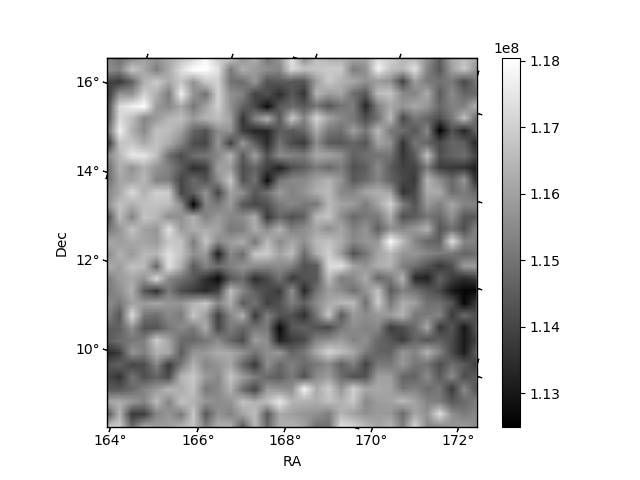
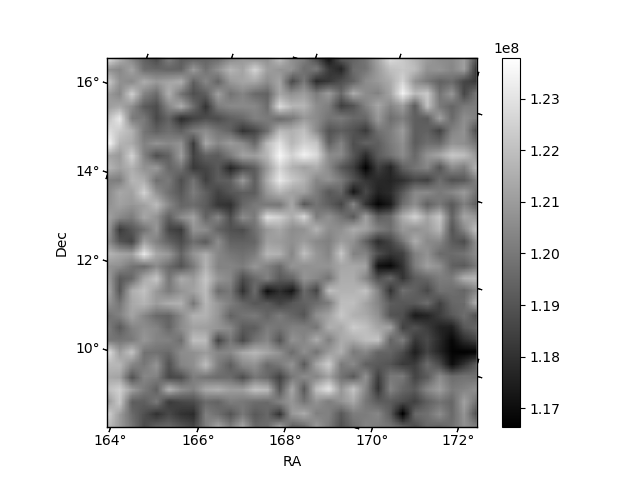
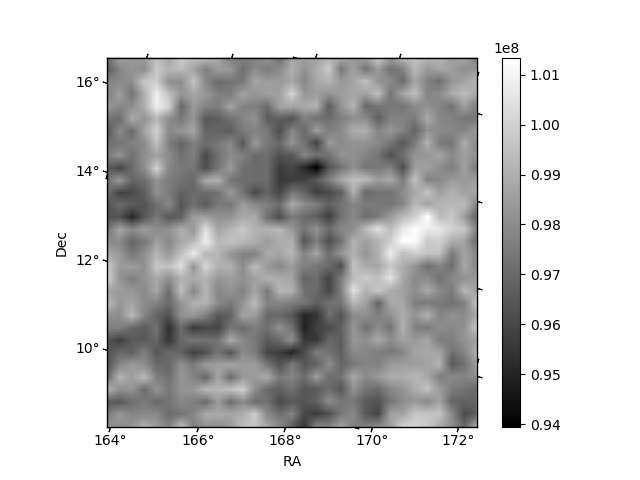
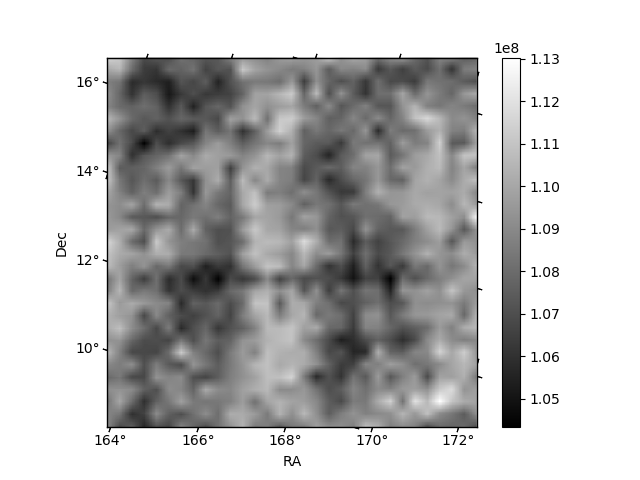
Histogram calculated using DETX and DETY for each event in the final _common_clean file
| Quadrant A |  |
 |
Quadrant B |
|---|---|---|---|
| Quadrant D | 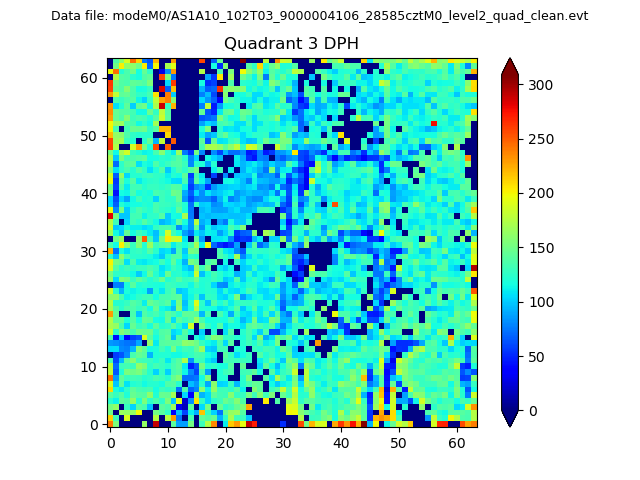 |
 |
Quadrant C |
| Plot type | Count rate plots | Images |
|---|---|---|
| Comparison with Poisson distribution Blue bars denote a histogram of data divided into 1 sec bins. Red curve is a Poisson curve with rate = median count rate of data. |
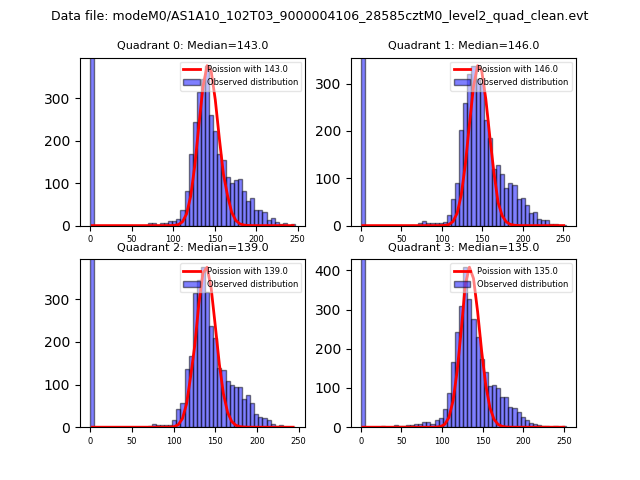 |
 |
| Quadrant-wise count rates Data is divided into 100 sec bins |
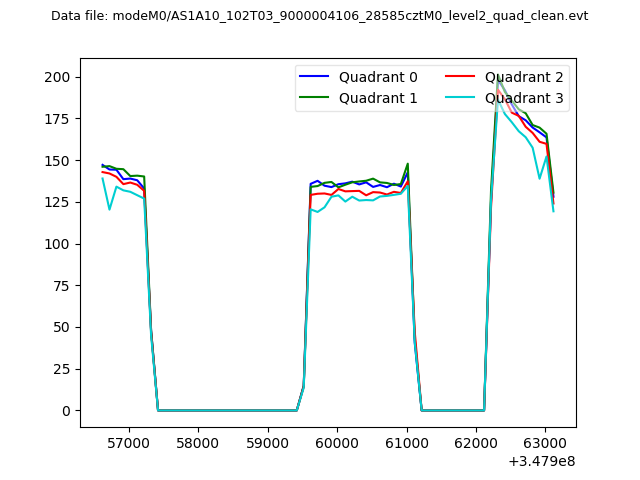 |
|
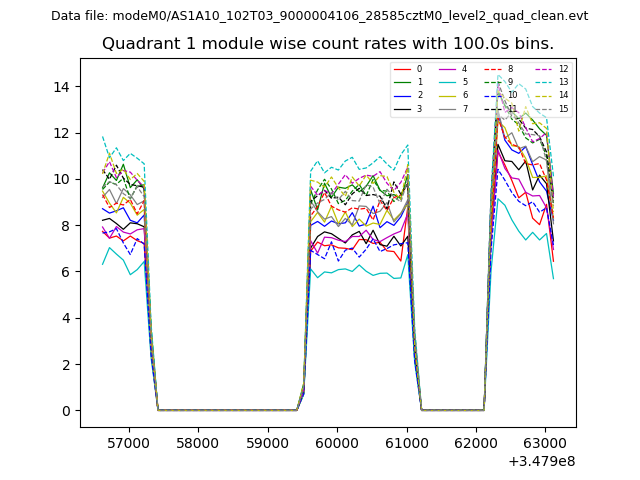
| Module-wise count rates for Quadrant A Data is divided into 100 sec bins |
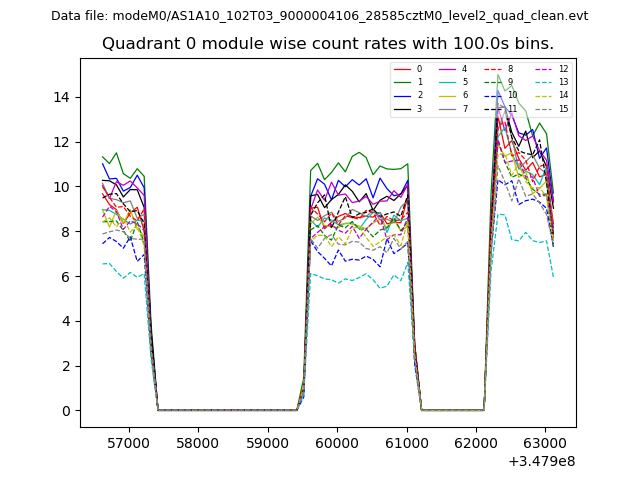 |
 |
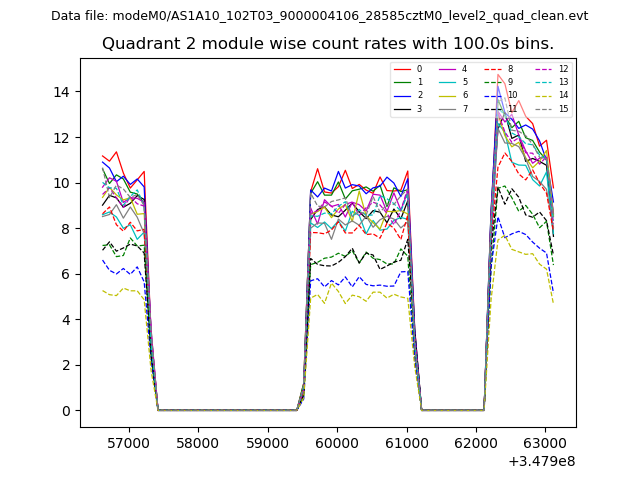
| Module-wise count rates for Quadrant B Data is divided into 100 sec bins |
 |
 |
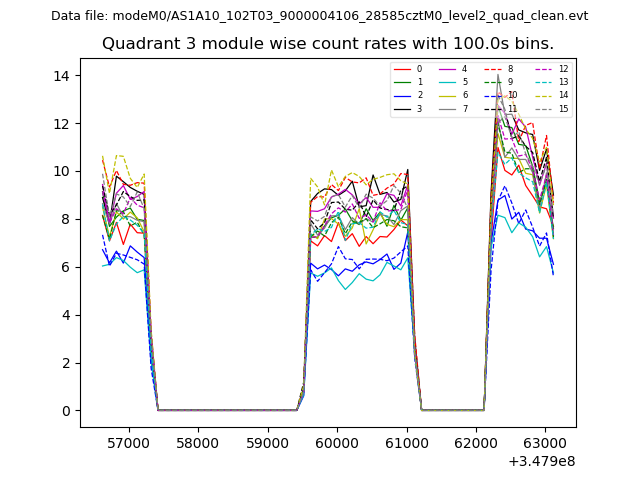
| Module-wise count rates for Quadrant C Data is divided into 100 sec bins |
 |
 |
| Module-wise count rates for Quadrant D Data is divided into 100 sec bins |
 |
 |
| Parameter | Plot |
|---|---|
| CZT HV Monitor | 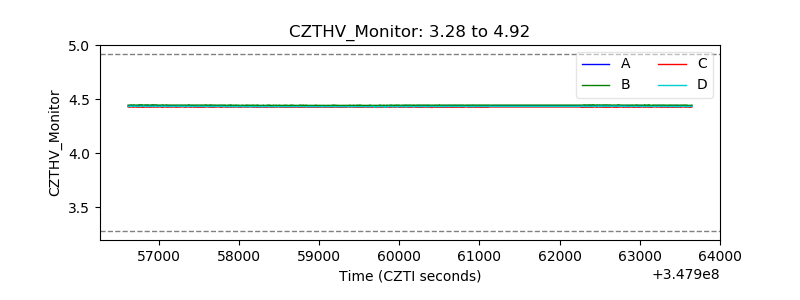 |
| D_VDD | 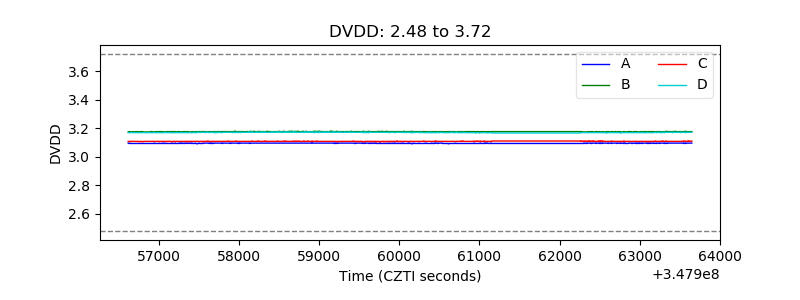 |
| Temperature 1 | 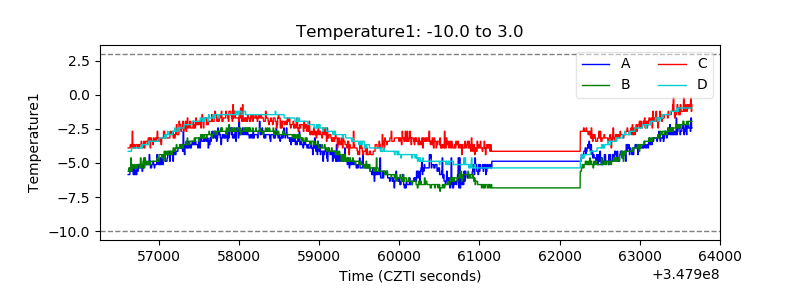 |
| Veto HV Monitor | 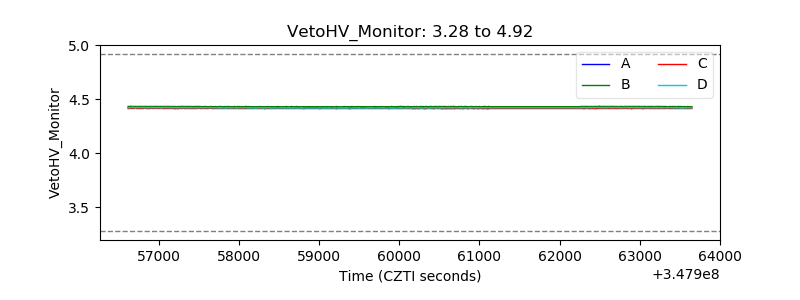 |
| Veto LLD | 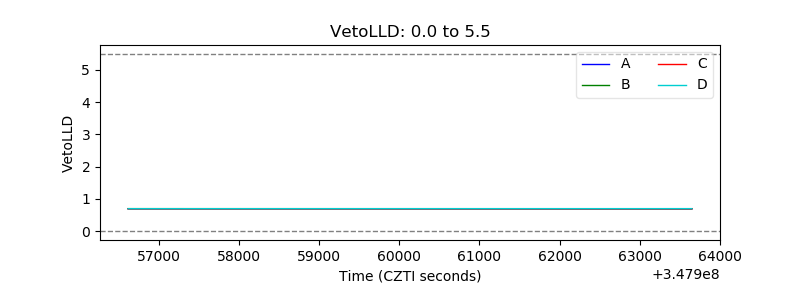 |
| Alpha Counter | 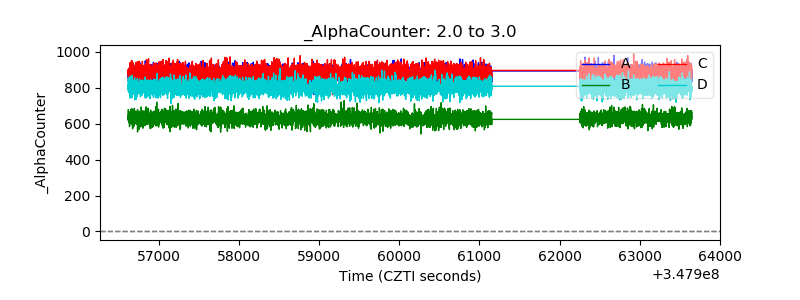 |
| _CPM_Rate | 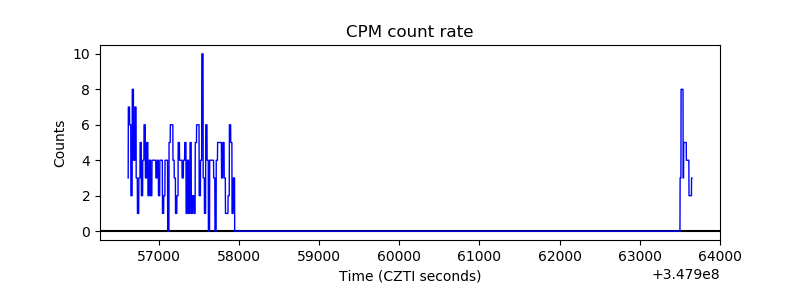 |
| CZT Counter | 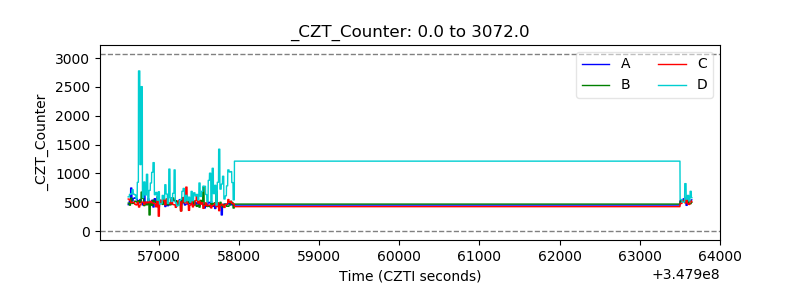 |
| +2.5 Volts monitor |  |
| +5 Volts monitor |  |
| _ROLL_ROT | 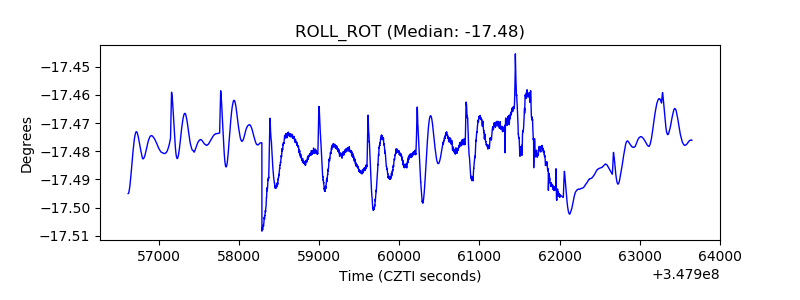 |
| _Roll_DEC | 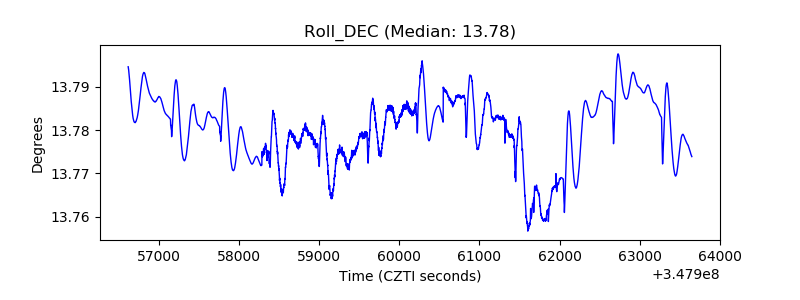 |
| _Roll_RA | 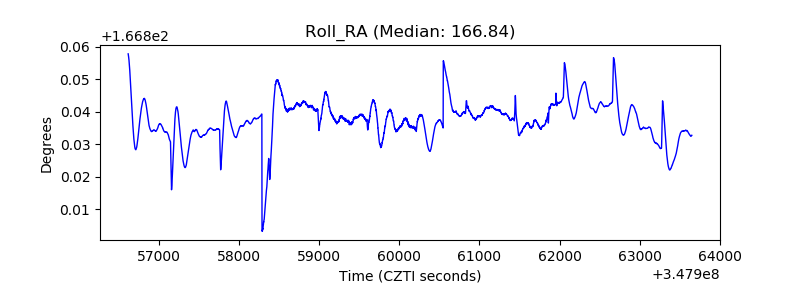 |
| Veto Counter | 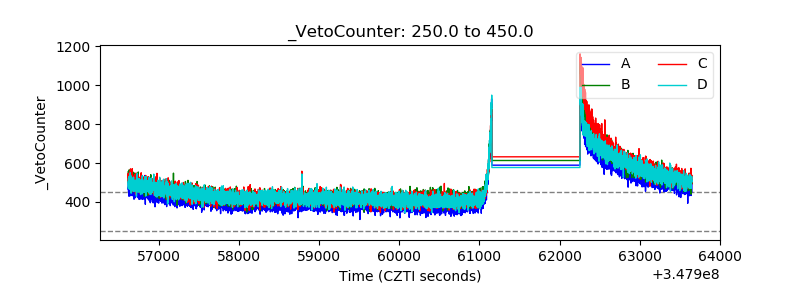 |