| Param | Original file | Final file |
|---|---|---|
| Filename | modeM0/AS1A10_102T03_9000004106_28587cztM0_level2.evt | modeM0/AS1A10_102T03_9000004106_28587cztM0_level2_quad_clean.evt |
| Size (bytes) | 627,402,240 | 64,123,200 |
| Size | 598.3 MB | 61.2 MB |
| Events in quadrant A | 3,853,099 | 388,134 |
| Events in quadrant B | 3,636,434 | 394,307 |
| Events in quadrant C | 3,596,840 | 382,154 |
| Events in quadrant D | 7,489,904 | 338,200 |
| Mode M9 | |||
|---|---|---|---|
| Quadrant | BADHDUFLAG | Total packets | Discarded packets |
| A | 0 | 12 | 0 |
| B | 0 | 12 | 0 |
| C | 0 | 12 | 0 |
| D | 0 | 12 | 0 |
| Mode M0 | |||
|---|---|---|---|
| Quadrant | BADHDUFLAG | Total packets | Discarded packets |
| A | 0 | 15534 | 1 |
| B | 0 | 14827 | 1 |
| C | 0 | 14621 | 2 |
| D | 0 | 26742 | 1 |
| Mode SS | |||
|---|---|---|---|
| Quadrant | BADHDUFLAG | Total packets | Discarded packets |
| A | 0 | 128 | 0 |
| B | 0 | 128 | 0 |
| C | 0 | 128 | 0 |
| D | 0 | 128 | 0 |
| Quadrant | Total seconds | Saturated seconds | Saturation percentage |
|---|---|---|---|
| A | 6277 | 186 | 2.963199% |
| B | 6278 | 96 | 1.529149% |
| C | 6277 | 128 | 2.039191% |
| D | 6277 | 1189 | 18.942170% |
Noise dominated data is calculated using 1-second bins in cleaned event files. If a bin has >2000 counts, and if more than 50% of those come from <1% of pixels, then it is considered to be noise-dominated and hence unusable.
| Quadrant | # 1 sec bins | Bins with >0 counts | Bins with >2000 counts | High rate bins dominated by noise | Noise dominated (total time) | Noise dominated (detector-on time) | Marked lightcurve |
|---|---|---|---|---|---|---|---|
| A | 7542 | 6277 | 69 | 69 | 0.91% | 1.10% | 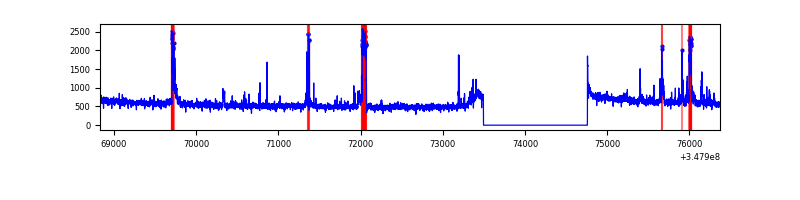 |
| B | 7543 | 6278 | 4 | 4 | 0.05% | 0.06% | 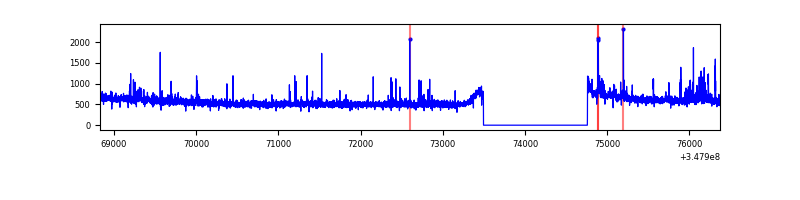 |
| C | 7542 | 6277 | 1 | 1 | 0.01% | 0.02% | 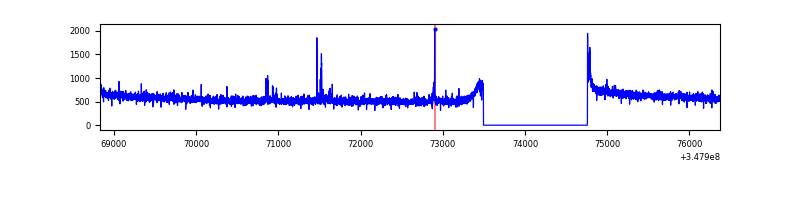 |
| D | 7542 | 6277 | 1055 | 1055 | 13.99% | 16.81% | 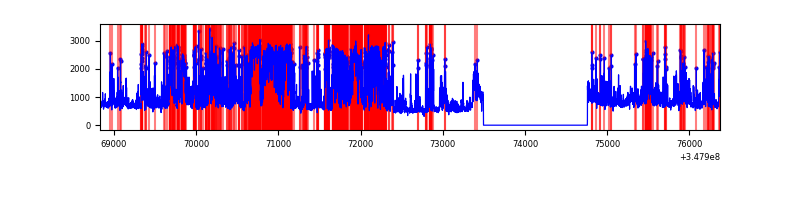 |
Top three noisy pixels from each quadrant. If the there are fewer than three noisy pixels in the level2.evt file, extra rows are filled as -1
| Pixel properties | Quadrant properties | ||||||
|---|---|---|---|---|---|---|---|
| Quadrant | DetID | PixID | Counts | Sigma | Mean | Median | Sigma |
| A | 15 | 174 | 266144 | 1482.85 | 899 | 883 | 178.9 |
| A | 12 | 16 | 99542 | 551.52 | 899 | 883 | 178.9 |
| A | 12 | 194 | 21622 | 115.93 | 899 | 883 | 178.9 |
| B | 15 | 33 | 44300 | 263.82 | 884 | 864 | 164.6 |
| B | 10 | 245 | 42506 | 252.93 | 884 | 864 | 164.6 |
| B | 0 | 230 | 27403 | 161.19 | 884 | 864 | 164.6 |
| C | 14 | 238 | 141660 | 705.91 | 868 | 875 | 199.4 |
| C | 7 | 247 | 45716 | 224.84 | 868 | 875 | 199.4 |
| C | 0 | 10 | 18143 | 86.58 | 868 | 875 | 199.4 |
| D | 7 | 80 | 2428086 | 12619.29 | 813 | 795 | 192.3 |
| D | 1 | 52 | 1391821 | 7231.83 | 813 | 795 | 192.3 |
| D | 8 | 195 | 458356 | 2378.82 | 813 | 795 | 192.3 |
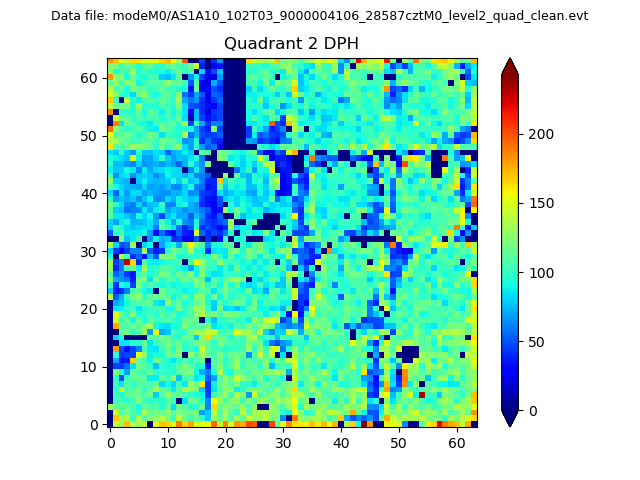
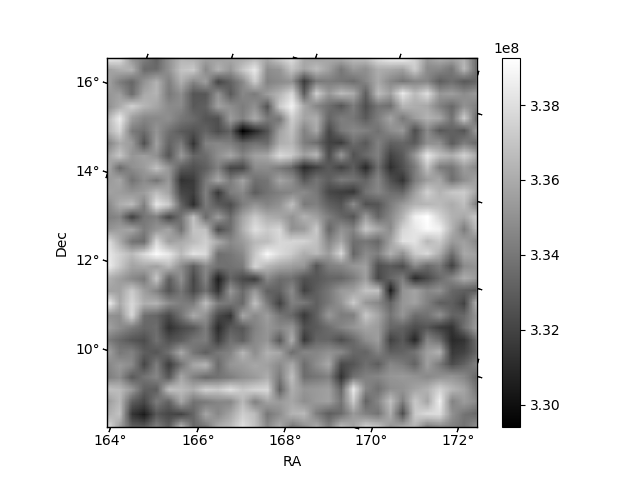
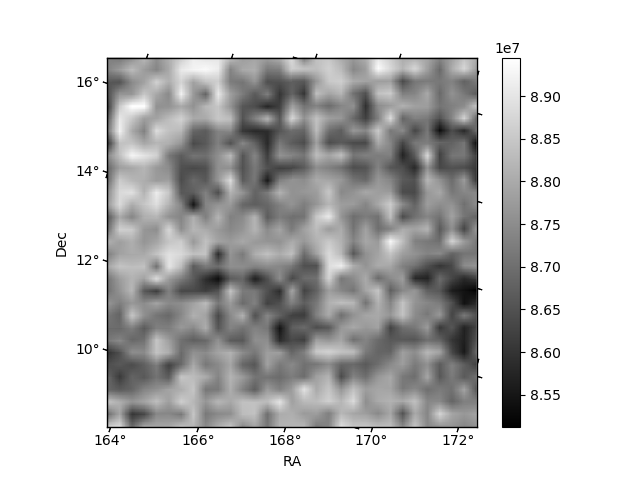
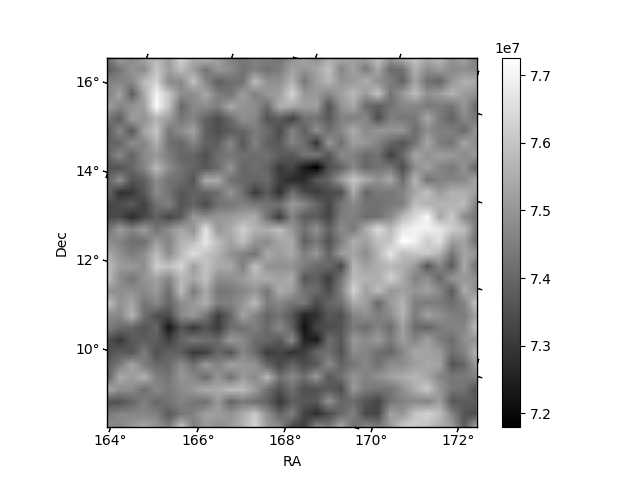
Histogram calculated using DETX and DETY for each event in the final _common_clean file
| Quadrant A | 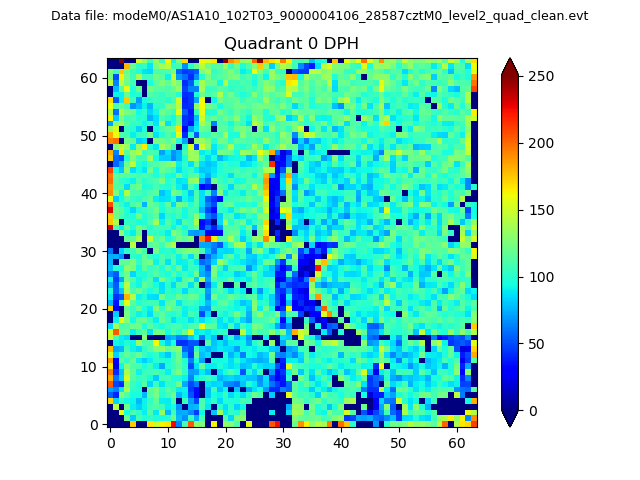 |
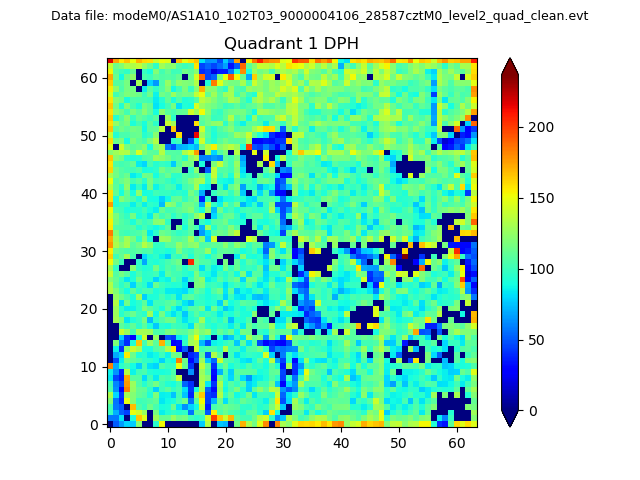 |
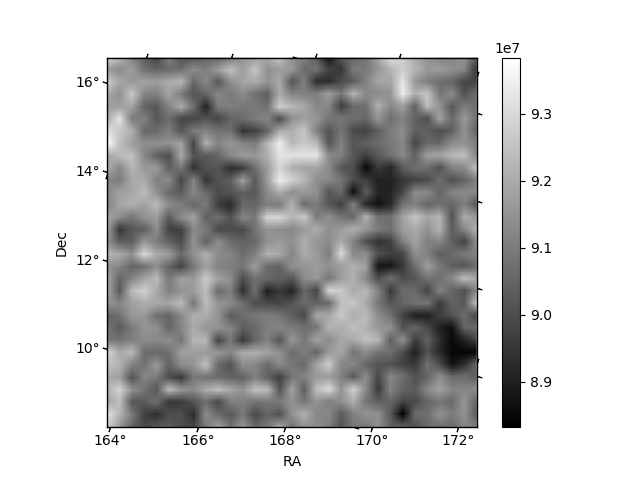
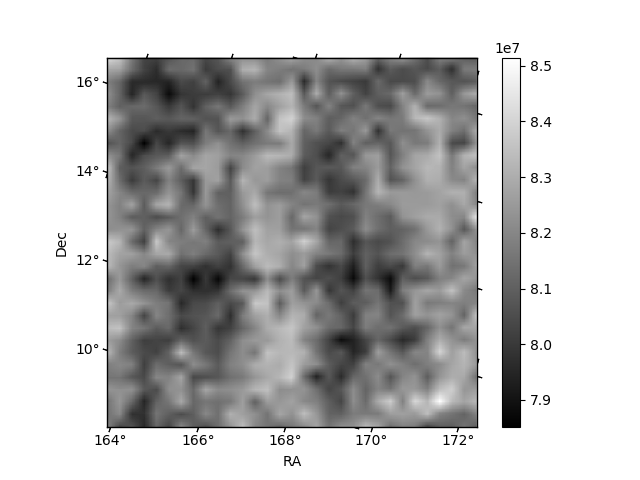
Quadrant B |
|---|---|---|---|
| Quadrant D | 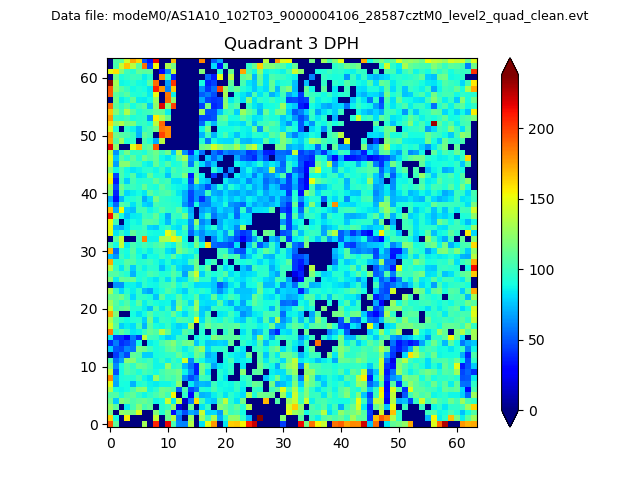 |
 |
Quadrant C |
| Plot type | Count rate plots | Images |
|---|---|---|
| Comparison with Poisson distribution Blue bars denote a histogram of data divided into 1 sec bins. Red curve is a Poisson curve with rate = median count rate of data. |
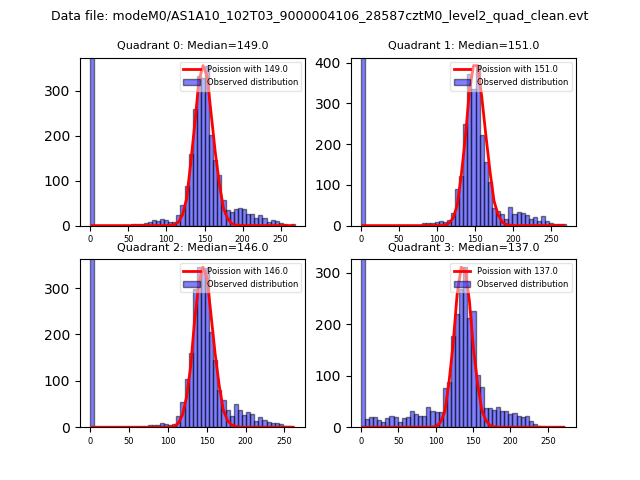 |
 |
| Quadrant-wise count rates Data is divided into 100 sec bins |
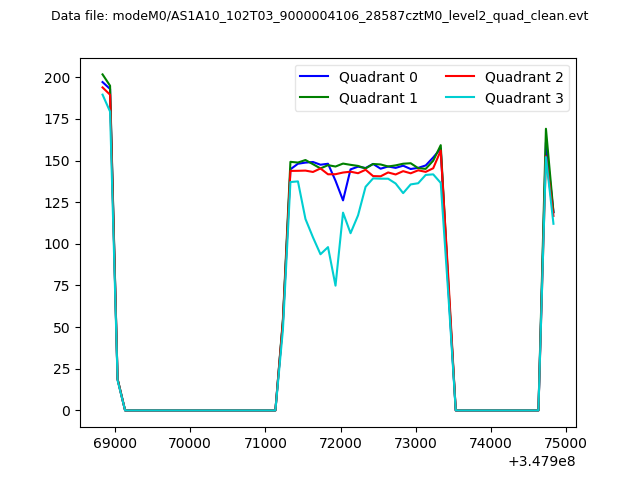 |
|
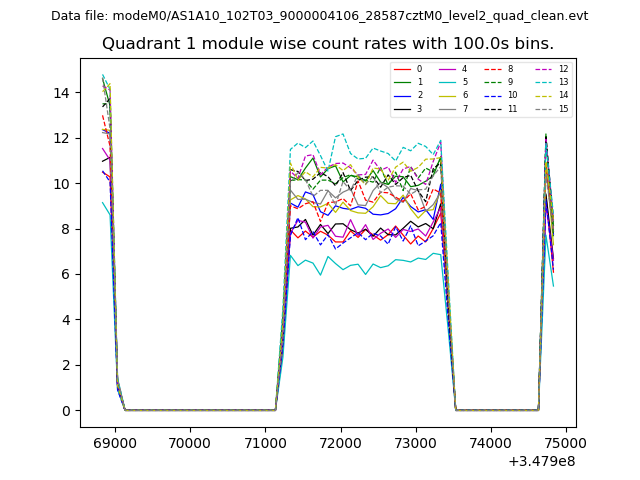
| Module-wise count rates for Quadrant A Data is divided into 100 sec bins |
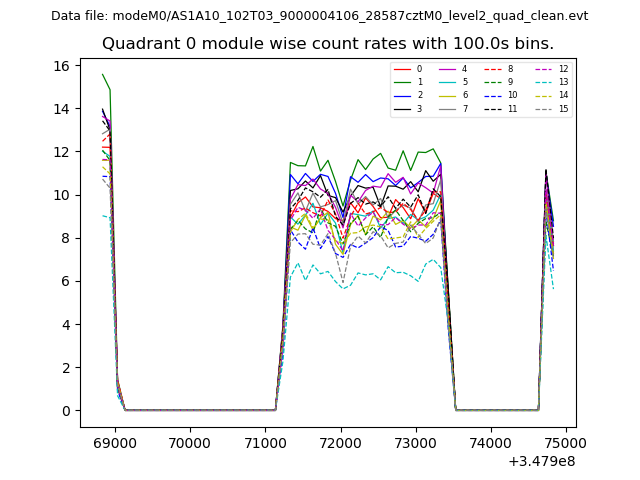 |
 |
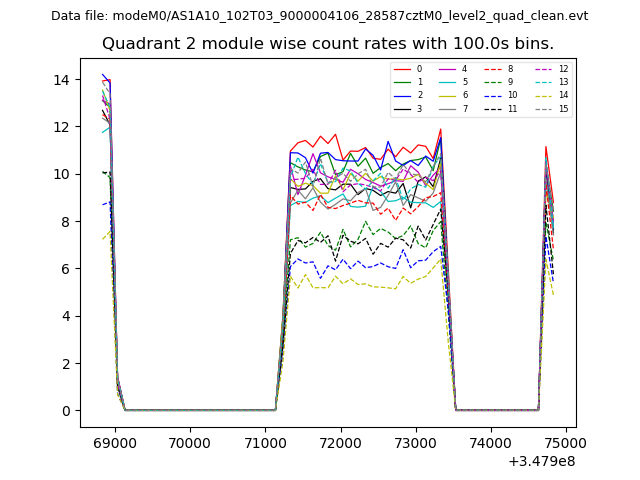
| Module-wise count rates for Quadrant B Data is divided into 100 sec bins |
 |
 |
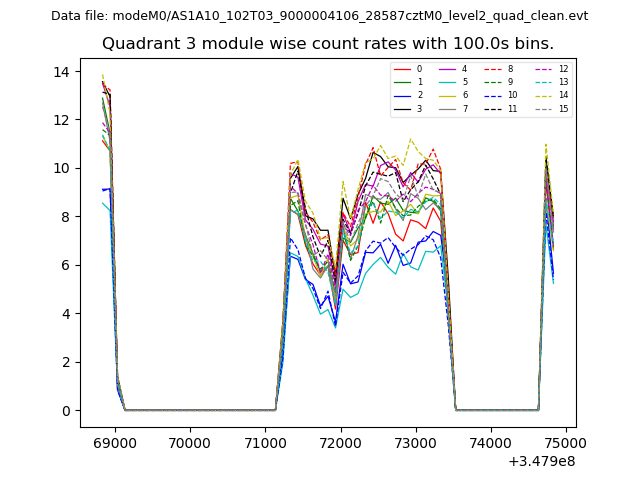
| Module-wise count rates for Quadrant C Data is divided into 100 sec bins |
 |
 |
| Module-wise count rates for Quadrant D Data is divided into 100 sec bins |
 |
 |
| Parameter | Plot |
|---|---|
| CZT HV Monitor | 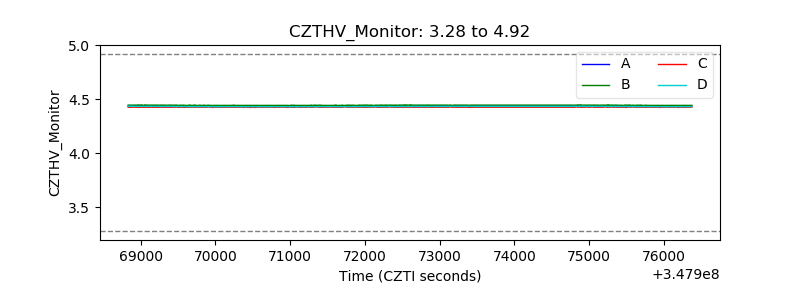 |
| D_VDD | 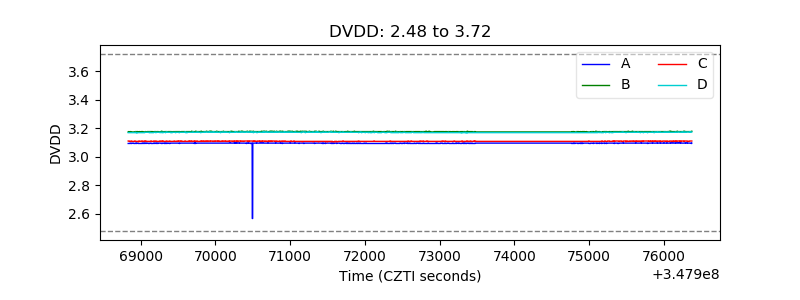 |
| Temperature 1 | 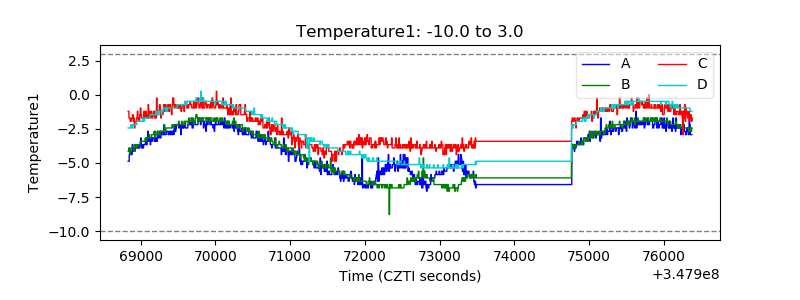 |
| Veto HV Monitor |  |
| Veto LLD |  |
| Alpha Counter | 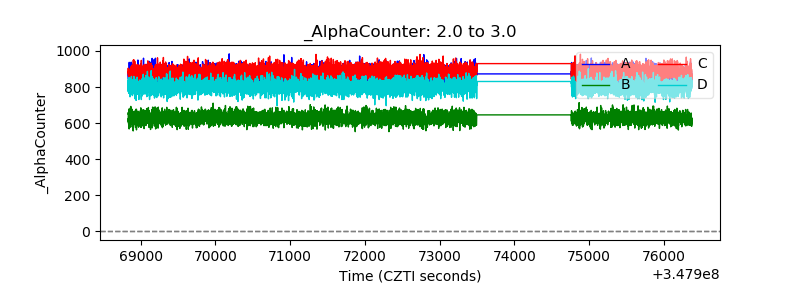 |
| _CPM_Rate | 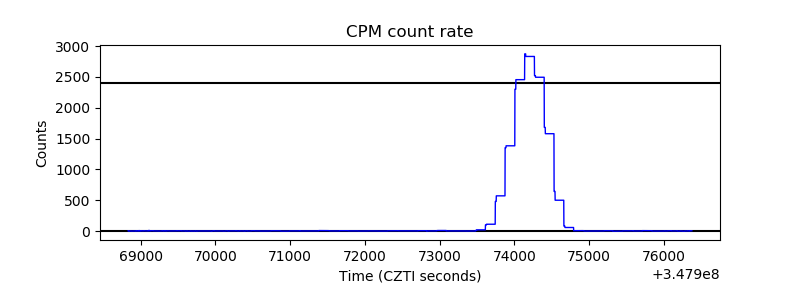 |
| CZT Counter | 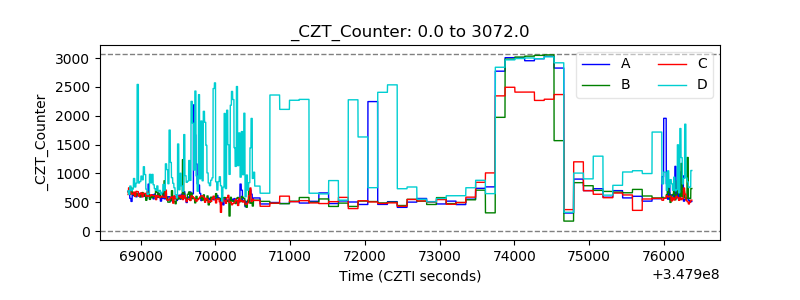 |
| +2.5 Volts monitor |  |
| +5 Volts monitor |  |
| _ROLL_ROT | 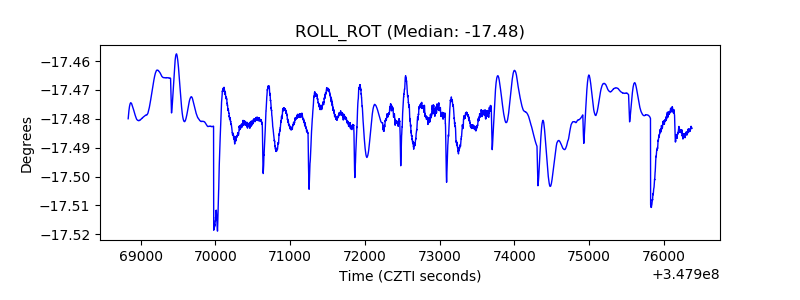 |
| _Roll_DEC | 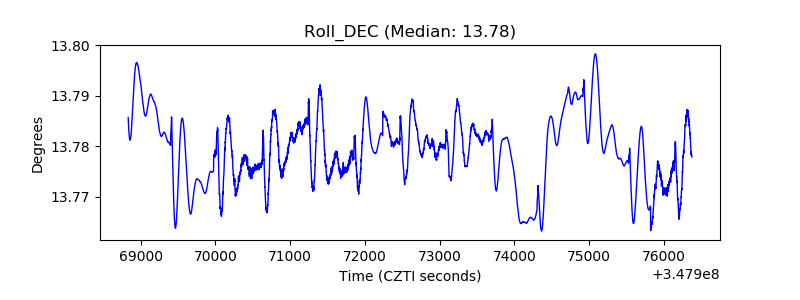 |
| _Roll_RA | 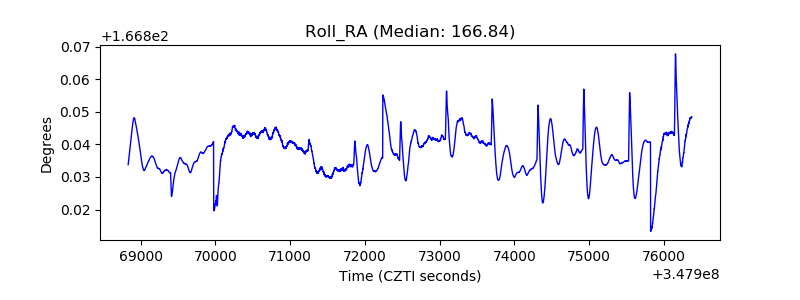 |
| Veto Counter | 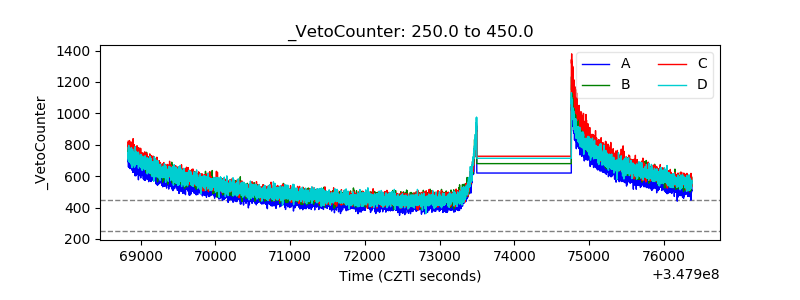 |