| Param | Original file | Final file |
|---|---|---|
| Filename | modeM0/AS1A10_102T03_9000004106_28588cztM0_level2.evt | modeM0/AS1A10_102T03_9000004106_28588cztM0_level2_quad_clean.evt |
| Size (bytes) | 569,966,400 | 65,822,400 |
| Size | 543.6 MB | 62.8 MB |
| Events in quadrant A | 3,909,771 | 392,346 |
| Events in quadrant B | 3,865,926 | 397,016 |
| Events in quadrant C | 3,750,890 | 385,120 |
| Events in quadrant D | 5,303,887 | 373,839 |
| Mode M9 | |||
|---|---|---|---|
| Quadrant | BADHDUFLAG | Total packets | Discarded packets |
| A | 0 | 13 | 0 |
| B | 0 | 13 | 0 |
| C | 0 | 13 | 0 |
| D | 0 | 13 | 0 |
| Mode M0 | |||
|---|---|---|---|
| Quadrant | BADHDUFLAG | Total packets | Discarded packets |
| A | 0 | 15935 | 1 |
| B | 0 | 15653 | 1 |
| C | 0 | 15367 | 1 |
| D | 0 | 20203 | 1 |
| Mode SS | |||
|---|---|---|---|
| Quadrant | BADHDUFLAG | Total packets | Discarded packets |
| A | 0 | 130 | 0 |
| B | 0 | 130 | 0 |
| C | 0 | 130 | 0 |
| D | 0 | 130 | 0 |
| Quadrant | Total seconds | Saturated seconds | Saturation percentage |
|---|---|---|---|
| A | 6368 | 107 | 1.680276% |
| B | 6369 | 97 | 1.523002% |
| C | 6369 | 129 | 2.025436% |
| D | 6369 | 252 | 3.956665% |
Noise dominated data is calculated using 1-second bins in cleaned event files. If a bin has >2000 counts, and if more than 50% of those come from <1% of pixels, then it is considered to be noise-dominated and hence unusable.
| Quadrant | # 1 sec bins | Bins with >0 counts | Bins with >2000 counts | High rate bins dominated by noise | Noise dominated (total time) | Noise dominated (detector-on time) | Marked lightcurve |
|---|---|---|---|---|---|---|---|
| A | 7678 | 6368 | 21 | 21 | 0.27% | 0.33% | 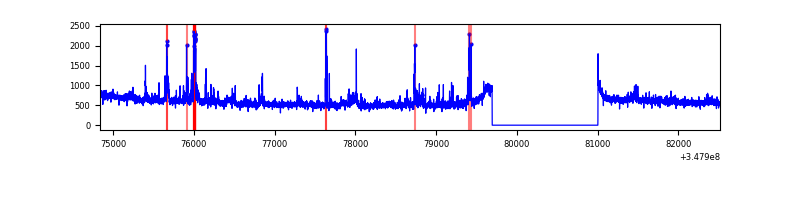 |
| B | 7679 | 6369 | 8 | 8 | 0.10% | 0.13% |  |
| C | 7679 | 6369 | 3 | 3 | 0.04% | 0.05% | 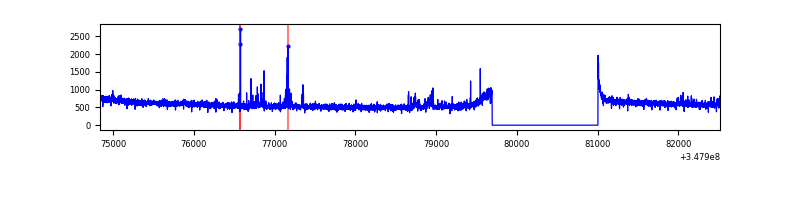 |
| D | 7679 | 6369 | 191 | 191 | 2.49% | 3.00% | 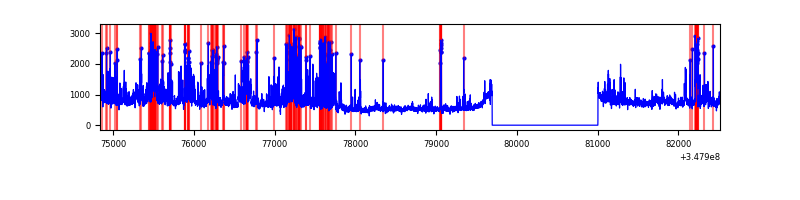 |
Top three noisy pixels from each quadrant. If the there are fewer than three noisy pixels in the level2.evt file, extra rows are filled as -1
| Pixel properties | Quadrant properties | ||||||
|---|---|---|---|---|---|---|---|
| Quadrant | DetID | PixID | Counts | Sigma | Mean | Median | Sigma |
| A | 12 | 16 | 192759 | 1048.69 | 923 | 909 | 182.9 |
| A | 15 | 174 | 105473 | 571.57 | 923 | 909 | 182.9 |
| A | 12 | 194 | 38754 | 206.87 | 923 | 909 | 182.9 |
| B | 10 | 245 | 151071 | 890.31 | 906 | 884 | 168.7 |
| B | 4 | 171 | 47001 | 273.38 | 906 | 884 | 168.7 |
| B | 15 | 33 | 43622 | 253.35 | 906 | 884 | 168.7 |
| C | 14 | 238 | 146076 | 710.56 | 892 | 902 | 204.3 |
| C | 7 | 247 | 64709 | 312.3 | 892 | 902 | 204.3 |
| C | 0 | 207 | 27323 | 129.32 | 892 | 902 | 204.3 |
| D | 1 | 52 | 1087934 | 5184.65 | 896 | 878 | 209.7 |
| D | 8 | 195 | 645896 | 3076.38 | 896 | 878 | 209.7 |
| D | 2 | 250 | 82692 | 390.21 | 896 | 878 | 209.7 |
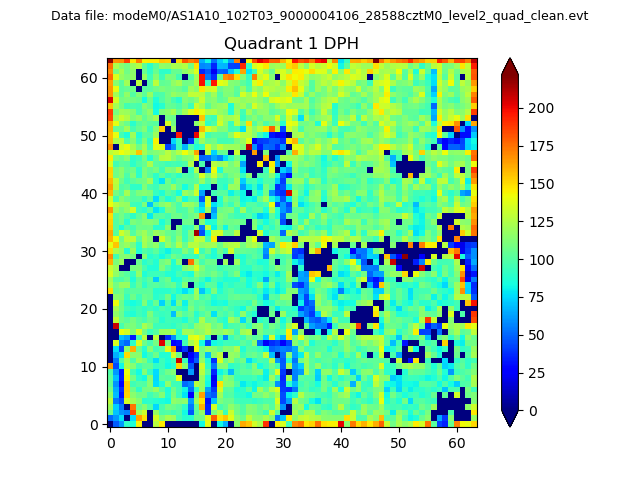
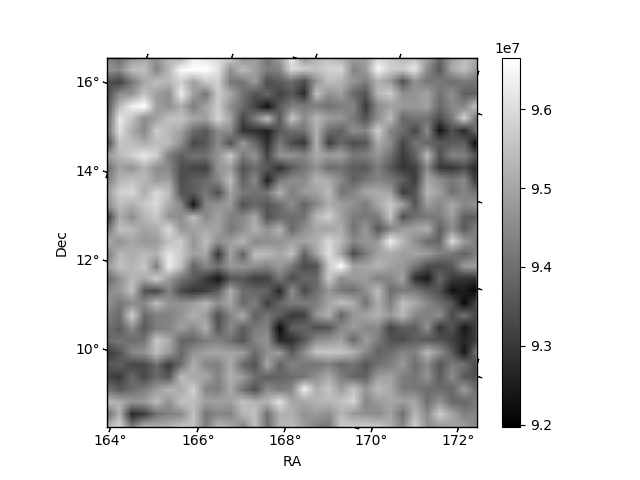
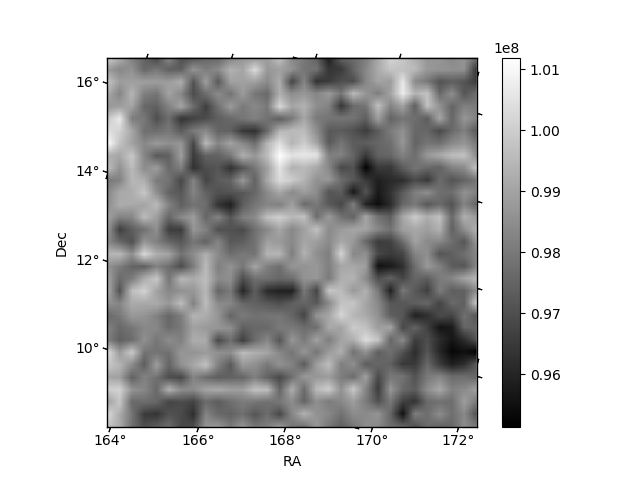
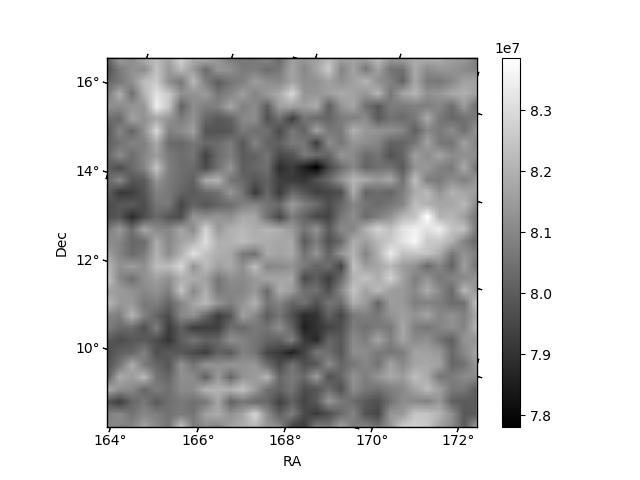
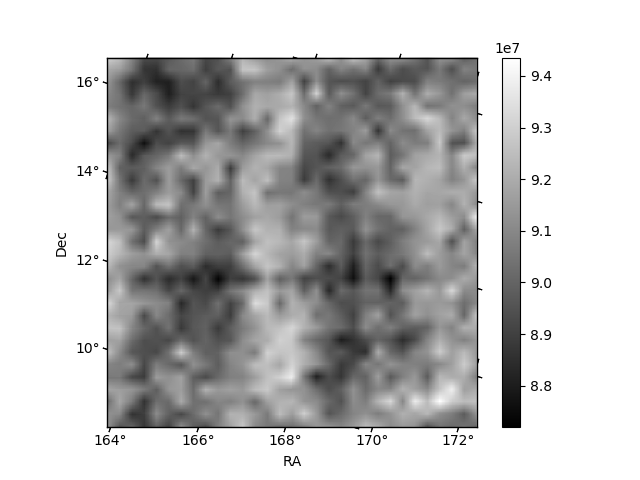
Histogram calculated using DETX and DETY for each event in the final _common_clean file
| Quadrant A | 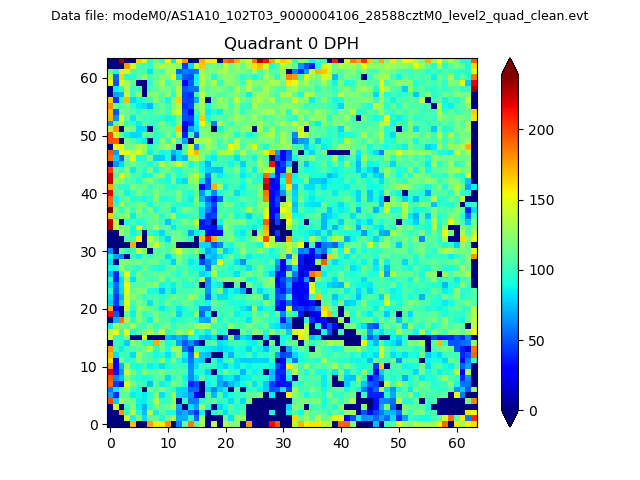 |
 |
Quadrant B |
|---|---|---|---|
| Quadrant D | 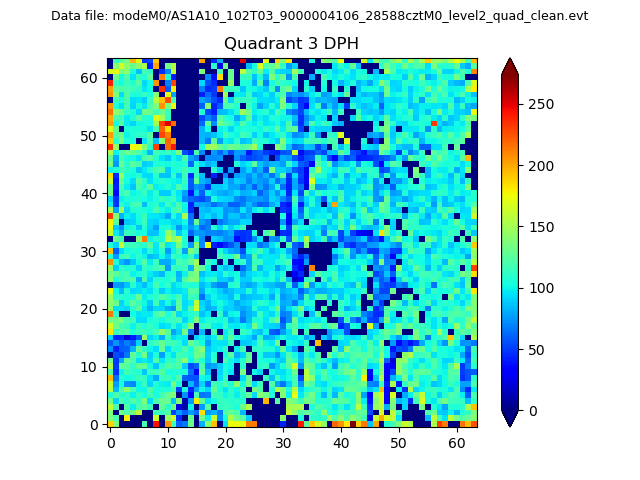 |
 |
Quadrant C |
| Plot type | Count rate plots | Images |
|---|---|---|
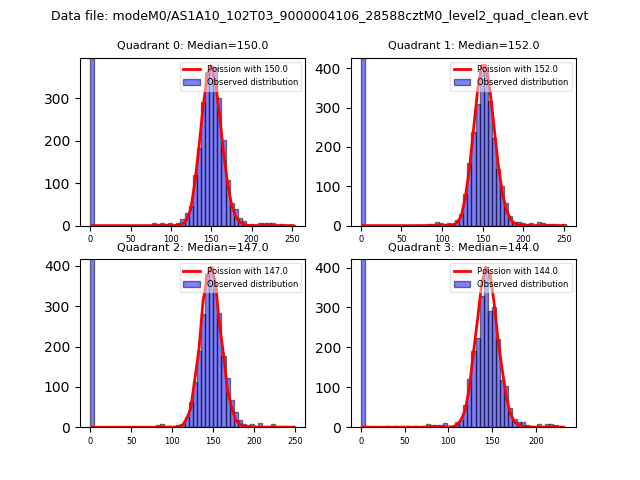
| Comparison with Poisson distribution Blue bars denote a histogram of data divided into 1 sec bins. Red curve is a Poisson curve with rate = median count rate of data. |
 |
 |
| Quadrant-wise count rates Data is divided into 100 sec bins |
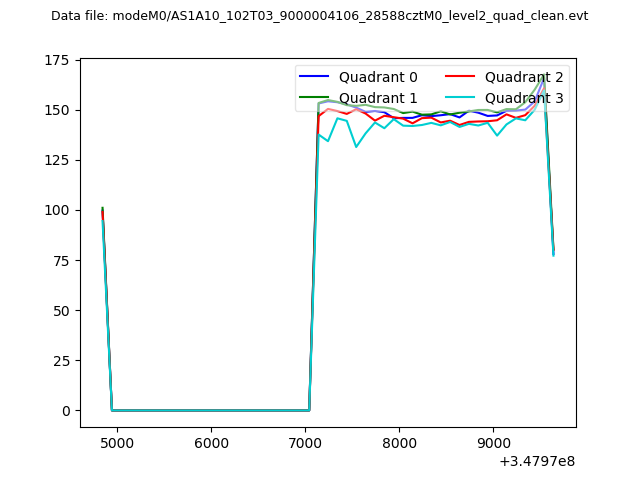 |
|
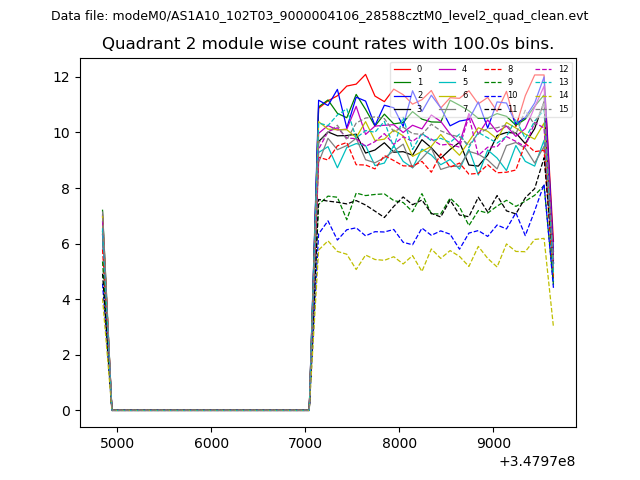
| Module-wise count rates for Quadrant A Data is divided into 100 sec bins |
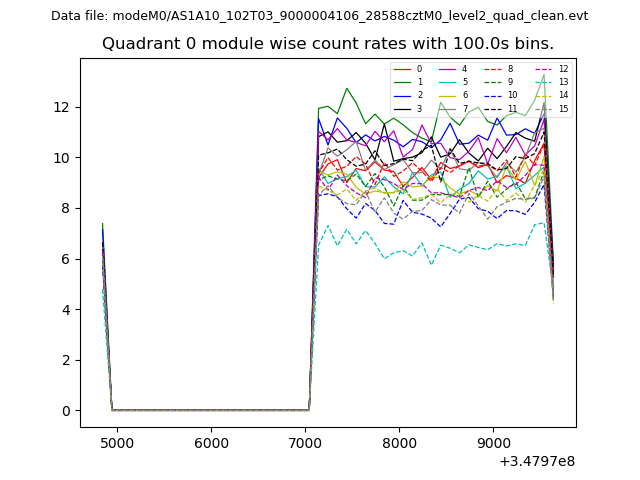 |
 |
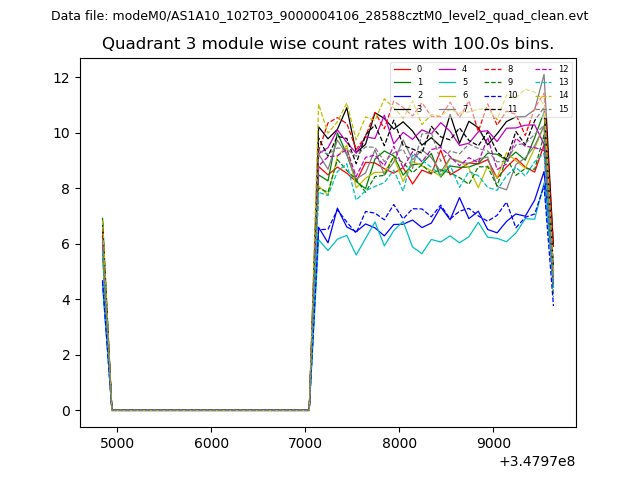
| Module-wise count rates for Quadrant B Data is divided into 100 sec bins |
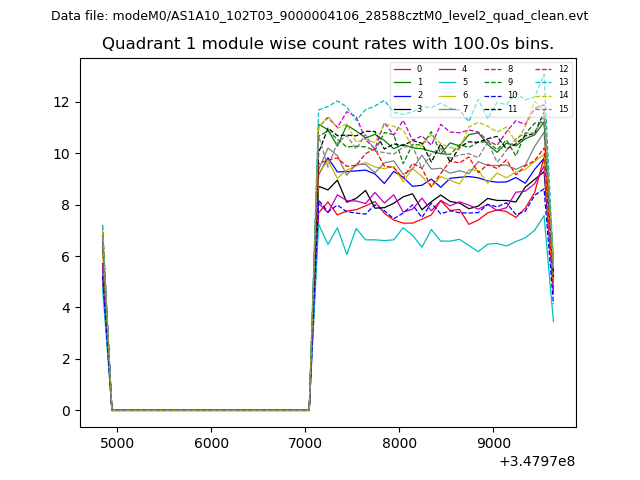 |
 |
| Module-wise count rates for Quadrant C Data is divided into 100 sec bins |
 |
 |
| Module-wise count rates for Quadrant D Data is divided into 100 sec bins |
 |
 |
| Parameter | Plot |
|---|---|
| CZT HV Monitor | 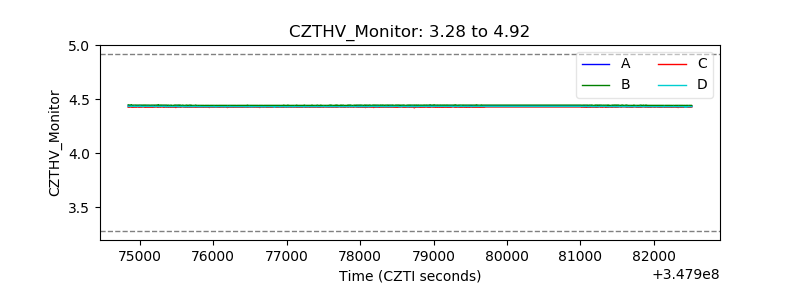 |
| D_VDD | 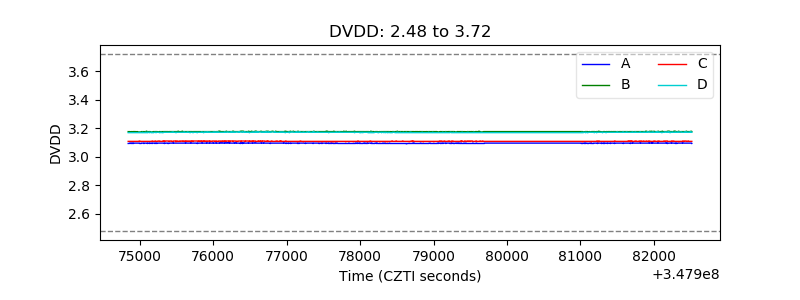 |
| Temperature 1 |  |
| Veto HV Monitor | 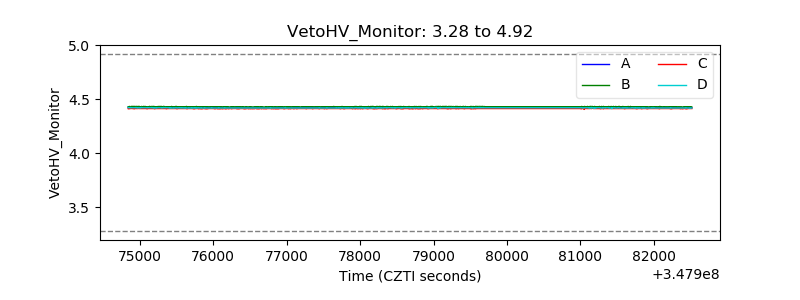 |
| Veto LLD |  |
| Alpha Counter | 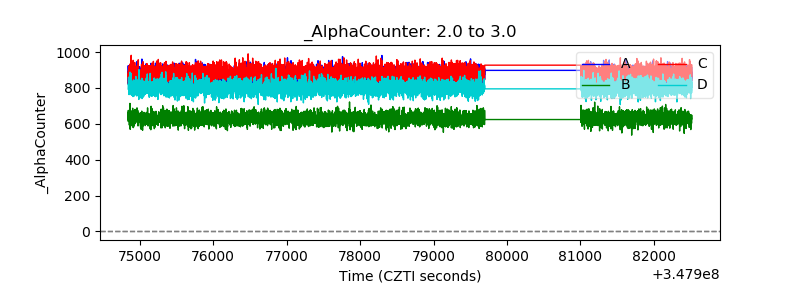 |
| _CPM_Rate | 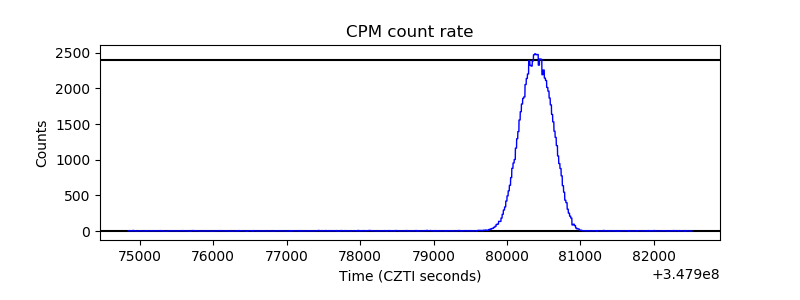 |
| CZT Counter | 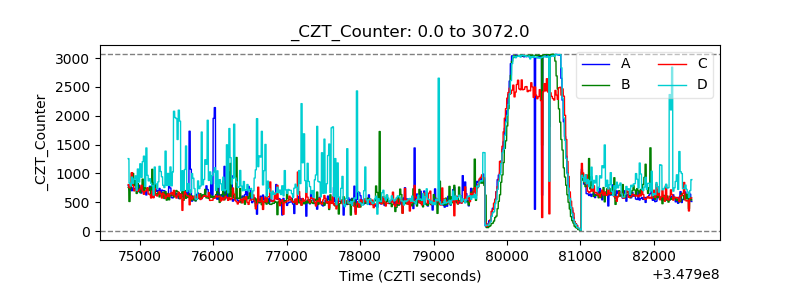 |
| +2.5 Volts monitor |  |
| +5 Volts monitor | 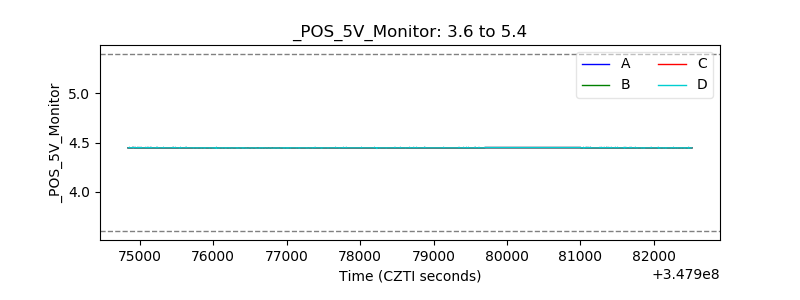 |
| _ROLL_ROT | 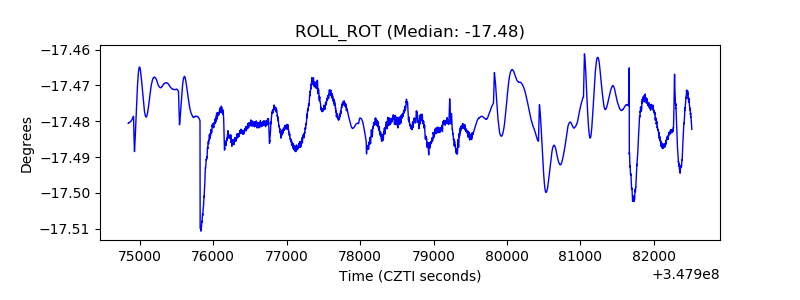 |
| _Roll_DEC | 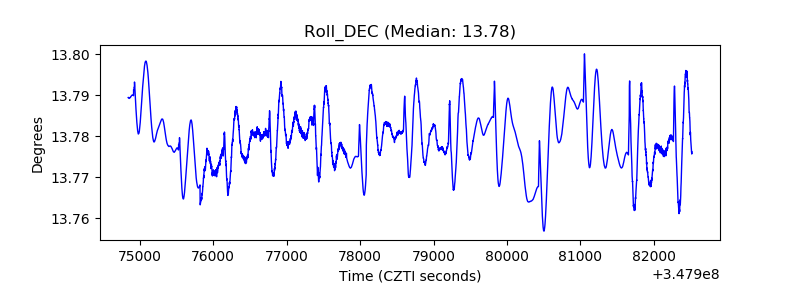 |
| _Roll_RA | 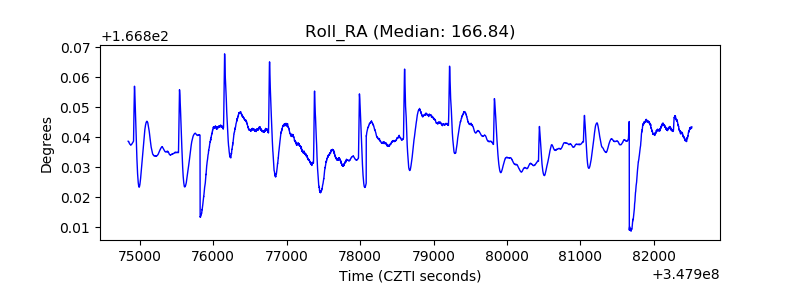 |
| Veto Counter | 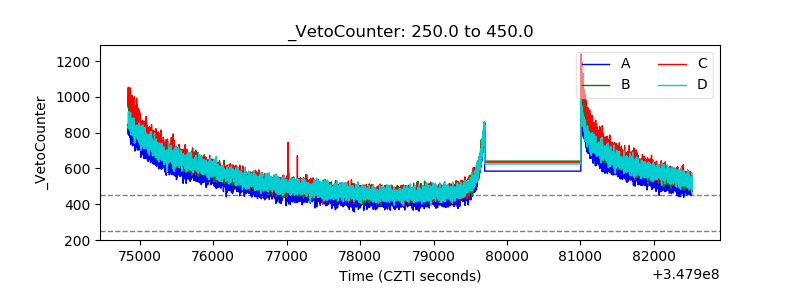 |