| Param | Original file | Final file |
|---|---|---|
| Filename | modeM0/AS1A10_102T03_9000004106_28590cztM0_level2.evt | modeM0/AS1A10_102T03_9000004106_28590cztM0_level2_quad_clean.evt |
| Size (bytes) | 533,520,000 | 84,991,680 |
| Size | 508.8 MB | 81.1 MB |
| Events in quadrant A | 3,593,666 | 534,788 |
| Events in quadrant B | 3,565,984 | 541,760 |
| Events in quadrant C | 3,529,492 | 525,104 |
| Events in quadrant D | 5,020,907 | 511,752 |
| Mode M9 | |||
|---|---|---|---|
| Quadrant | BADHDUFLAG | Total packets | Discarded packets |
| A | 0 | 20 | 0 |
| B | 0 | 21 | 0 |
| C | 0 | 21 | 0 |
| D | 0 | 21 | 0 |
| Mode M0 | |||
|---|---|---|---|
| Quadrant | BADHDUFLAG | Total packets | Discarded packets |
| A | 0 | 14760 | 2 |
| B | 0 | 14675 | 2 |
| C | 0 | 14536 | 2 |
| D | 0 | 19585 | 2 |
| Mode SS | |||
|---|---|---|---|
| Quadrant | BADHDUFLAG | Total packets | Discarded packets |
| A | 0 | 134 | 0 |
| B | 0 | 134 | 0 |
| C | 0 | 134 | 0 |
| D | 0 | 134 | 0 |
| Quadrant | Total seconds | Saturated seconds | Saturation percentage |
|---|---|---|---|
| A | 6603 | 82 | 1.241860% |
| B | 6603 | 114 | 1.726488% |
| C | 6603 | 131 | 1.983947% |
| D | 6603 | 163 | 2.468575% |
Noise dominated data is calculated using 1-second bins in cleaned event files. If a bin has >2000 counts, and if more than 50% of those come from <1% of pixels, then it is considered to be noise-dominated and hence unusable.
| Quadrant | # 1 sec bins | Bins with >0 counts | Bins with >2000 counts | High rate bins dominated by noise | Noise dominated (total time) | Noise dominated (detector-on time) | Marked lightcurve |
|---|---|---|---|---|---|---|---|
| A | 7648 | 6603 | 14 | 14 | 0.18% | 0.21% | 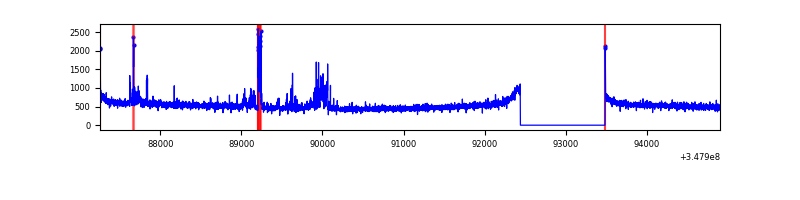 |
| B | 7648 | 6603 | 9 | 9 | 0.12% | 0.14% | 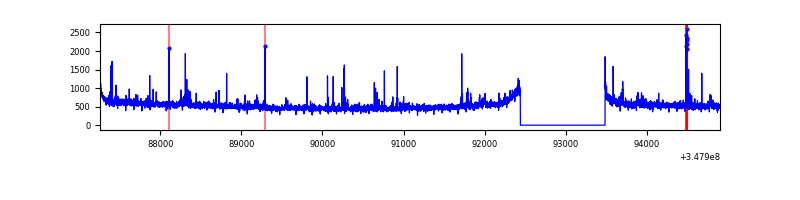 |
| C | 7648 | 6603 | 4 | 4 | 0.05% | 0.06% | 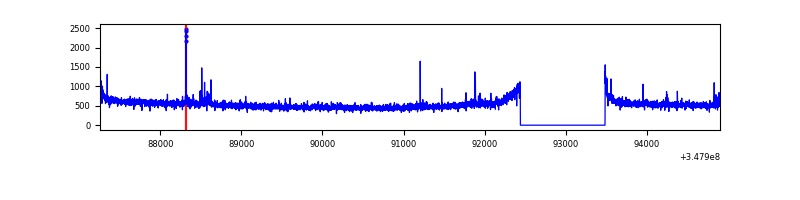 |
| D | 7648 | 6603 | 94 | 94 | 1.23% | 1.42% | 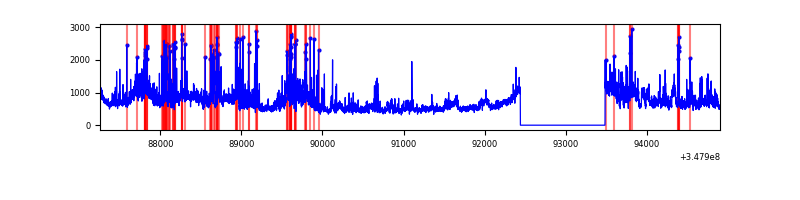 |
Top three noisy pixels from each quadrant. If the there are fewer than three noisy pixels in the level2.evt file, extra rows are filled as -1
| Pixel properties | Quadrant properties | ||||||
|---|---|---|---|---|---|---|---|
| Quadrant | DetID | PixID | Counts | Sigma | Mean | Median | Sigma |
| A | 15 | 174 | 202571 | 1154.15 | 875 | 859 | 174.8 |
| A | 8 | 192 | 12145 | 64.58 | 875 | 859 | 174.8 |
| A | 13 | 254 | 11632 | 61.64 | 875 | 859 | 174.8 |
| B | 4 | 171 | 93303 | 555.92 | 867 | 847 | 166.3 |
| B | 0 | 230 | 34405 | 201.78 | 867 | 847 | 166.3 |
| B | 12 | 111 | 19565 | 112.55 | 867 | 847 | 166.3 |
| C | 14 | 238 | 137570 | 695.54 | 846 | 854 | 196.6 |
| C | 7 | 247 | 41785 | 208.23 | 846 | 854 | 196.6 |
| C | 0 | 207 | 31555 | 156.19 | 846 | 854 | 196.6 |
| D | 8 | 195 | 1035683 | 5116.2 | 852 | 833 | 202.3 |
| D | 1 | 52 | 602648 | 2975.32 | 852 | 833 | 202.3 |
| D | 2 | 250 | 84381 | 413.05 | 852 | 833 | 202.3 |
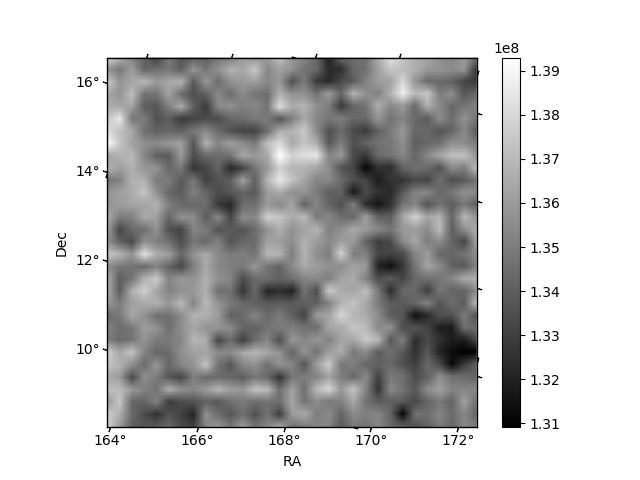
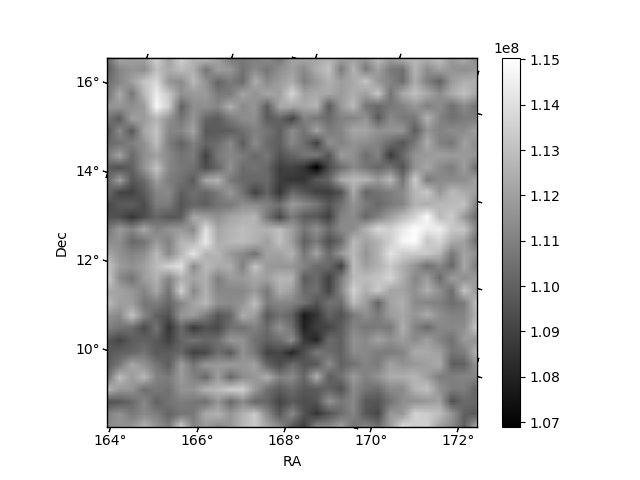
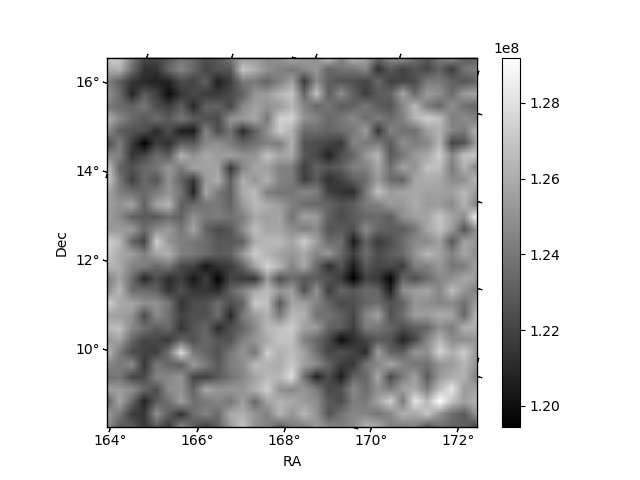
Histogram calculated using DETX and DETY for each event in the final _common_clean file
| Quadrant A | 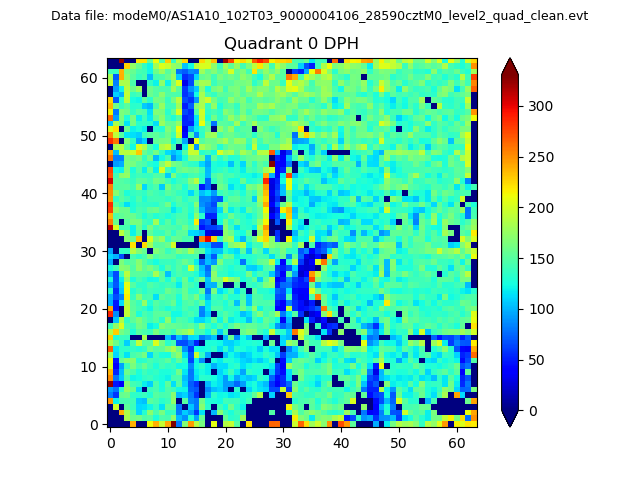 |
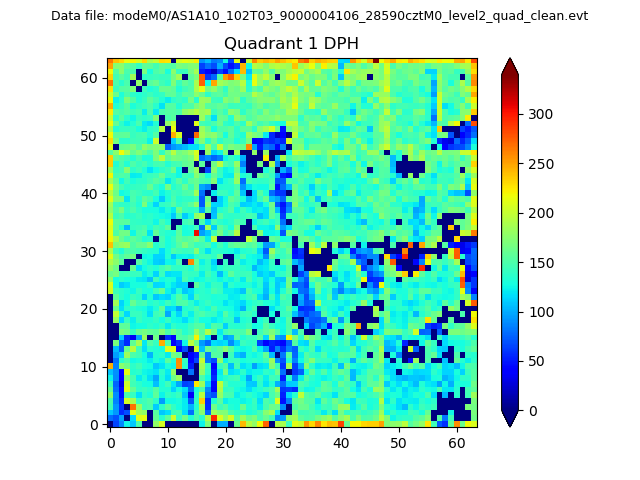 |
Quadrant B |
|---|---|---|---|
| Quadrant D | 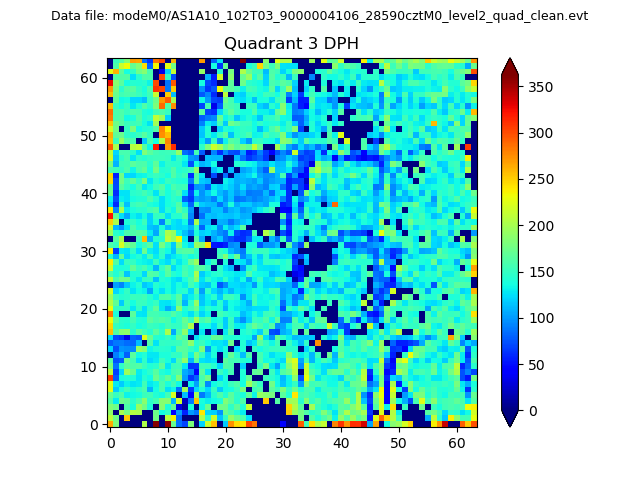 |
 |
Quadrant C |
| Plot type | Count rate plots | Images |
|---|---|---|
| Comparison with Poisson distribution Blue bars denote a histogram of data divided into 1 sec bins. Red curve is a Poisson curve with rate = median count rate of data. |
 |
 |
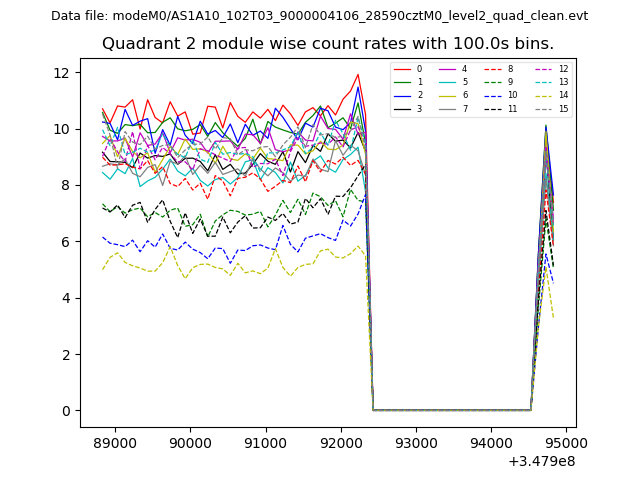
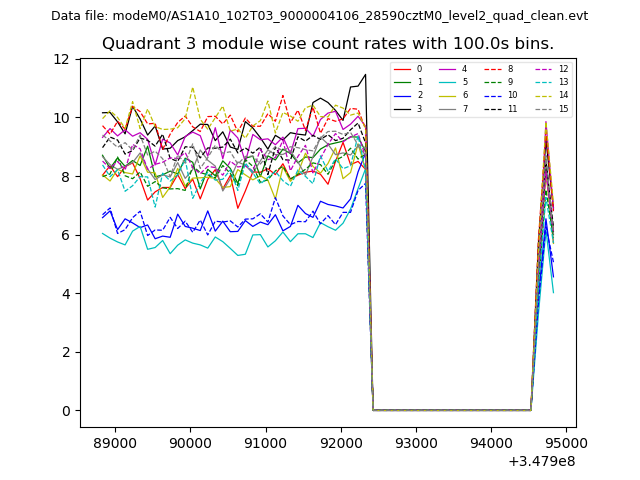
| Quadrant-wise count rates Data is divided into 100 sec bins |
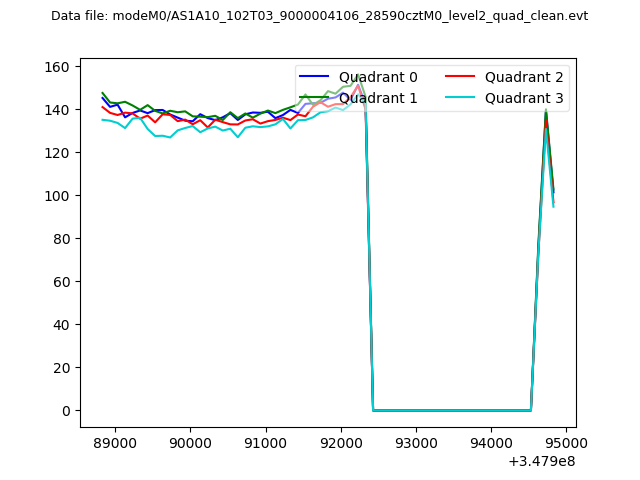 |
|
| Module-wise count rates for Quadrant A Data is divided into 100 sec bins |
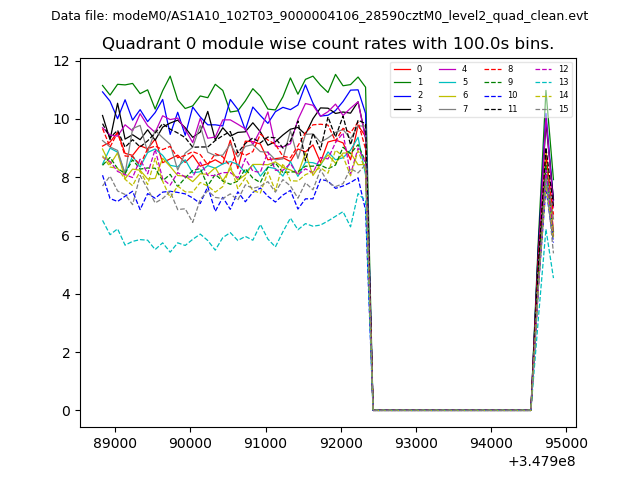 |
 |
| Module-wise count rates for Quadrant B Data is divided into 100 sec bins |
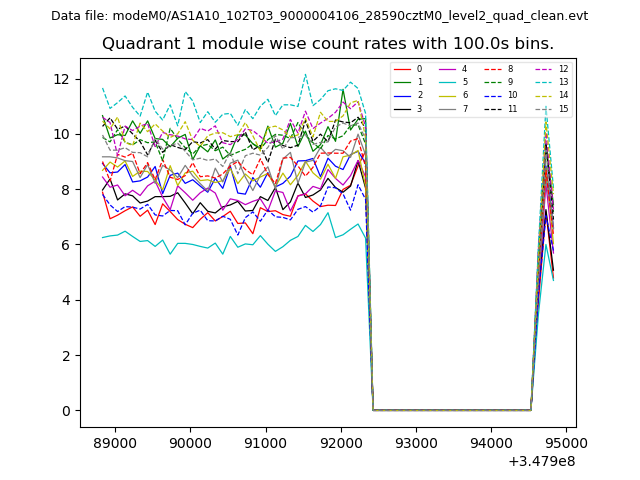 |
 |
| Module-wise count rates for Quadrant C Data is divided into 100 sec bins |
 |
 |
| Module-wise count rates for Quadrant D Data is divided into 100 sec bins |
 |
 |
| Parameter | Plot |
|---|---|
| CZT HV Monitor | 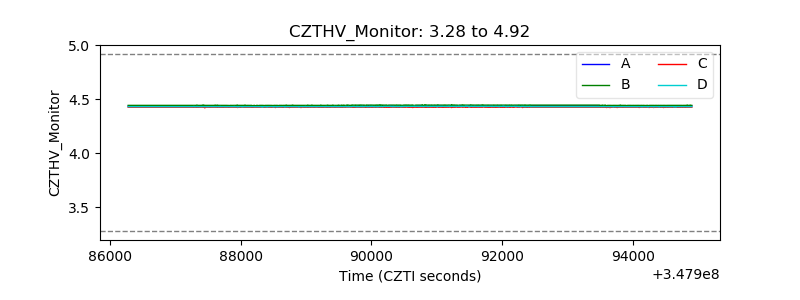 |
| D_VDD | 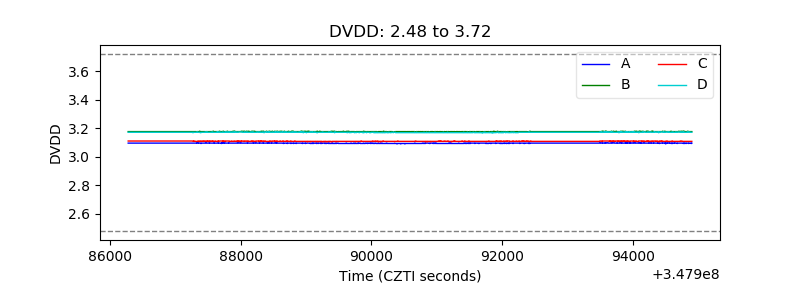 |
| Temperature 1 | 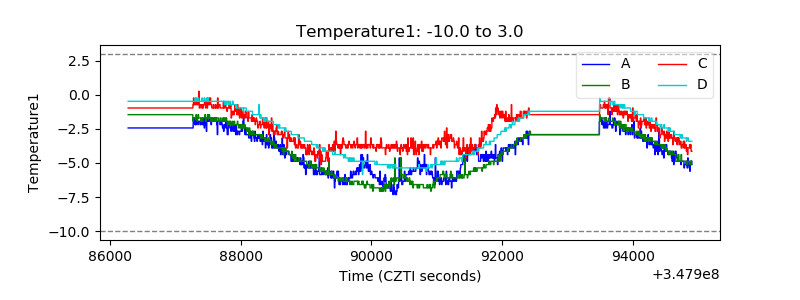 |
| Veto HV Monitor | 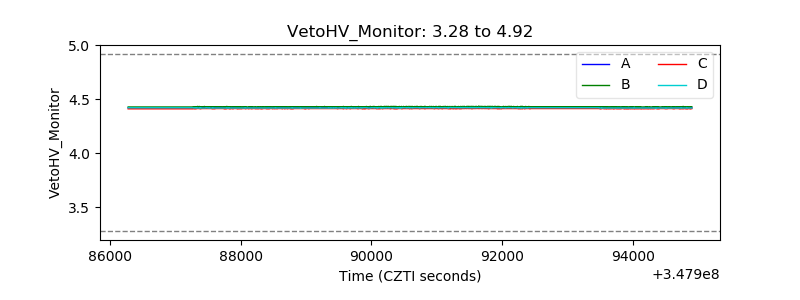 |
| Veto LLD | 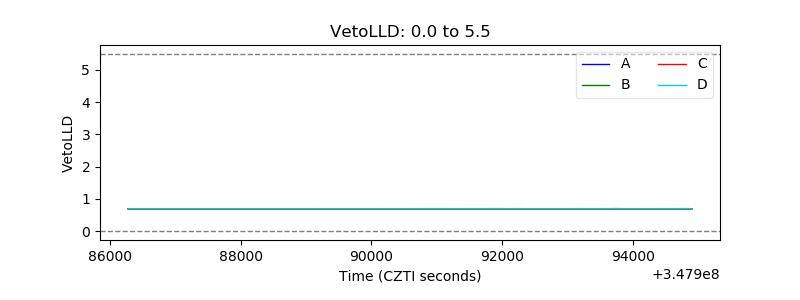 |
| Alpha Counter | 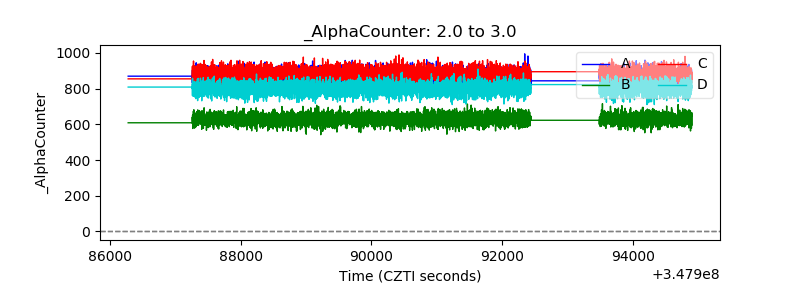 |
| _CPM_Rate | 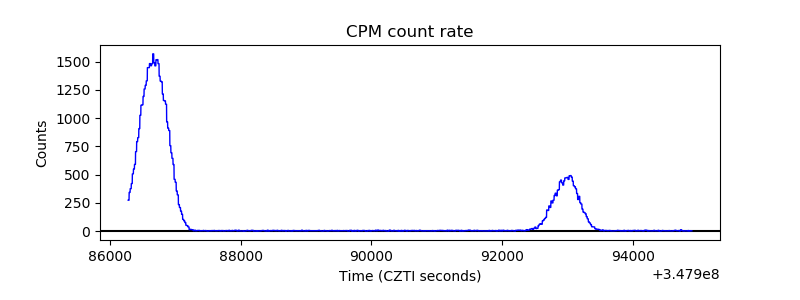 |
| CZT Counter | 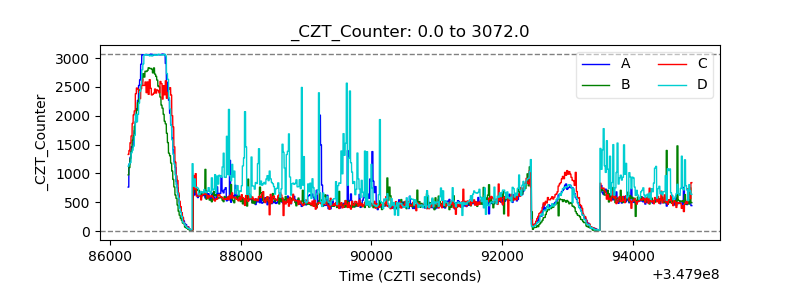 |
| +2.5 Volts monitor |  |
| +5 Volts monitor |  |
| _ROLL_ROT | 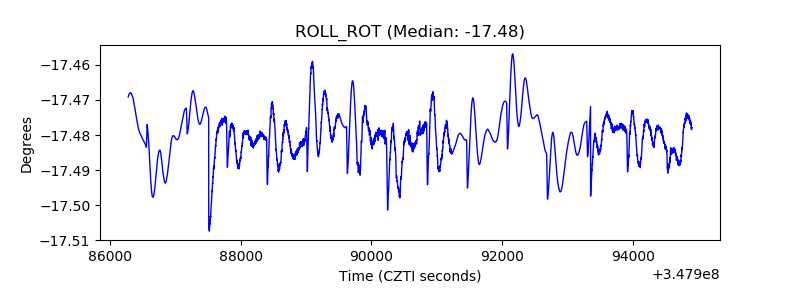 |
| _Roll_DEC |  |
| _Roll_RA | 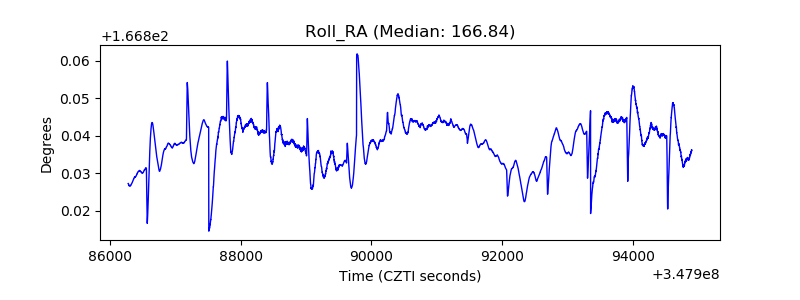 |
| Veto Counter | 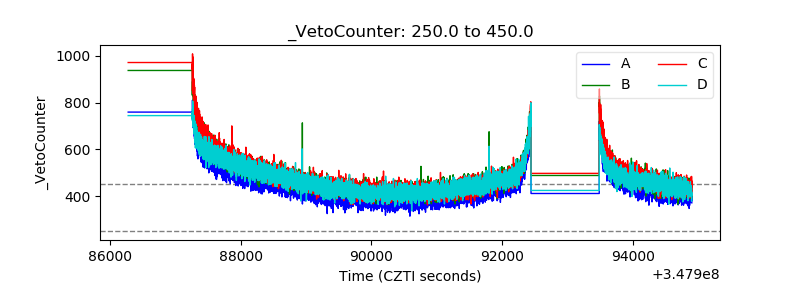 |