| Param | Original file | Final file |
|---|---|---|
| Filename | modeM0/AS1A10_102T03_9000004106_28591cztM0_level2.evt | modeM0/AS1A10_102T03_9000004106_28591cztM0_level2_quad_clean.evt |
| Size (bytes) | 542,969,280 | 86,451,840 |
| Size | 517.8 MB | 82.4 MB |
| Events in quadrant A | 3,834,413 | 542,379 |
| Events in quadrant B | 3,639,889 | 548,223 |
| Events in quadrant C | 3,669,428 | 528,268 |
| Events in quadrant D | 4,832,433 | 518,646 |
| Mode M9 | |||
|---|---|---|---|
| Quadrant | BADHDUFLAG | Total packets | Discarded packets |
| A | 0 | 18 | 0 |
| B | 0 | 18 | 0 |
| C | 0 | 18 | 0 |
| D | 0 | 18 | 0 |
| Mode M0 | |||
|---|---|---|---|
| Quadrant | BADHDUFLAG | Total packets | Discarded packets |
| A | 0 | 15767 | 2 |
| B | 0 | 15190 | 2 |
| C | 0 | 15153 | 3 |
| D | 0 | 19251 | 2 |
| Mode SS | |||
|---|---|---|---|
| Quadrant | BADHDUFLAG | Total packets | Discarded packets |
| A | 0 | 140 | 0 |
| B | 0 | 140 | 0 |
| C | 0 | 140 | 0 |
| D | 0 | 140 | 0 |
| Quadrant | Total seconds | Saturated seconds | Saturation percentage |
|---|---|---|---|
| A | 6903 | 180 | 2.607562% |
| B | 6903 | 155 | 2.245401% |
| C | 6902 | 191 | 2.767314% |
| D | 6902 | 222 | 3.216459% |
Noise dominated data is calculated using 1-second bins in cleaned event files. If a bin has >2000 counts, and if more than 50% of those come from <1% of pixels, then it is considered to be noise-dominated and hence unusable.
| Quadrant | # 1 sec bins | Bins with >0 counts | Bins with >2000 counts | High rate bins dominated by noise | Noise dominated (total time) | Noise dominated (detector-on time) | Marked lightcurve |
|---|---|---|---|---|---|---|---|
| A | 8623 | 6904 | 44 | 44 | 0.51% | 0.64% |  |
| B | 8623 | 6904 | 21 | 21 | 0.24% | 0.30% |  |
| C | 8622 | 6903 | 30 | 30 | 0.35% | 0.43% | 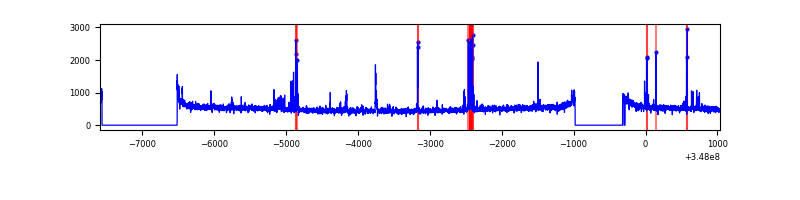 |
| D | 8622 | 6904 | 104 | 104 | 1.21% | 1.51% | 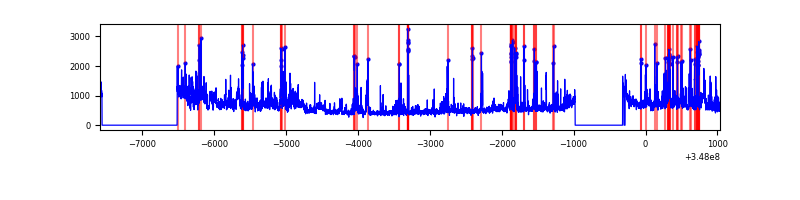 |
Top three noisy pixels from each quadrant. If the there are fewer than three noisy pixels in the level2.evt file, extra rows are filled as -1
| Pixel properties | Quadrant properties | ||||||
|---|---|---|---|---|---|---|---|
| Quadrant | DetID | PixID | Counts | Sigma | Mean | Median | Sigma |
| A | 15 | 174 | 434615 | 2463.32 | 876 | 858 | 176.1 |
| A | 8 | 192 | 13701 | 72.94 | 876 | 858 | 176.1 |
| A | 13 | 254 | 11940 | 62.94 | 876 | 858 | 176.1 |
| B | 4 | 171 | 131170 | 780.81 | 870 | 849 | 166.9 |
| B | 0 | 230 | 25447 | 147.38 | 870 | 849 | 166.9 |
| B | 10 | 246 | 24494 | 141.67 | 870 | 849 | 166.9 |
| C | 14 | 238 | 134056 | 673.89 | 845 | 848 | 197.7 |
| C | 7 | 247 | 117360 | 589.42 | 845 | 848 | 197.7 |
| C | 15 | 208 | 92904 | 465.7 | 845 | 848 | 197.7 |
| D | 8 | 195 | 799077 | 3942.35 | 851 | 830 | 202.5 |
| D | 1 | 52 | 535038 | 2638.32 | 851 | 830 | 202.5 |
| D | 2 | 250 | 127283 | 624.52 | 851 | 830 | 202.5 |
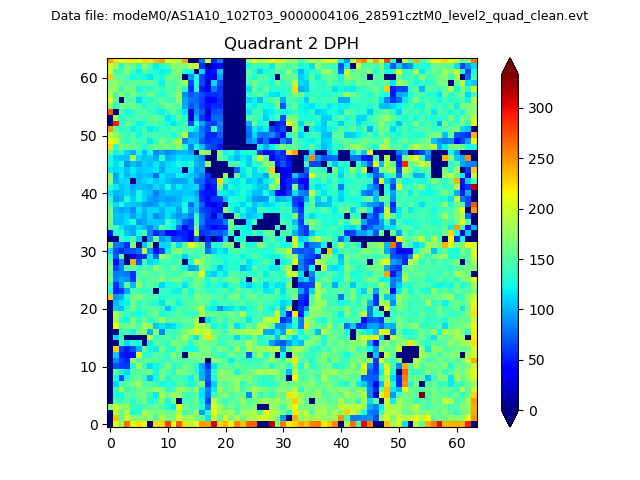
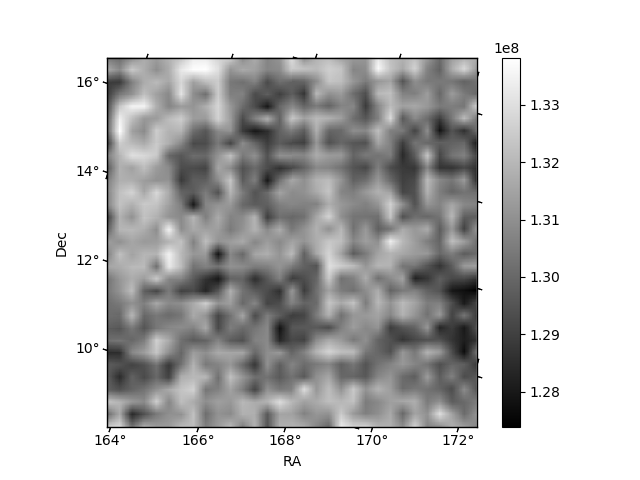
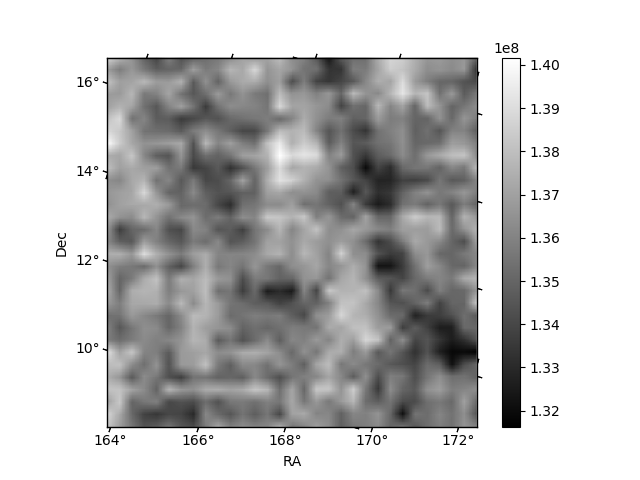
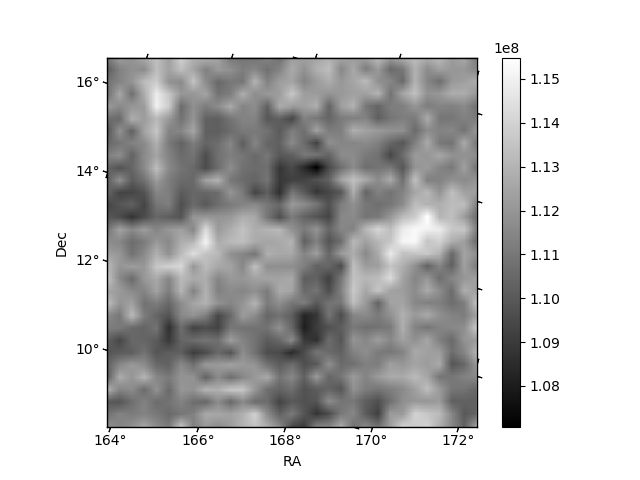
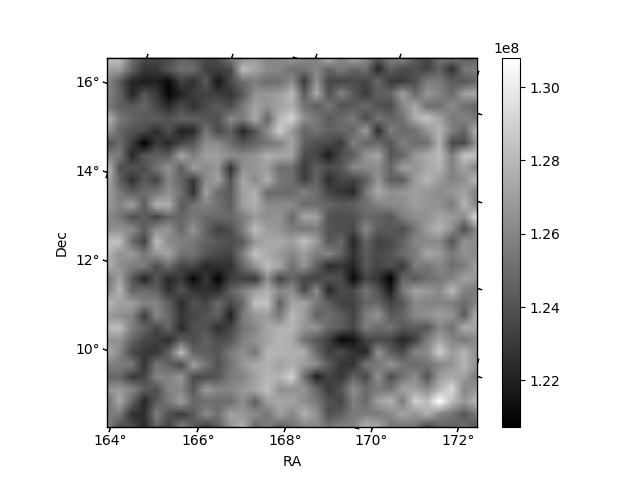
Histogram calculated using DETX and DETY for each event in the final _common_clean file
| Quadrant A | 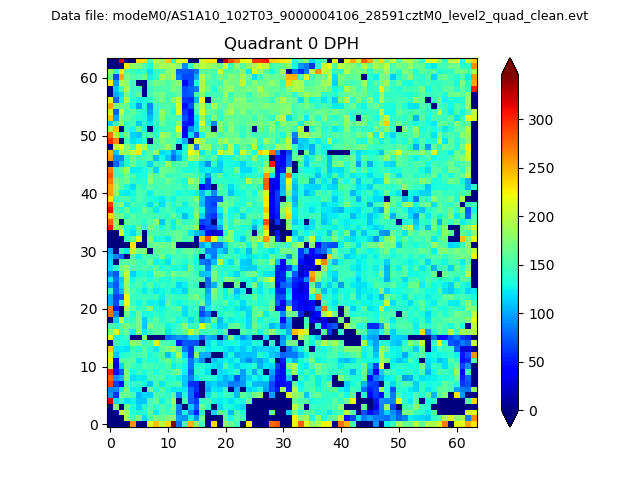 |
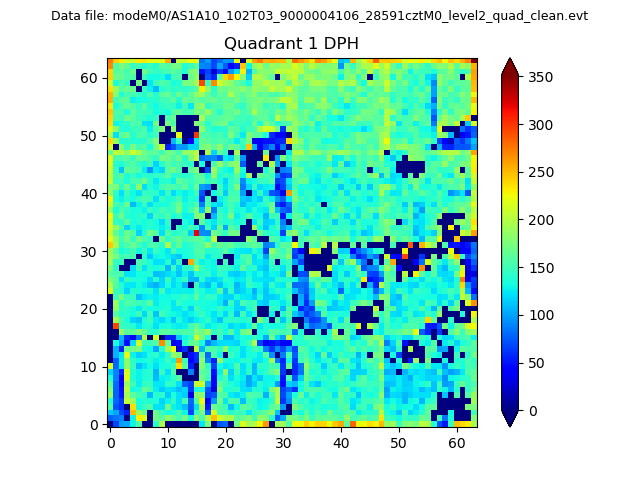 |
Quadrant B |
|---|---|---|---|
| Quadrant D | 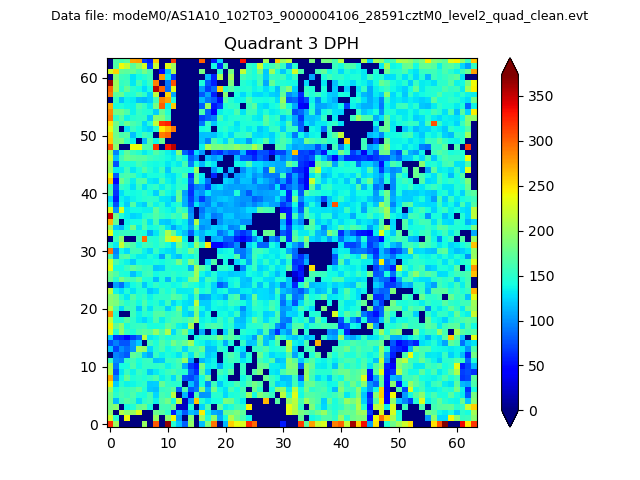 |
 |
Quadrant C |
| Plot type | Count rate plots | Images |
|---|---|---|
| Comparison with Poisson distribution Blue bars denote a histogram of data divided into 1 sec bins. Red curve is a Poisson curve with rate = median count rate of data. |
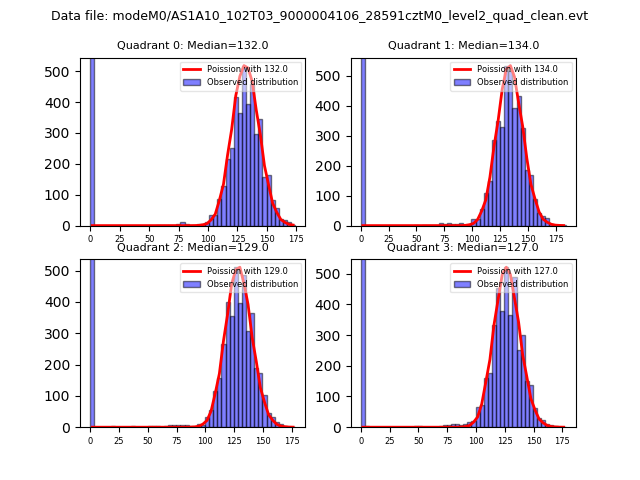 |
 |
| Quadrant-wise count rates Data is divided into 100 sec bins |
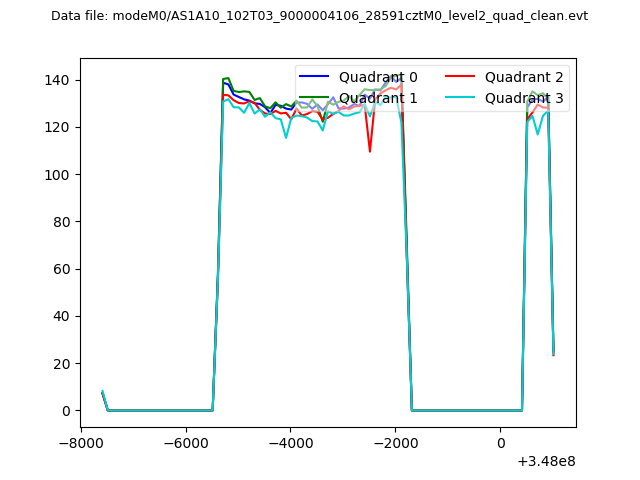 |
|
| Module-wise count rates for Quadrant A Data is divided into 100 sec bins |
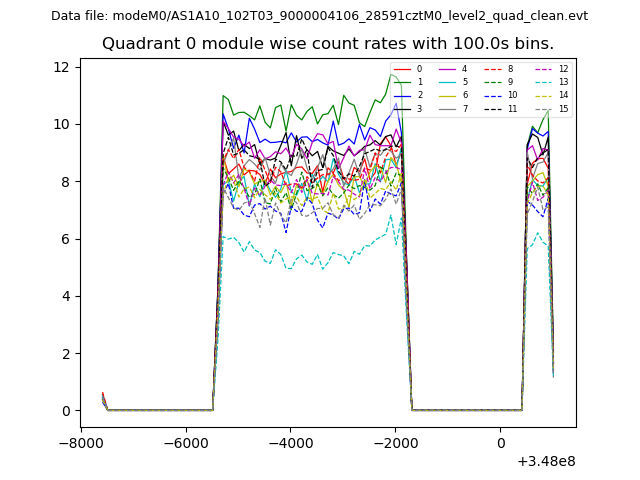 |
 |
| Module-wise count rates for Quadrant B Data is divided into 100 sec bins |
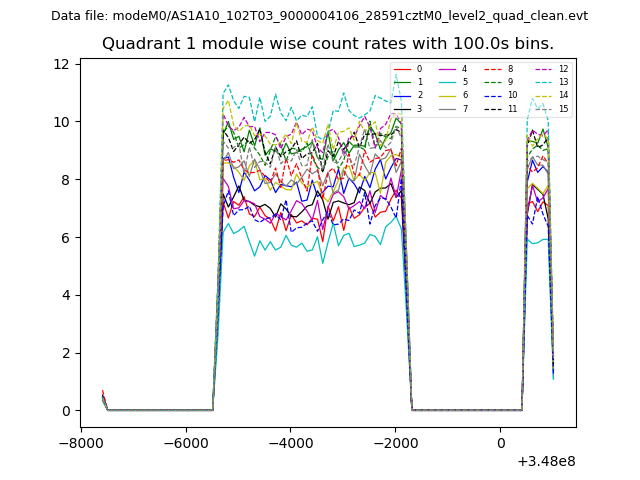 |
 |
| Module-wise count rates for Quadrant C Data is divided into 100 sec bins |
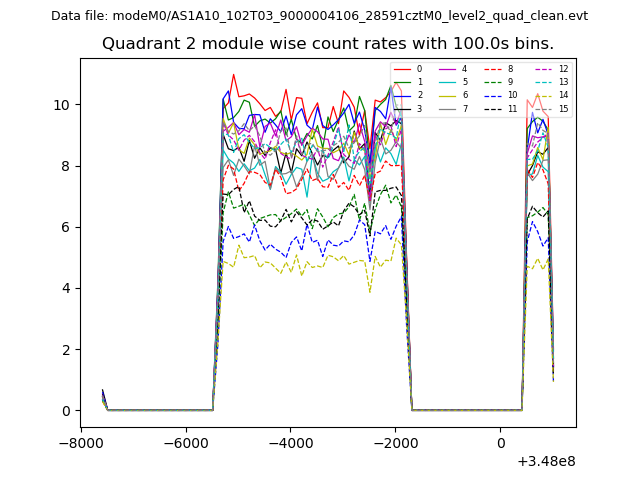 |
 |
| Module-wise count rates for Quadrant D Data is divided into 100 sec bins |
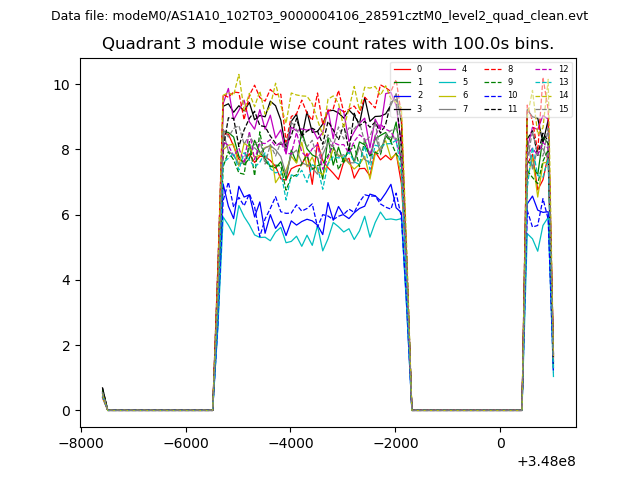 |
 |
| Parameter | Plot |
|---|---|
| CZT HV Monitor | 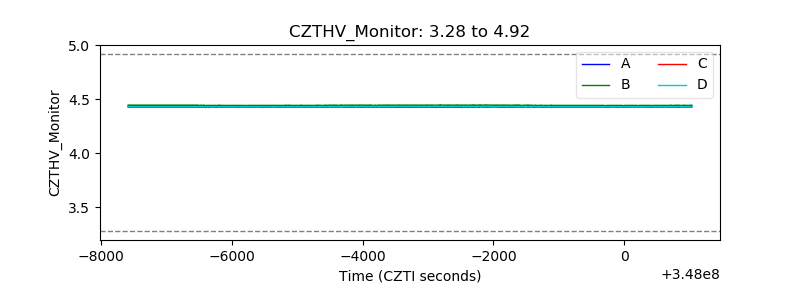 |
| D_VDD | 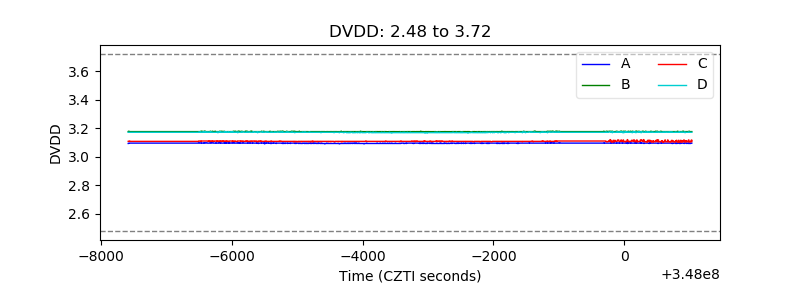 |
| Temperature 1 | 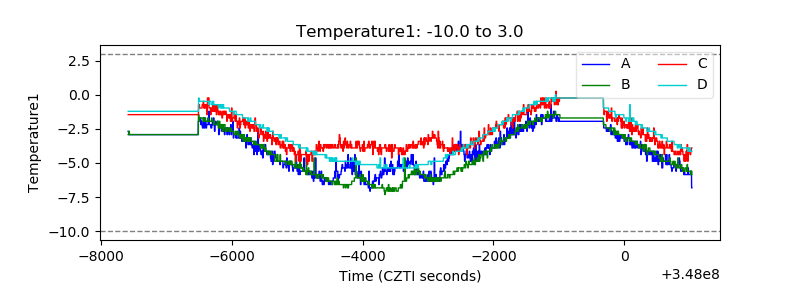 |
| Veto HV Monitor | 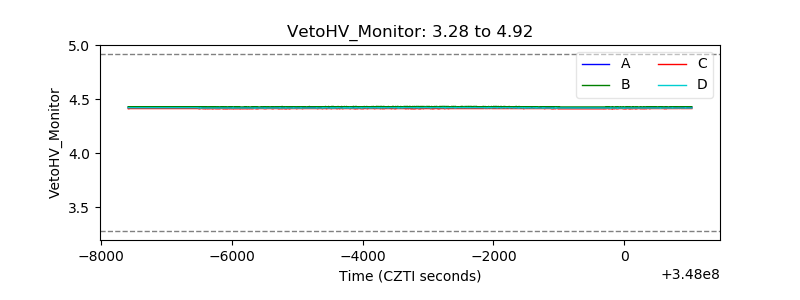 |
| Veto LLD | 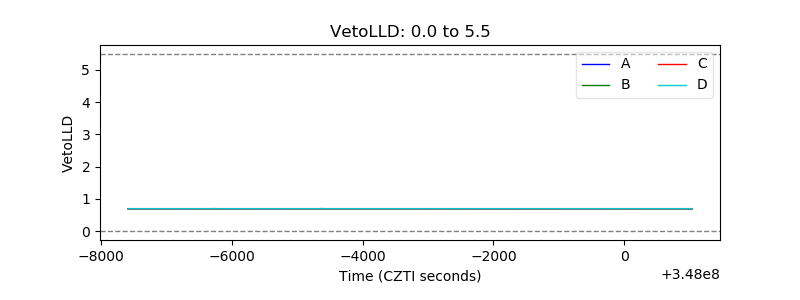 |
| Alpha Counter | 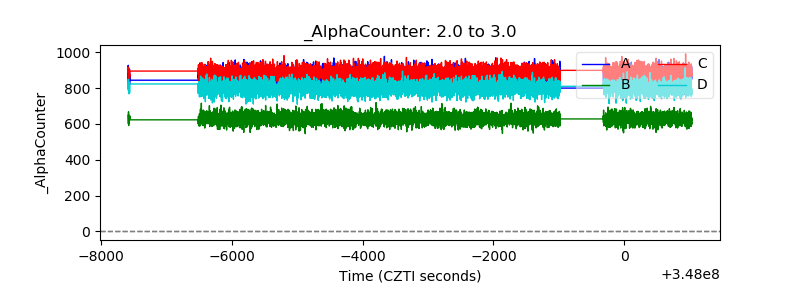 |
| _CPM_Rate | 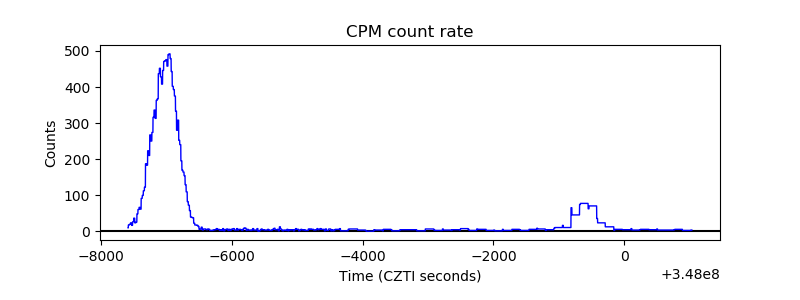 |
| CZT Counter | 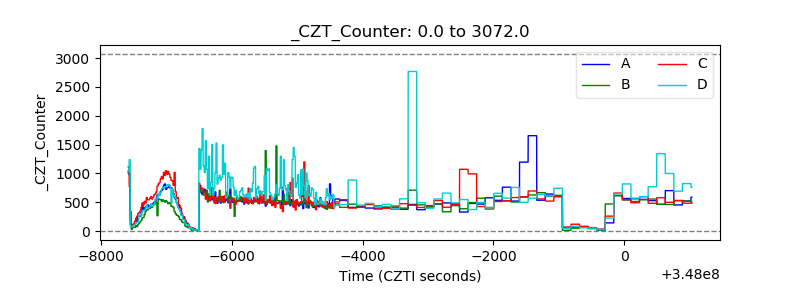 |
| +2.5 Volts monitor |  |
| +5 Volts monitor | 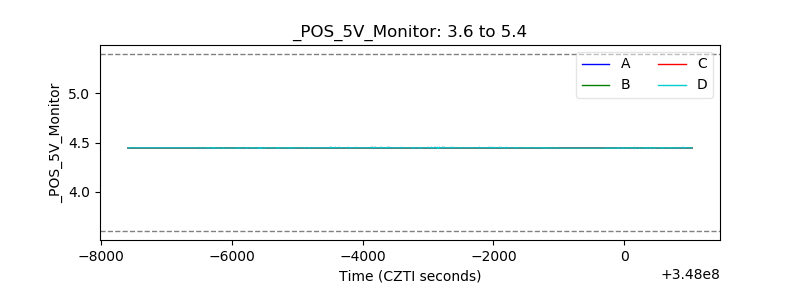 |
| _ROLL_ROT | 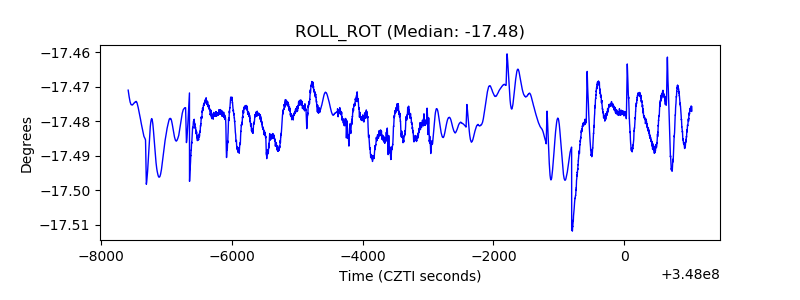 |
| _Roll_DEC | 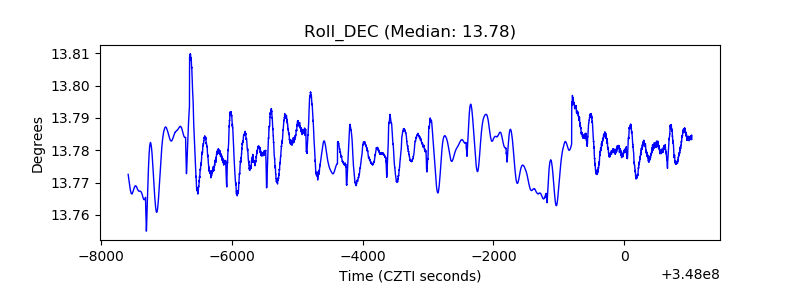 |
| _Roll_RA | 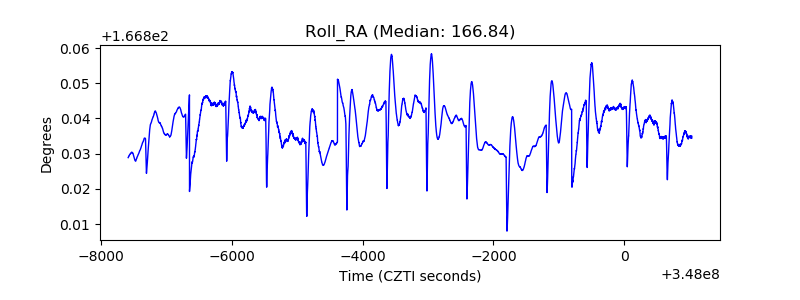 |
| Veto Counter | 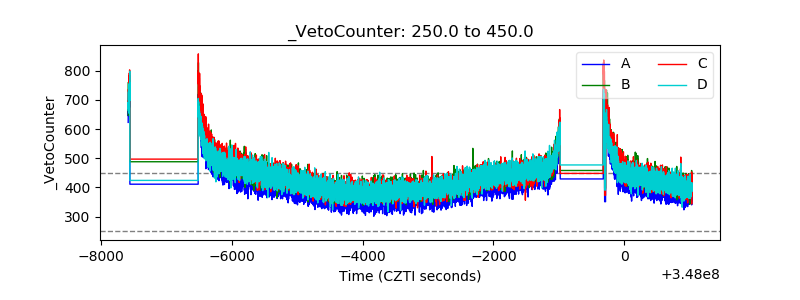 |