| Param | Original file | Final file |
|---|---|---|
| Filename | modeM0/AS1A10_102T03_9000004106_28592cztM0_level2.evt | modeM0/AS1A10_102T03_9000004106_28592cztM0_level2_quad_clean.evt |
| Size (bytes) | 590,497,920 | 93,234,240 |
| Size | 563.1 MB | 88.9 MB |
| Events in quadrant A | 3,941,316 | 583,044 |
| Events in quadrant B | 3,811,426 | 589,437 |
| Events in quadrant C | 3,877,802 | 570,139 |
| Events in quadrant D | 5,739,126 | 553,917 |
| Mode M9 | |||
|---|---|---|---|
| Quadrant | BADHDUFLAG | Total packets | Discarded packets |
| A | 0 | 10 | 0 |
| B | 0 | 10 | 0 |
| C | 0 | 10 | 0 |
| D | 0 | 10 | 0 |
| Mode M0 | |||
|---|---|---|---|
| Quadrant | BADHDUFLAG | Total packets | Discarded packets |
| A | 0 | 16460 | 2 |
| B | 0 | 16146 | 2 |
| C | 0 | 16295 | 2 |
| D | 0 | 22271 | 2 |
| Mode SS | |||
|---|---|---|---|
| Quadrant | BADHDUFLAG | Total packets | Discarded packets |
| A | 0 | 154 | 0 |
| B | 0 | 154 | 0 |
| C | 0 | 154 | 0 |
| D | 0 | 154 | 0 |
| Quadrant | Total seconds | Saturated seconds | Saturation percentage |
|---|---|---|---|
| A | 7581 | 109 | 1.437805% |
| B | 7581 | 149 | 1.965440% |
| C | 7581 | 203 | 2.677747% |
| D | 7581 | 467 | 6.160137% |
Noise dominated data is calculated using 1-second bins in cleaned event files. If a bin has >2000 counts, and if more than 50% of those come from <1% of pixels, then it is considered to be noise-dominated and hence unusable.
| Quadrant | # 1 sec bins | Bins with >0 counts | Bins with >2000 counts | High rate bins dominated by noise | Noise dominated (total time) | Noise dominated (detector-on time) | Marked lightcurve |
|---|---|---|---|---|---|---|---|
| A | 8561 | 7583 | 13 | 13 | 0.15% | 0.17% | 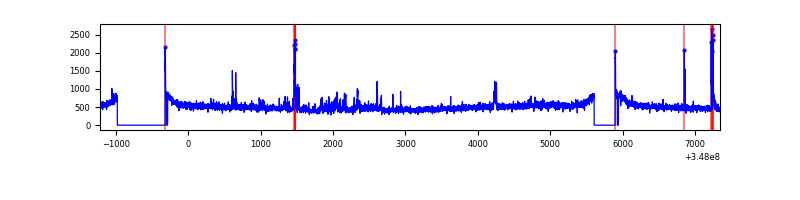 |
| B | 8561 | 7583 | 0 | 0 | 0.00% | 0.00% | 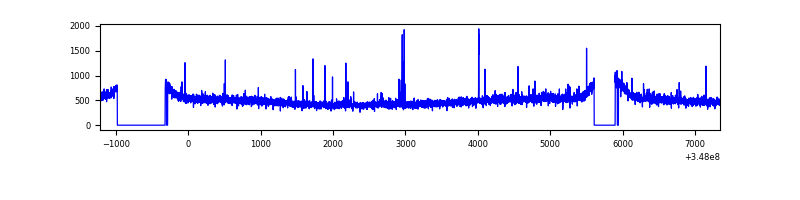 |
| C | 8561 | 7584 | 8 | 8 | 0.09% | 0.11% | 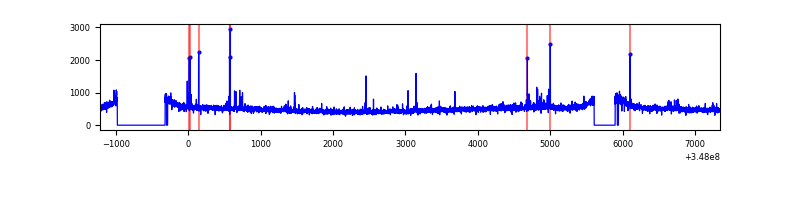 |
| D | 8561 | 7584 | 243 | 243 | 2.84% | 3.20% | 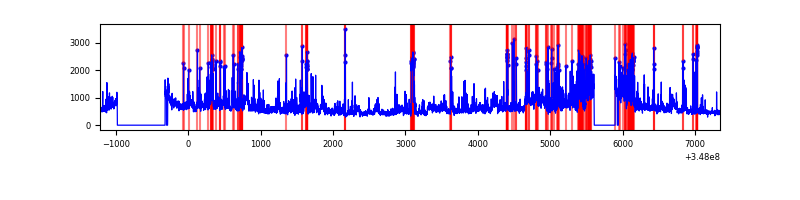 |
Top three noisy pixels from each quadrant. If the there are fewer than three noisy pixels in the level2.evt file, extra rows are filled as -1
| Pixel properties | Quadrant properties | ||||||
|---|---|---|---|---|---|---|---|
| Quadrant | DetID | PixID | Counts | Sigma | Mean | Median | Sigma |
| A | 15 | 174 | 125284 | 639.3 | 959 | 938 | 194.5 |
| A | 12 | 16 | 83130 | 422.58 | 959 | 938 | 194.5 |
| A | 12 | 194 | 21495 | 105.69 | 959 | 938 | 194.5 |
| B | 5 | 255 | 30484 | 159.41 | 953 | 928 | 185.4 |
| B | 12 | 111 | 22979 | 118.93 | 953 | 928 | 185.4 |
| B | 11 | 111 | 20575 | 105.96 | 953 | 928 | 185.4 |
| C | 14 | 238 | 146181 | 671.29 | 922 | 926 | 216.4 |
| C | 7 | 247 | 62563 | 284.85 | 922 | 926 | 216.4 |
| C | 15 | 208 | 30232 | 135.44 | 922 | 926 | 216.4 |
| D | 1 | 52 | 1043054 | 4675.33 | 917 | 889 | 222.9 |
| D | 8 | 195 | 863178 | 3868.37 | 917 | 889 | 222.9 |
| D | 2 | 250 | 164244 | 732.84 | 917 | 889 | 222.9 |
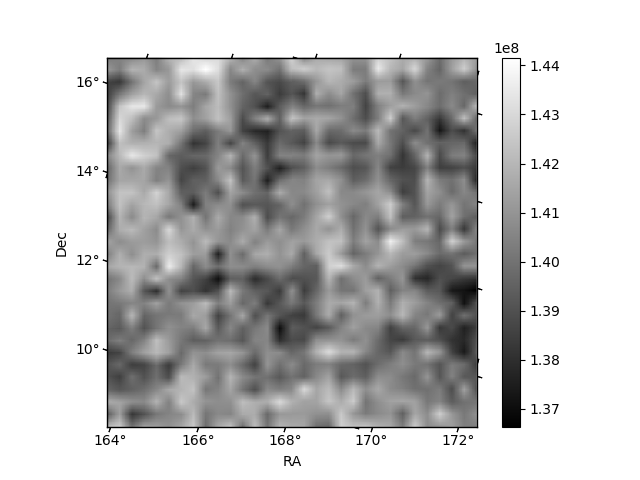
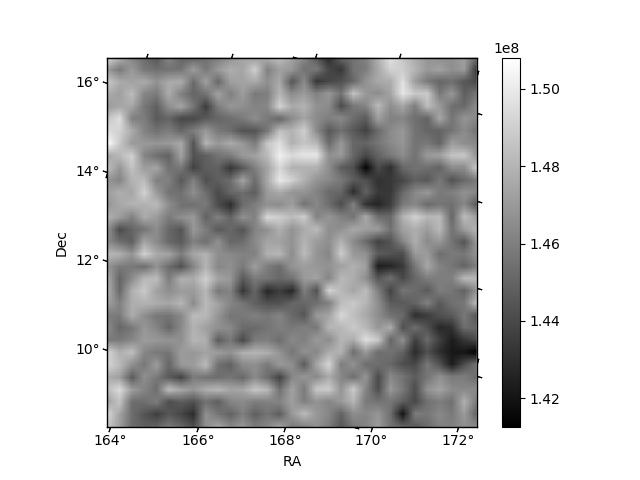
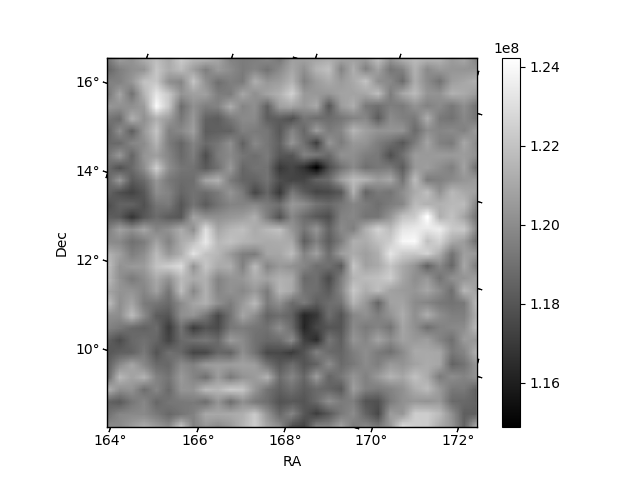
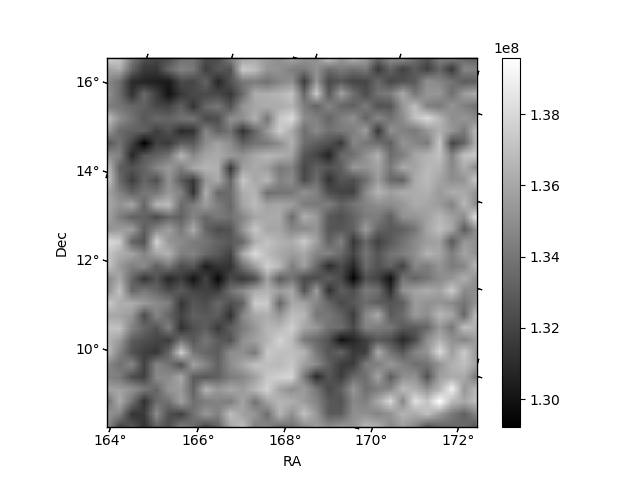
Histogram calculated using DETX and DETY for each event in the final _common_clean file
| Quadrant A |  |
 |
Quadrant B |
|---|---|---|---|
| Quadrant D |  |
 |
Quadrant C |
| Plot type | Count rate plots | Images |
|---|---|---|
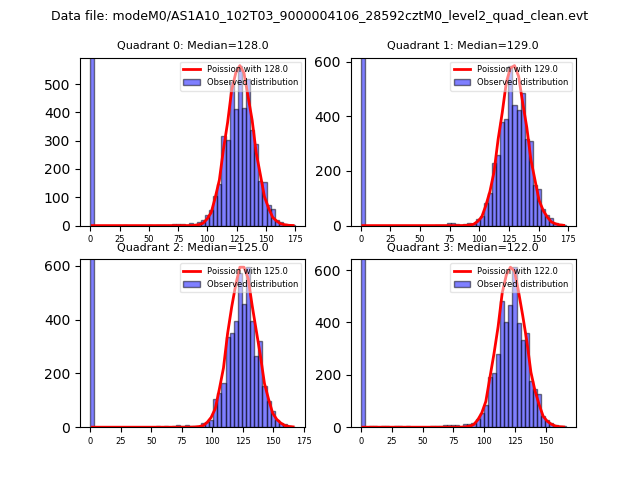
| Comparison with Poisson distribution Blue bars denote a histogram of data divided into 1 sec bins. Red curve is a Poisson curve with rate = median count rate of data. |
 |
 |
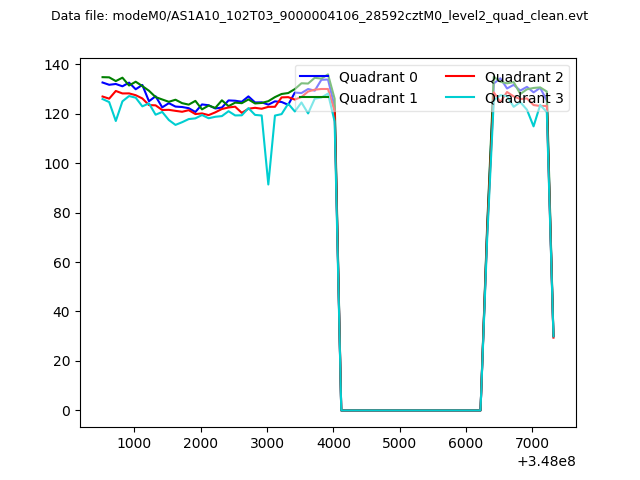
| Quadrant-wise count rates Data is divided into 100 sec bins |
 |
|
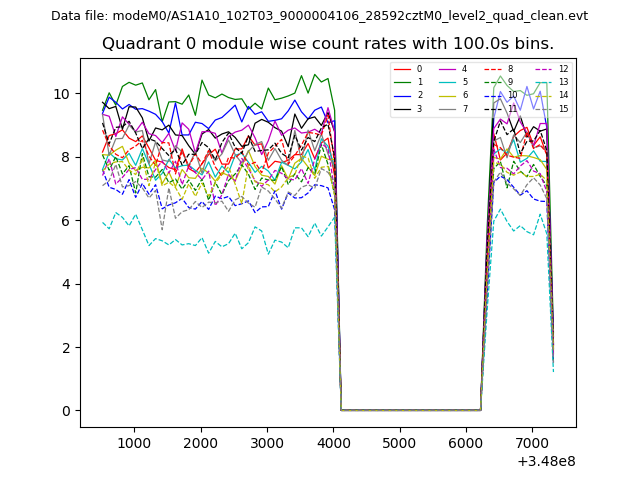
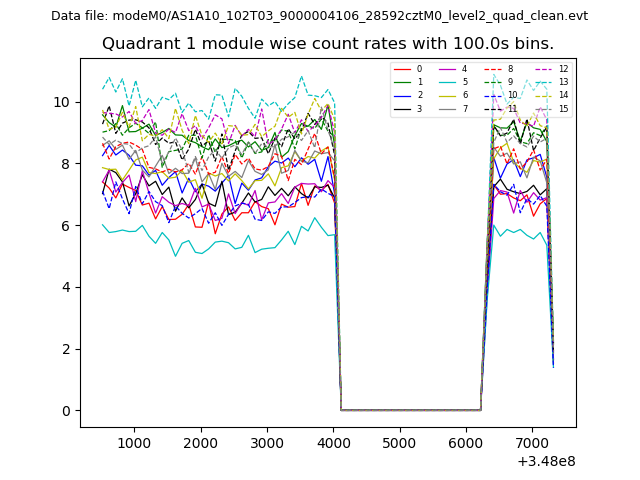
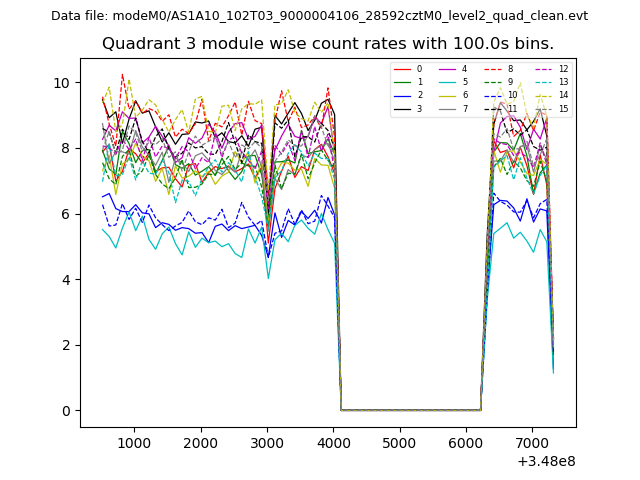
| Module-wise count rates for Quadrant A Data is divided into 100 sec bins |
 |
 |
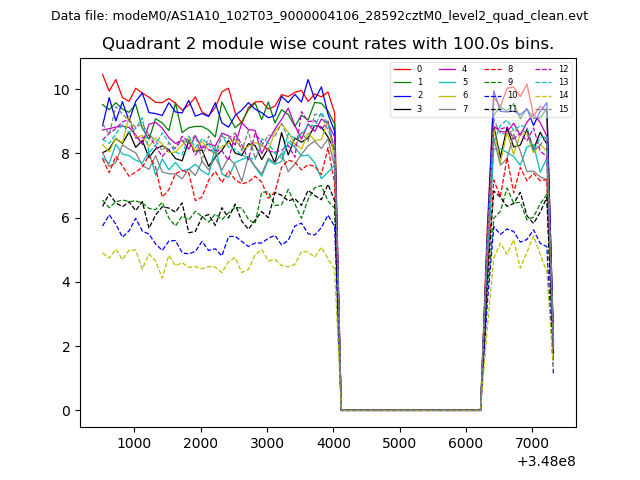
| Module-wise count rates for Quadrant B Data is divided into 100 sec bins |
 |
 |
| Module-wise count rates for Quadrant C Data is divided into 100 sec bins |
 |
 |
| Module-wise count rates for Quadrant D Data is divided into 100 sec bins |
 |
 |
| Parameter | Plot |
|---|---|
| CZT HV Monitor | 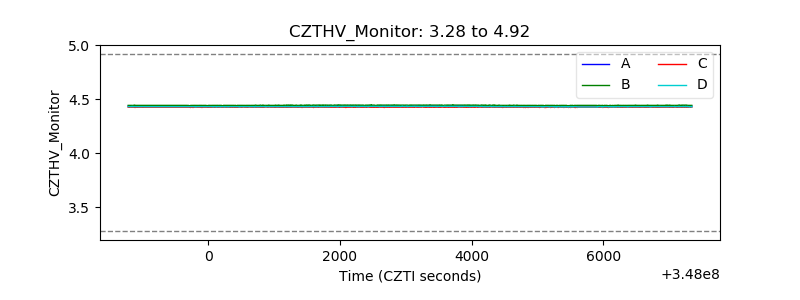 |
| D_VDD | 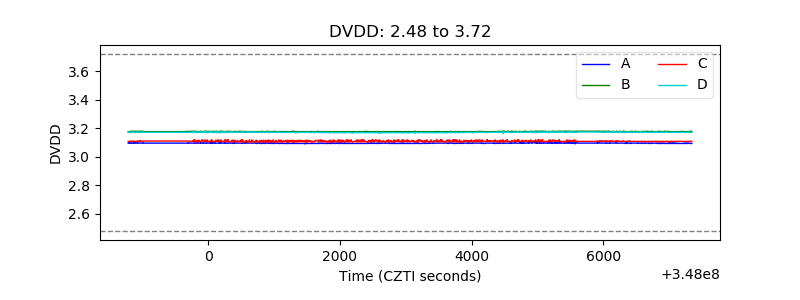 |
| Temperature 1 | 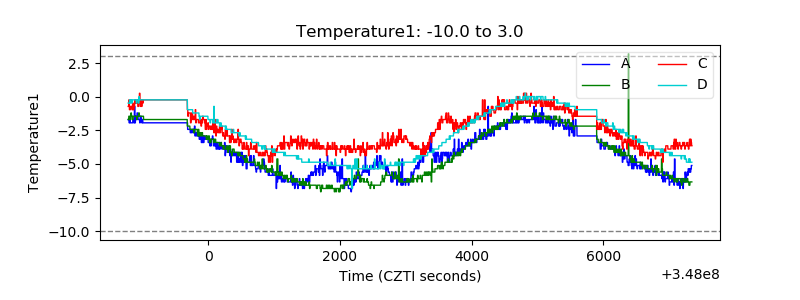 |
| Veto HV Monitor | 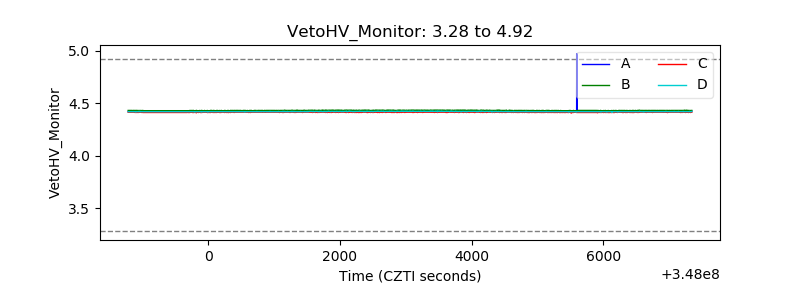 |
| Veto LLD | 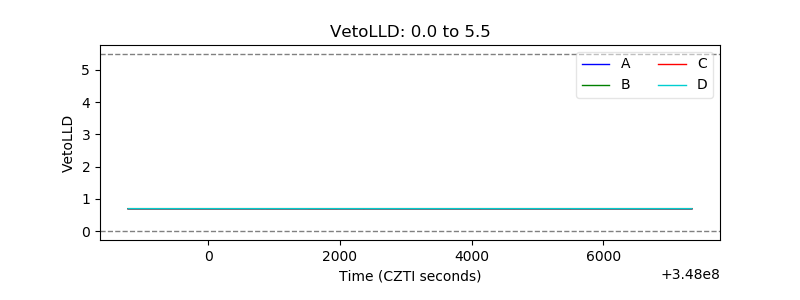 |
| Alpha Counter | 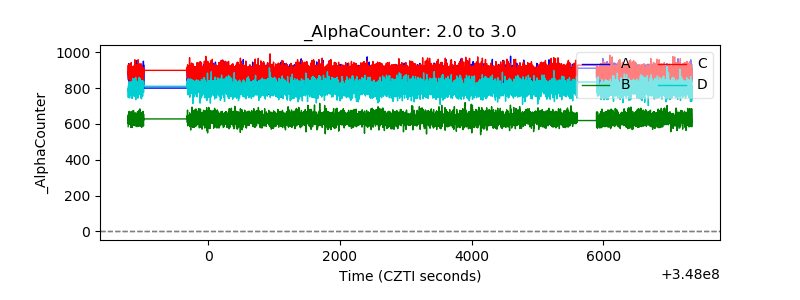 |
| _CPM_Rate | 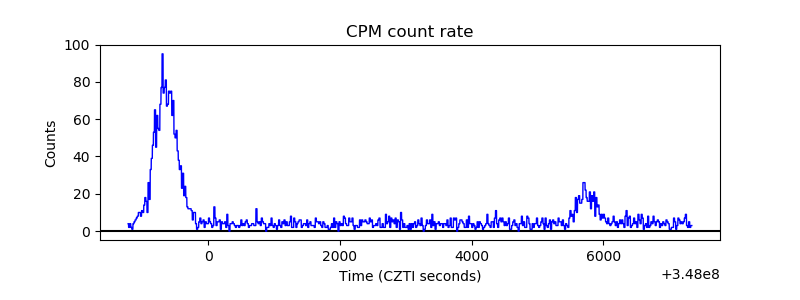 |
| CZT Counter | 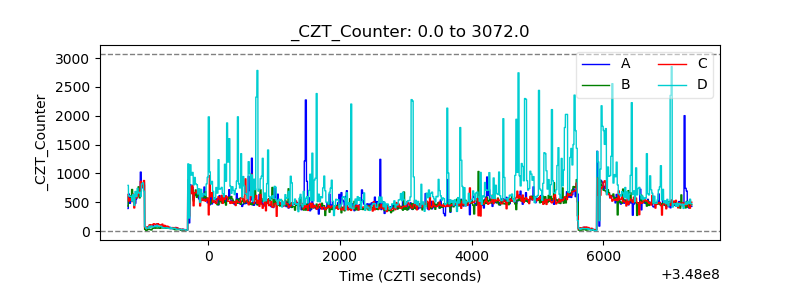 |
| +2.5 Volts monitor |  |
| +5 Volts monitor |  |
| _ROLL_ROT | 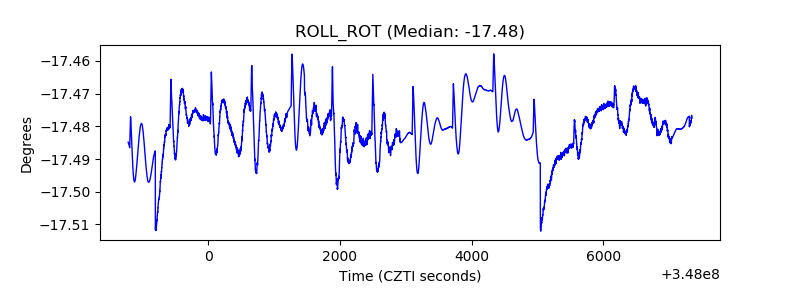 |
| _Roll_DEC | 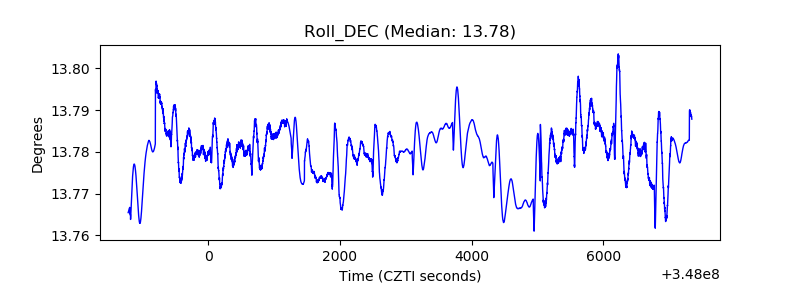 |
| _Roll_RA | 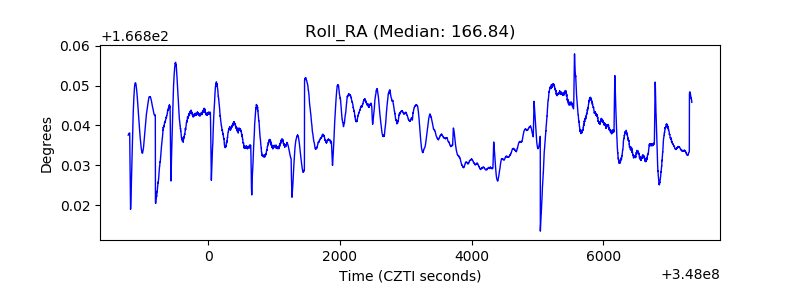 |
| Veto Counter | 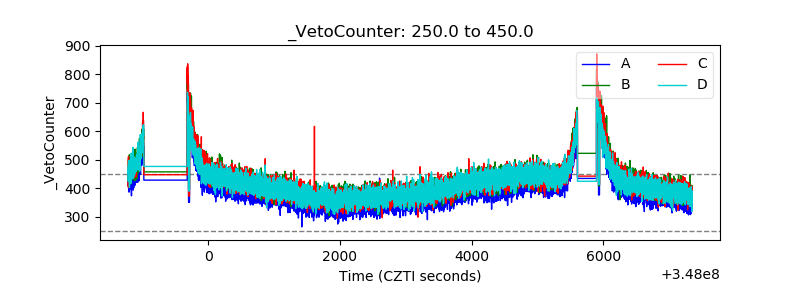 |