| Param | Original file | Final file |
|---|---|---|
| Filename | modeM0/AS1A10_102T03_9000004106_28593cztM0_level2.evt | modeM0/AS1A10_102T03_9000004106_28593cztM0_level2_quad_clean.evt |
| Size (bytes) | 222,672,960 | 31,769,280 |
| Size | 212.4 MB | 30.3 MB |
| Events in quadrant A | 1,438,325 | 195,398 |
| Events in quadrant B | 1,506,254 | 195,546 |
| Events in quadrant C | 1,438,710 | 188,779 |
| Events in quadrant D | 2,173,053 | 186,518 |
| Mode M9 | |||
|---|---|---|---|
| Quadrant | BADHDUFLAG | Total packets | Discarded packets |
| A | 0 | 3 | 0 |
| B | 0 | 3 | 0 |
| C | 0 | 3 | 0 |
| D | 0 | 3 | 0 |
| Mode M0 | |||
|---|---|---|---|
| Quadrant | BADHDUFLAG | Total packets | Discarded packets |
| A | 0 | 6000 | 1 |
| B | 0 | 6159 | 1 |
| C | 0 | 5947 | 1 |
| D | 0 | 8397 | 1 |
| Mode SS | |||
|---|---|---|---|
| Quadrant | BADHDUFLAG | Total packets | Discarded packets |
| A | 0 | 58 | 0 |
| B | 0 | 58 | 0 |
| C | 0 | 58 | 0 |
| D | 0 | 58 | 0 |
| Quadrant | Total seconds | Saturated seconds | Saturation percentage |
|---|---|---|---|
| A | 2723 | 56 | 2.056555% |
| B | 2723 | 114 | 4.186559% |
| C | 2723 | 114 | 4.186559% |
| D | 2723 | 283 | 10.392949% |
Noise dominated data is calculated using 1-second bins in cleaned event files. If a bin has >2000 counts, and if more than 50% of those come from <1% of pixels, then it is considered to be noise-dominated and hence unusable.
| Quadrant | # 1 sec bins | Bins with >0 counts | Bins with >2000 counts | High rate bins dominated by noise | Noise dominated (total time) | Noise dominated (detector-on time) | Marked lightcurve |
|---|---|---|---|---|---|---|---|
| A | 3028 | 2724 | 7 | 7 | 0.23% | 0.26% | 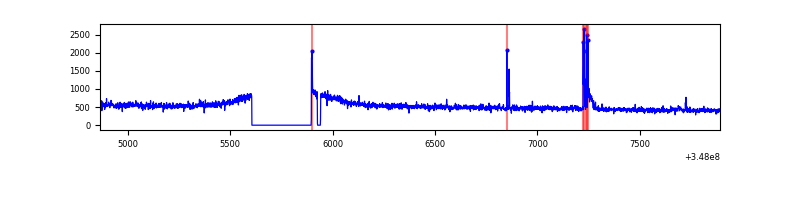 |
| B | 3028 | 2724 | 23 | 23 | 0.76% | 0.84% | 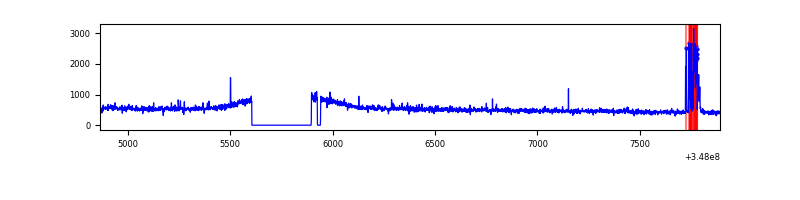 |
| C | 3028 | 2725 | 2 | 2 | 0.07% | 0.07% |  |
| D | 3028 | 2724 | 118 | 118 | 3.90% | 4.33% | 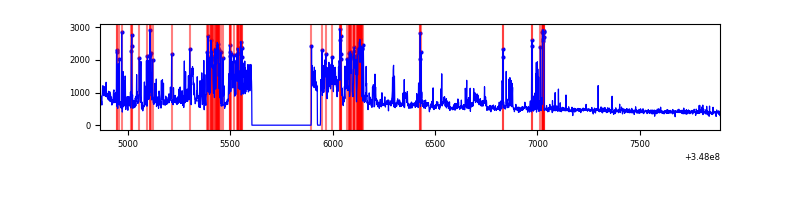 |
Top three noisy pixels from each quadrant. If the there are fewer than three noisy pixels in the level2.evt file, extra rows are filled as -1
| Pixel properties | Quadrant properties | ||||||
|---|---|---|---|---|---|---|---|
| Quadrant | DetID | PixID | Counts | Sigma | Mean | Median | Sigma |
| A | 15 | 174 | 40165 | 532.74 | 359 | 351 | 74.7 |
| A | 8 | 192 | 7451 | 95.0 | 359 | 351 | 74.7 |
| A | 13 | 254 | 5064 | 63.06 | 359 | 351 | 74.7 |
| B | 10 | 245 | 83947 | 1163.55 | 358 | 348 | 71.8 |
| B | 12 | 111 | 8740 | 116.8 | 358 | 348 | 71.8 |
| B | 11 | 111 | 7749 | 103.01 | 358 | 348 | 71.8 |
| C | 14 | 238 | 56004 | 669.57 | 344 | 345 | 83.1 |
| C | 7 | 247 | 20152 | 238.27 | 344 | 345 | 83.1 |
| C | 15 | 208 | 8607 | 99.39 | 344 | 345 | 83.1 |
| D | 1 | 52 | 509297 | 6092.76 | 338 | 328 | 83.5 |
| D | 8 | 195 | 235678 | 2817.32 | 338 | 328 | 83.5 |
| D | 2 | 250 | 86567 | 1032.35 | 338 | 328 | 83.5 |
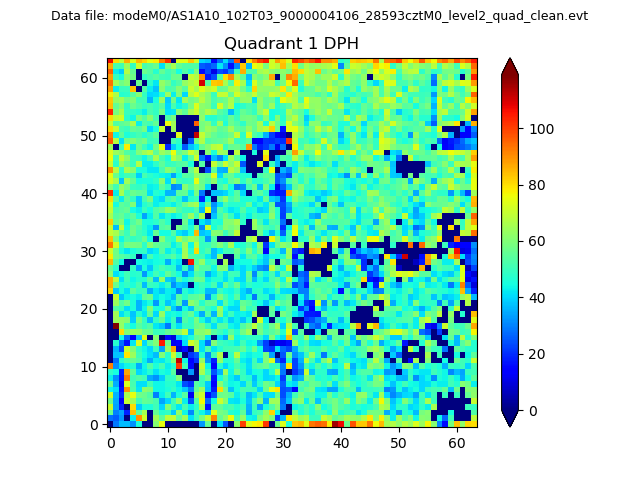
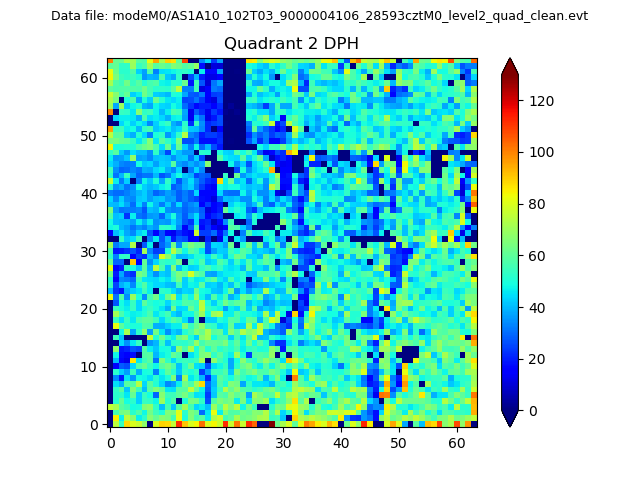
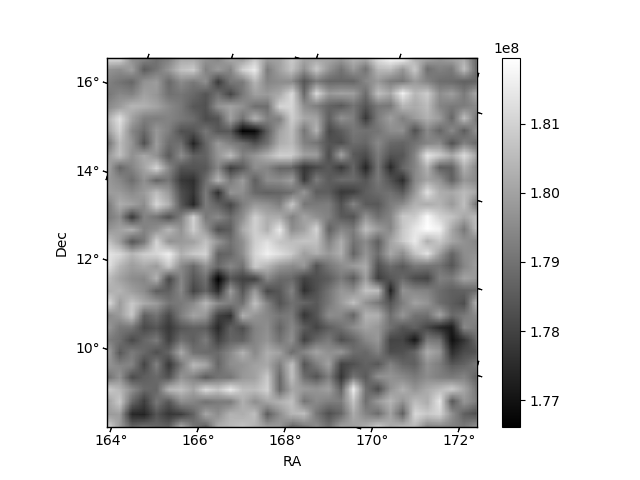
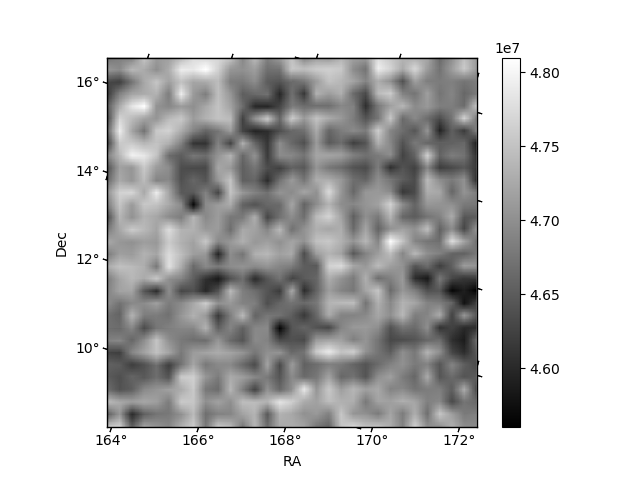
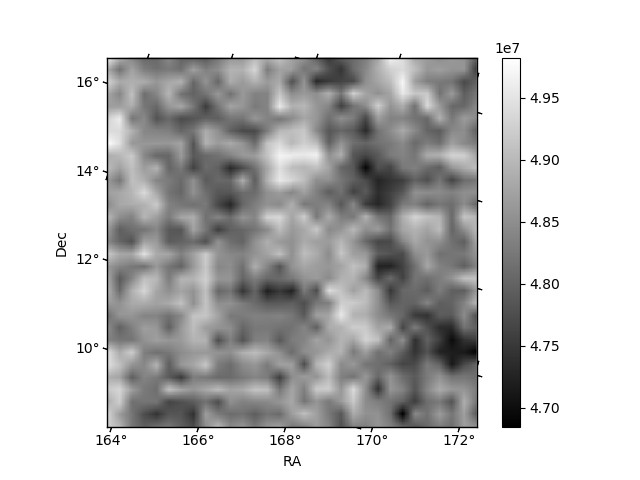
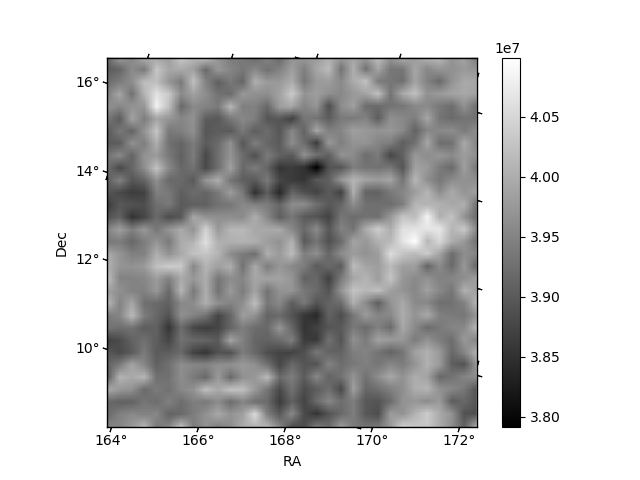
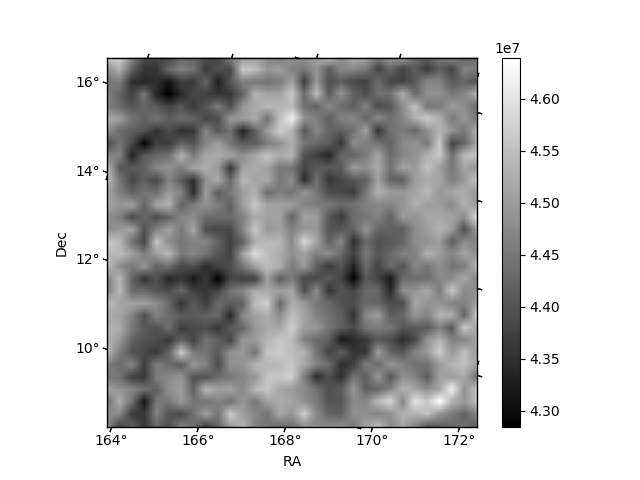
Histogram calculated using DETX and DETY for each event in the final _common_clean file
| Quadrant A | 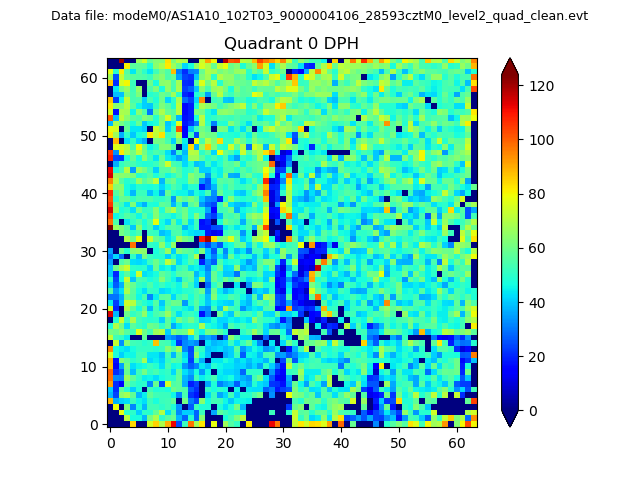 |
 |
Quadrant B |
|---|---|---|---|
| Quadrant D | 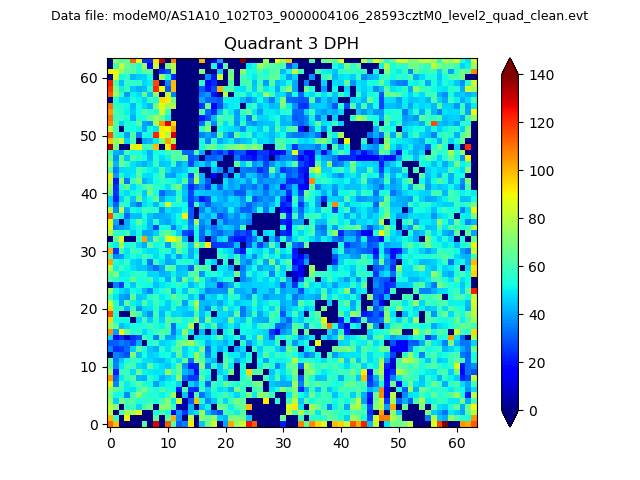 |
 |
Quadrant C |
| Plot type | Count rate plots | Images |
|---|---|---|
| Comparison with Poisson distribution Blue bars denote a histogram of data divided into 1 sec bins. Red curve is a Poisson curve with rate = median count rate of data. |
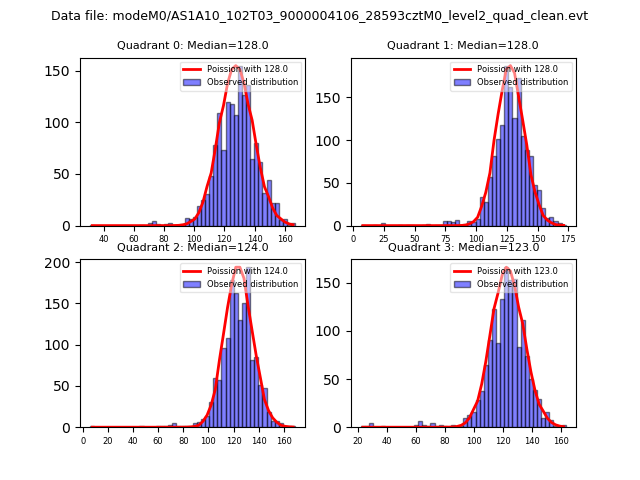 |
 |
| Quadrant-wise count rates Data is divided into 100 sec bins |
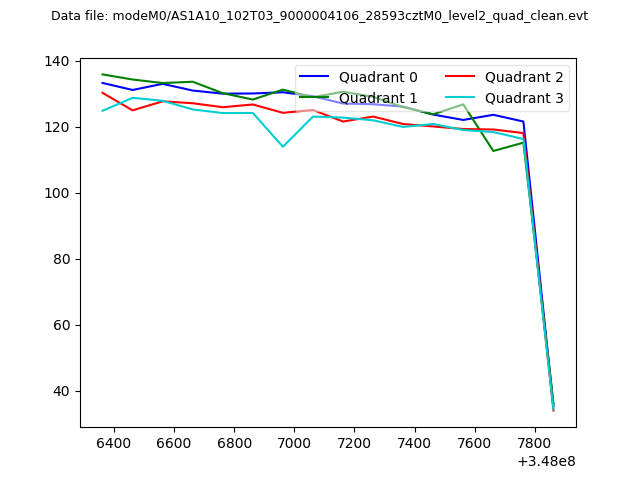 |
|
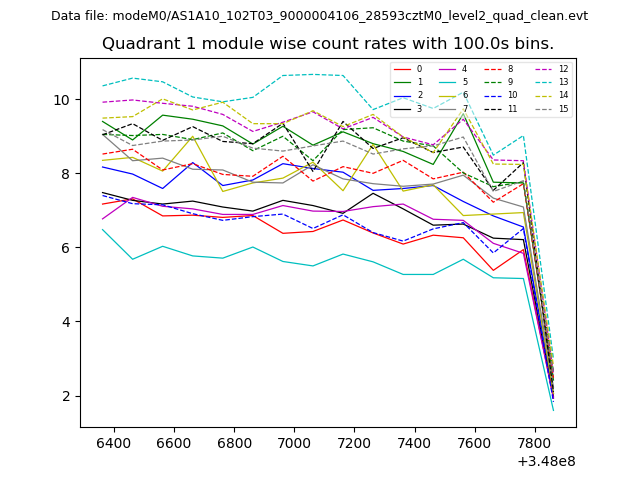
| Module-wise count rates for Quadrant A Data is divided into 100 sec bins |
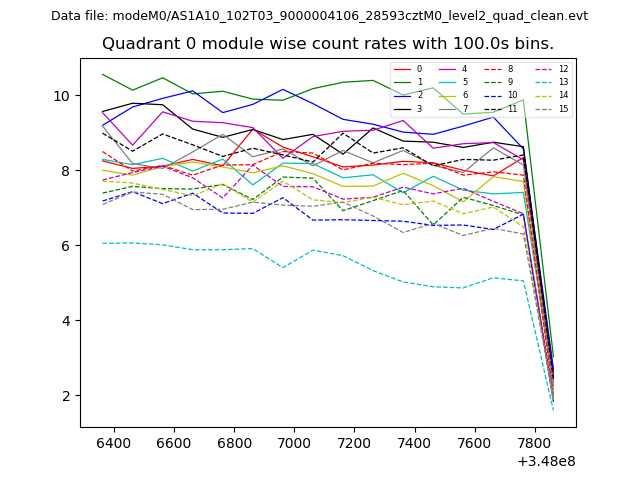 |
 |
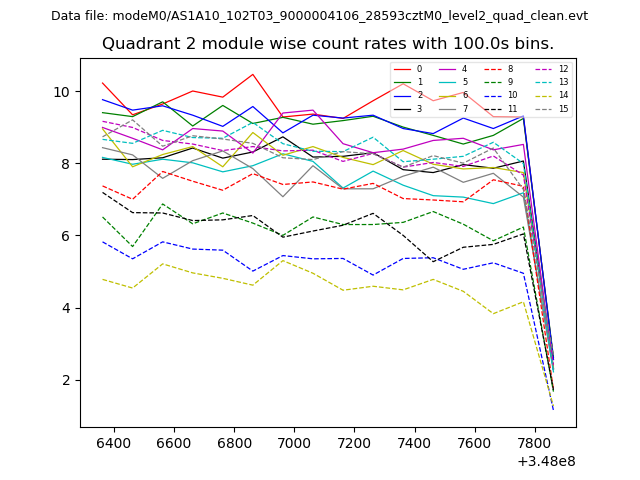
| Module-wise count rates for Quadrant B Data is divided into 100 sec bins |
 |
 |
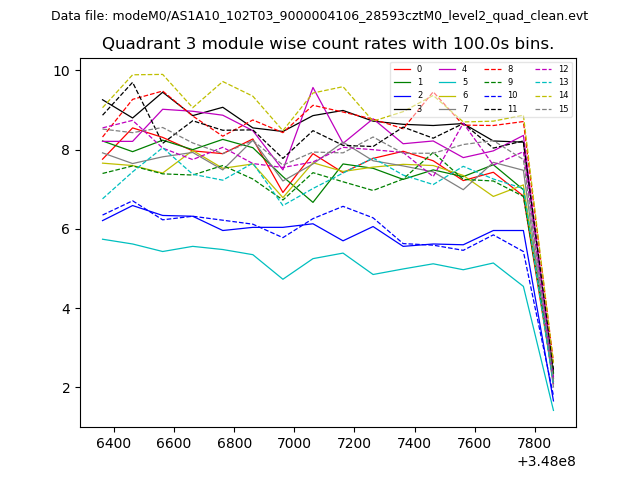
| Module-wise count rates for Quadrant C Data is divided into 100 sec bins |
 |
 |
| Module-wise count rates for Quadrant D Data is divided into 100 sec bins |
 |
 |
| Parameter | Plot |
|---|---|
| CZT HV Monitor | 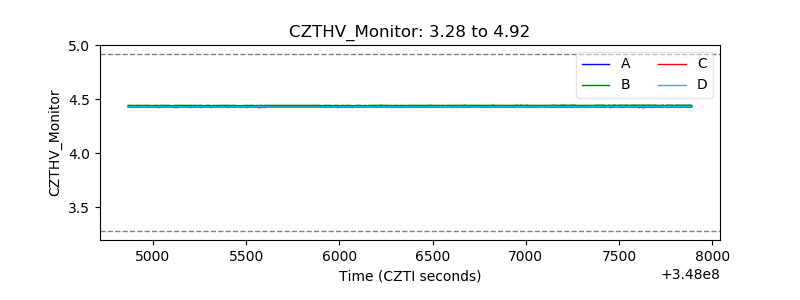 |
| D_VDD | 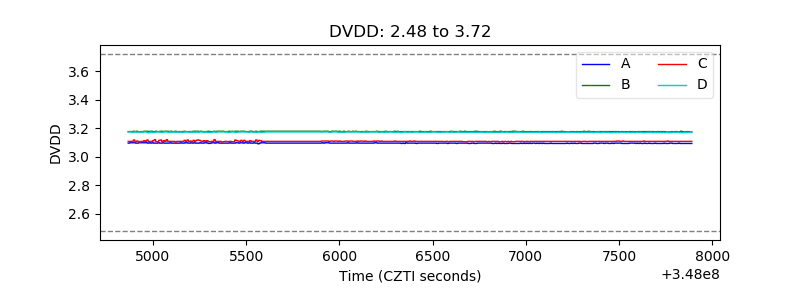 |
| Temperature 1 |  |
| Veto HV Monitor | 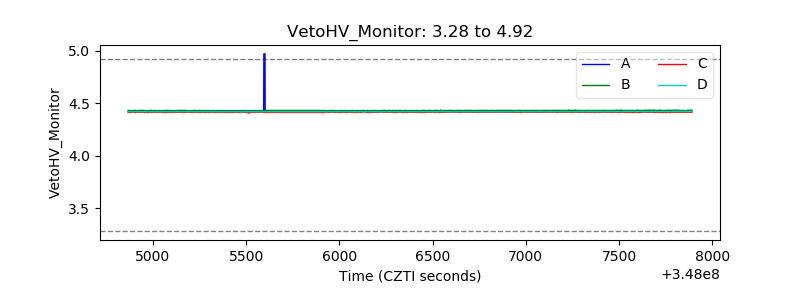 |
| Veto LLD | 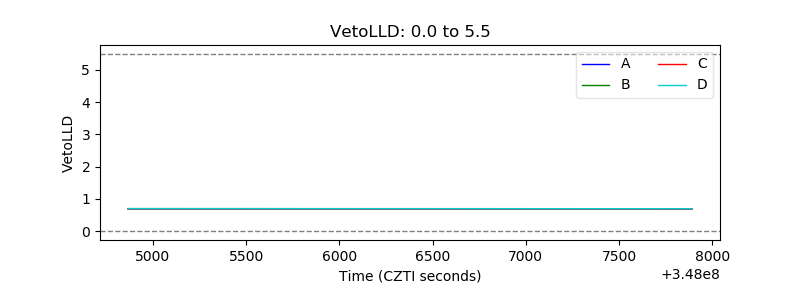 |
| Alpha Counter | 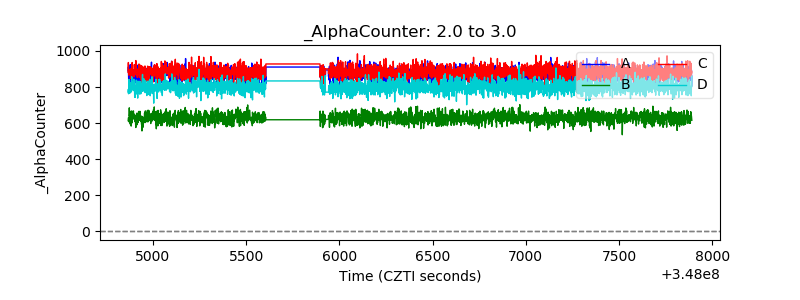 |
| _CPM_Rate | 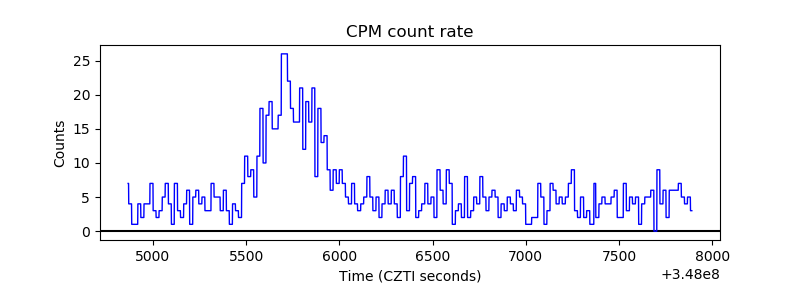 |
| CZT Counter | 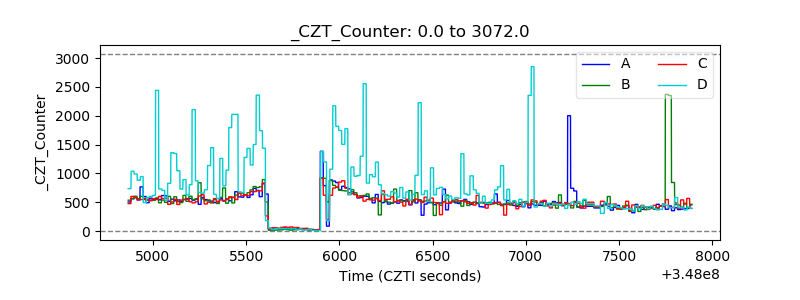 |
| +2.5 Volts monitor |  |
| +5 Volts monitor |  |
| _ROLL_ROT | 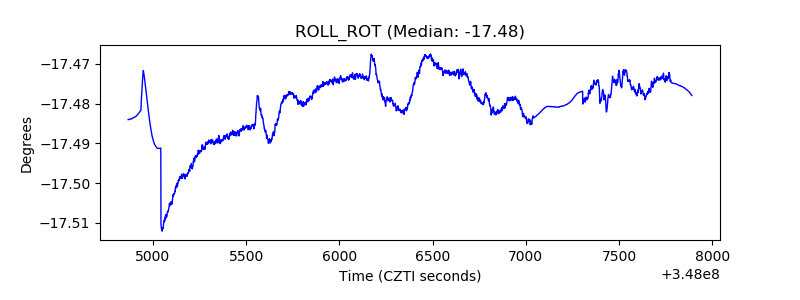 |
| _Roll_DEC | 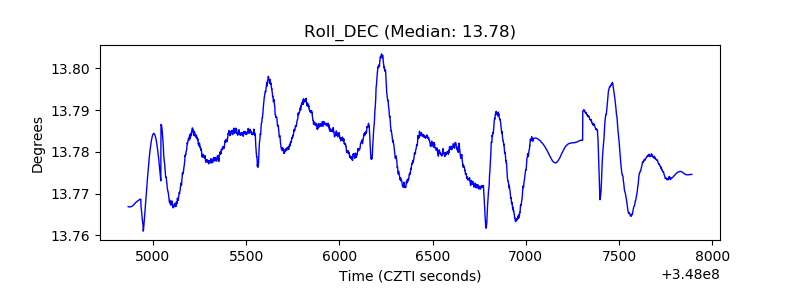 |
| _Roll_RA | 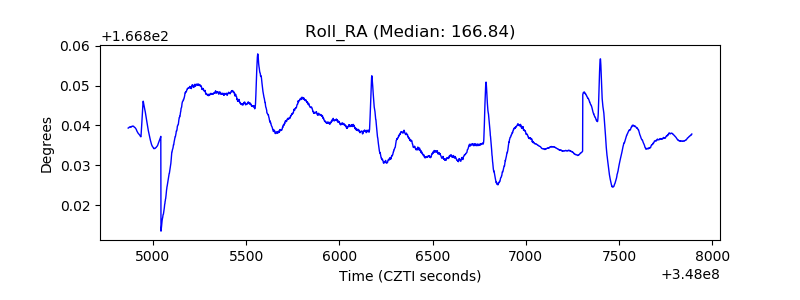 |
| Veto Counter | 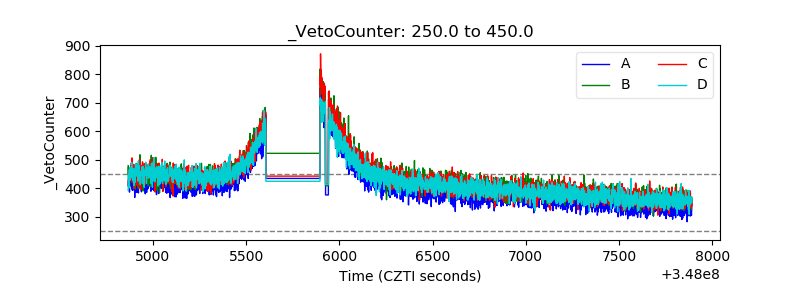 |