| Param | Original file | Final file |
|---|---|---|
| Filename | modeM0/AS1A10_045T06_9000004108cztM0_level2.fits | modeM0/AS1A10_045T06_9000004108cztM0_level2_quad_clean.evt |
| Size (bytes) | 1,977,721,920 | 1,511,760,960 |
| Size | 1.8 GB | 1.4 GB |
| Events in quadrant A | 12,306,034 | 8,423,608 |
| Events in quadrant B | 11,646,306 | 8,412,674 |
| Events in quadrant C | 12,074,530 | 8,129,632 |
| Events in quadrant D | 10,429,916 | 7,378,432 |
| Mode M9 | |||
|---|---|---|---|
| Quadrant | BADHDUFLAG | Total packets | Discarded packets |
| A | 0 | 309 | 0 |
| B | 0 | 309 | 0 |
| C | 0 | 309 | 0 |
| D | 0 | 309 | 0 |
| Mode M0 | |||
|---|---|---|---|
| Quadrant | BADHDUFLAG | Total packets | Discarded packets |
| A | 0 | 433557 | 0 |
| B | 0 | 442854 | 0 |
| C | 0 | 417618 | 0 |
| D | 0 | 591198 | 0 |
| Mode SS | |||
|---|---|---|---|
| Quadrant | BADHDUFLAG | Total packets | Discarded packets |
| A | 0 | 3998 | 0 |
| B | 0 | 3998 | 0 |
| C | 0 | 3998 | 0 |
| D | 0 | 3998 | 0 |
| Quadrant | Total seconds | Saturated seconds | Saturation percentage |
|---|---|---|---|
| A | 196128 | 2804 | 1.429679% |
| B | 196129 | 4468 | 2.278092% |
| C | 196129 | 4201 | 2.141958% |
| D | 196128 | 9786 | 4.989599% |
Noise dominated data is calculated using 1-second bins in cleaned event files. If a bin has >2000 counts, and if more than 50% of those come from <1% of pixels, then it is considered to be noise-dominated and hence unusable.
| Quadrant | # 1 sec bins | Bins with >0 counts | Bins with >2000 counts | High rate bins dominated by noise | Noise dominated (total time) | Noise dominated (detector-on time) | Marked lightcurve |
|---|---|---|---|---|---|---|---|
| A | 227225 | 196098 | 0 | 0 | 0.00% | 0.00% |  |
| B | 227225 | 195994 | 0 | 0 | 0.00% | 0.00% |  |
| C | 227225 | 196072 | 0 | 0 | 0.00% | 0.00% |  |
| D | 227225 | 195990 | 0 | 0 | 0.00% | 0.00% |  |
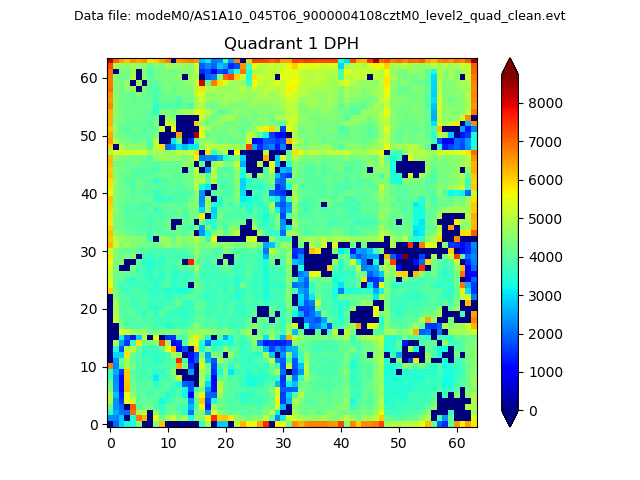
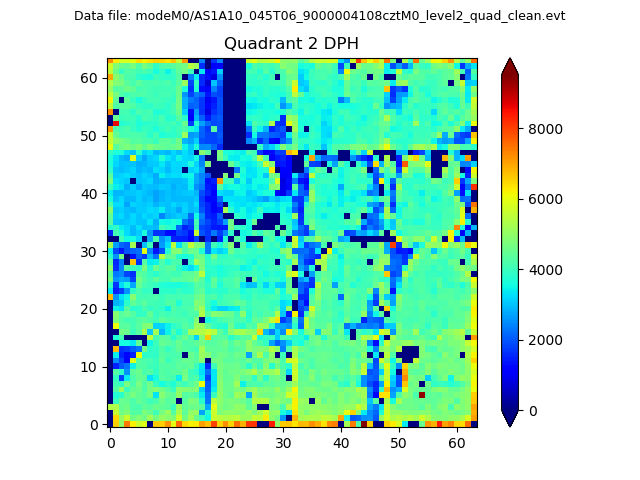
Top three noisy pixels from each quadrant. If the there are fewer than three noisy pixels in the level2.evt file, extra rows are filled as -1
| Pixel properties | Quadrant properties | ||||||
|---|---|---|---|---|---|---|---|
| Quadrant | DetID | PixID | Counts | Sigma | Mean | Median | Sigma |
| A | 0 | 29 | 11799 | 11.38 | 3206 | 3008 | 772.3 |
| A | 7 | 110 | 9738 | 8.71 | 3206 | 3008 | 772.3 |
| A | 0 | 30 | 9189 | 8.0 | 3206 | 3008 | 772.3 |
| B | 2 | 9 | 9301 | 10.73 | 3082 | 2943 | 592.7 |
| B | 5 | 128 | 7712 | 8.05 | 3082 | 2943 | 592.7 |
| B | 3 | 17 | 7681 | 7.99 | 3082 | 2943 | 592.7 |
| C | 1 | 80 | 9265 | 7.94 | 3188 | 2991 | 790.6 |
| C | 1 | 81 | 9220 | 7.88 | 3188 | 2991 | 790.6 |
| C | 12 | 241 | 8259 | 6.66 | 3188 | 2991 | 790.6 |
| D | 15 | 46 | 7458 | 6.05 | 2979 | 2724 | 781.9 |
| D | 7 | 3 | 7304 | 5.86 | 2979 | 2724 | 781.9 |
| D | 3 | 14 | 7201 | 5.73 | 2979 | 2724 | 781.9 |
Histogram calculated using DETX and DETY for each event in the final _common_clean file
| Quadrant A |  |
 |
Quadrant B |
|---|---|---|---|
| Quadrant D | 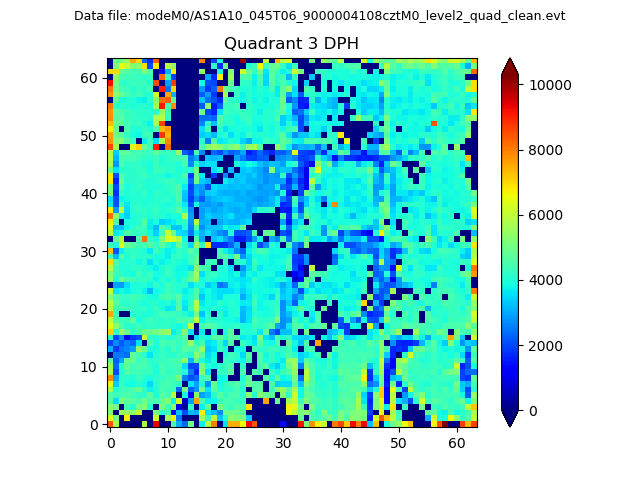 |
 |
Quadrant C |
| Plot type | Count rate plots | Images |
|---|---|---|
| Comparison with Poisson distribution Blue bars denote a histogram of data divided into 1 sec bins. Red curve is a Poisson curve with rate = median count rate of data. |
 |
 |
| Quadrant-wise count rates Data is divided into 100 sec bins |
 |
|
| Module-wise count rates for Quadrant A Data is divided into 100 sec bins |
 |
 |
| Module-wise count rates for Quadrant B Data is divided into 100 sec bins |
 |
 |
| Module-wise count rates for Quadrant C Data is divided into 100 sec bins |
 |
 |
| Module-wise count rates for Quadrant D Data is divided into 100 sec bins |
 |
 |
| Parameter | Plot |
|---|---|
| CZT HV Monitor |  |
| D_VDD |  |
| Temperature 1 | 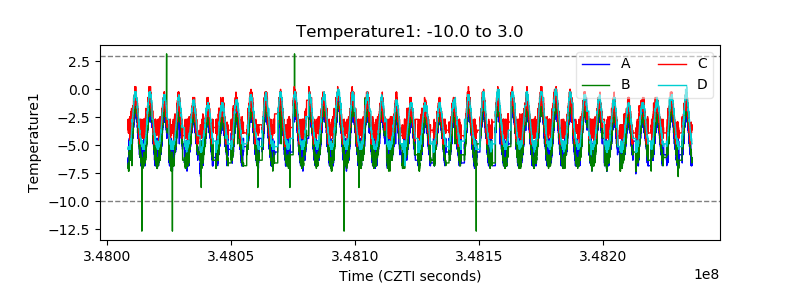 |
| Veto HV Monitor |  |
| Veto LLD | 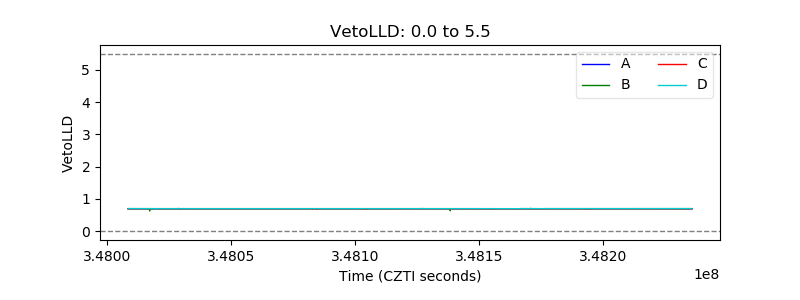 |
| Alpha Counter |  |
| _CPM_Rate |  |
| CZT Counter |  |
| +2.5 Volts monitor |  |
| +5 Volts monitor |  |
| _ROLL_ROT |  |
| _Roll_DEC |  |
| _Roll_RA |  |
| Veto Counter |  |