| Param | Original file | Final file |
|---|---|---|
| Filename | modeM0/AS1A10_045T06_9000004108_28593cztM0_level2.evt | modeM0/AS1A10_045T06_9000004108_28593cztM0_level2_quad_clean.evt |
| Size (bytes) | 386,444,160 | 61,269,120 |
| Size | 368.5 MB | 58.4 MB |
| Events in quadrant A | 2,474,565 | 381,639 |
| Events in quadrant B | 2,506,016 | 384,787 |
| Events in quadrant C | 2,461,749 | 374,395 |
| Events in quadrant D | 3,920,202 | 362,812 |
| Mode M9 | |||
|---|---|---|---|
| Quadrant | BADHDUFLAG | Total packets | Discarded packets |
| A | 0 | 3 | 0 |
| B | 0 | 3 | 0 |
| C | 0 | 3 | 0 |
| D | 0 | 3 | 0 |
| Mode M0 | |||
|---|---|---|---|
| Quadrant | BADHDUFLAG | Total packets | Discarded packets |
| A | 0 | 10540 | 1 |
| B | 0 | 10656 | 1 |
| C | 0 | 10487 | 2 |
| D | 0 | 15140 | 1 |
| Mode SS | |||
|---|---|---|---|
| Quadrant | BADHDUFLAG | Total packets | Discarded packets |
| A | 0 | 102 | 0 |
| B | 0 | 102 | 0 |
| C | 0 | 102 | 0 |
| D | 0 | 102 | 0 |
| Quadrant | Total seconds | Saturated seconds | Saturation percentage |
|---|---|---|---|
| A | 5012 | 56 | 1.117318% |
| B | 5012 | 96 | 1.915403% |
| C | 5011 | 119 | 2.374775% |
| D | 5011 | 358 | 7.144283% |
Noise dominated data is calculated using 1-second bins in cleaned event files. If a bin has >2000 counts, and if more than 50% of those come from <1% of pixels, then it is considered to be noise-dominated and hence unusable.
| Quadrant | # 1 sec bins | Bins with >0 counts | Bins with >2000 counts | High rate bins dominated by noise | Noise dominated (total time) | Noise dominated (detector-on time) | Marked lightcurve |
|---|---|---|---|---|---|---|---|
| A | 5272 | 5012 | 1 | 1 | 0.02% | 0.02% | 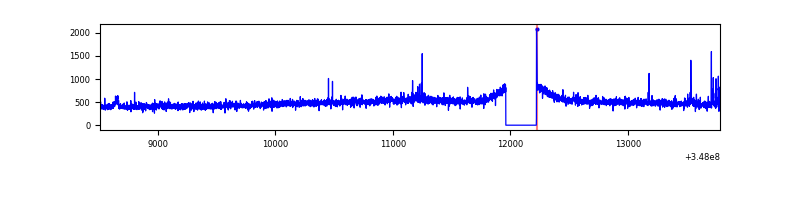 |
| B | 5272 | 5012 | 4 | 4 | 0.08% | 0.08% | 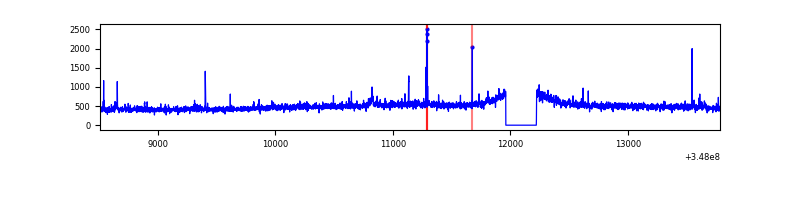 |
| C | 5271 | 5012 | 0 | 0 | 0.00% | 0.00% |  |
| D | 5271 | 5011 | 248 | 248 | 4.70% | 4.95% | 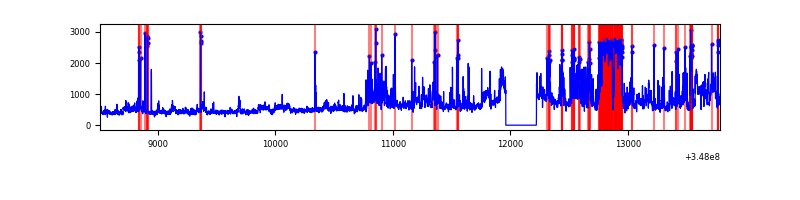 |
Top three noisy pixels from each quadrant. If the there are fewer than three noisy pixels in the level2.evt file, extra rows are filled as -1
| Pixel properties | Quadrant properties | ||||||
|---|---|---|---|---|---|---|---|
| Quadrant | DetID | PixID | Counts | Sigma | Mean | Median | Sigma |
| A | 15 | 174 | 40636 | 311.7 | 628 | 614 | 128.4 |
| A | 13 | 254 | 8327 | 60.07 | 628 | 614 | 128.4 |
| A | 8 | 192 | 6736 | 47.68 | 628 | 614 | 128.4 |
| B | 10 | 245 | 27011 | 220.33 | 619 | 604 | 119.9 |
| B | 5 | 255 | 21464 | 174.05 | 619 | 604 | 119.9 |
| B | 12 | 111 | 15002 | 120.13 | 619 | 604 | 119.9 |
| C | 14 | 238 | 96744 | 677.96 | 601 | 605 | 141.8 |
| C | 7 | 247 | 12287 | 82.38 | 601 | 605 | 141.8 |
| C | 0 | 207 | 7429 | 48.12 | 601 | 605 | 141.8 |
| D | 8 | 195 | 614298 | 4269.16 | 592 | 575 | 143.8 |
| D | 12 | 233 | 535184 | 3718.83 | 592 | 575 | 143.8 |
| D | 1 | 52 | 408758 | 2839.39 | 592 | 575 | 143.8 |
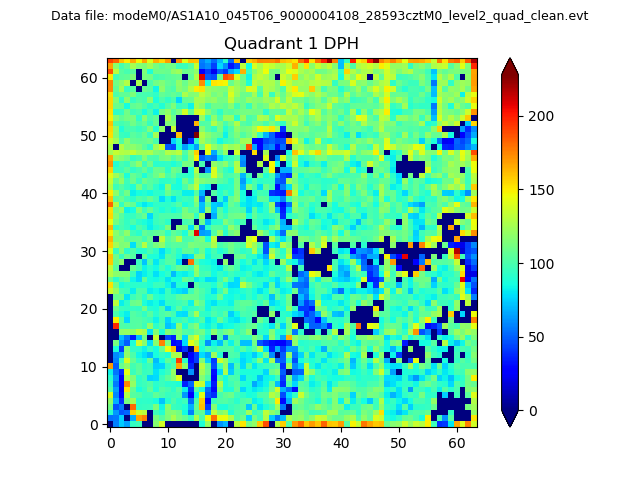
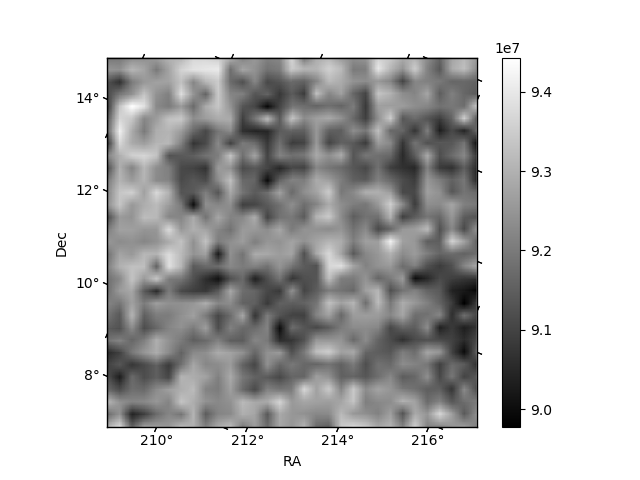
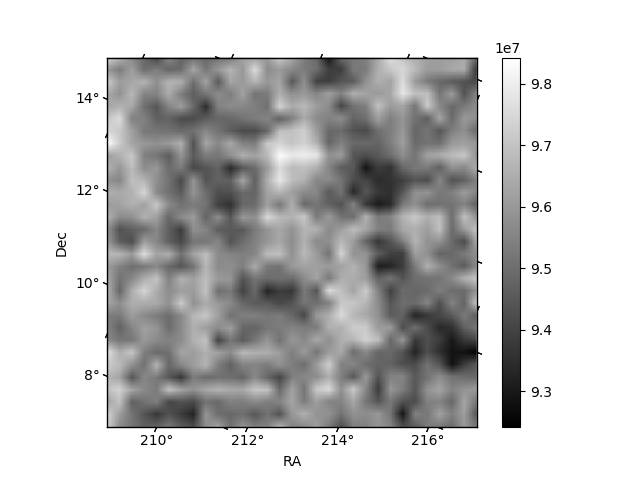
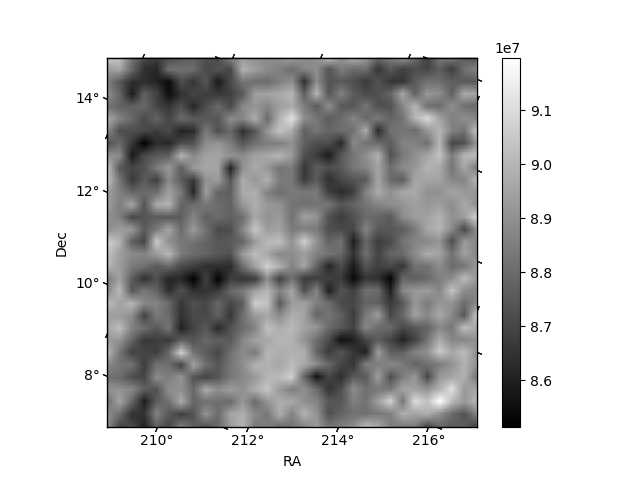
Histogram calculated using DETX and DETY for each event in the final _common_clean file
| Quadrant A | 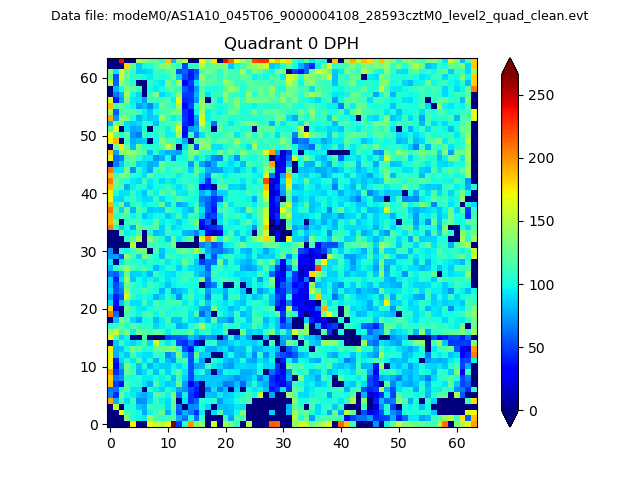 |
 |
Quadrant B |
|---|---|---|---|
| Quadrant D | 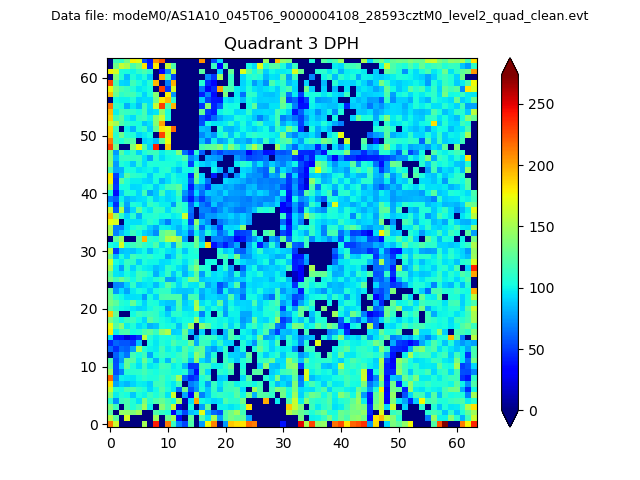 |
 |
Quadrant C |
| Plot type | Count rate plots | Images |
|---|---|---|
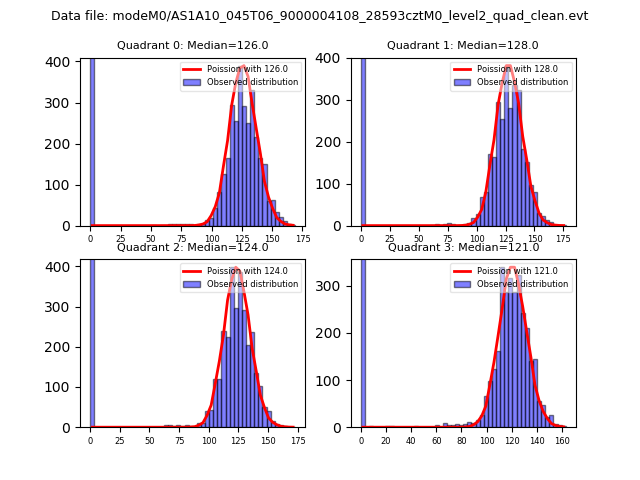
| Comparison with Poisson distribution Blue bars denote a histogram of data divided into 1 sec bins. Red curve is a Poisson curve with rate = median count rate of data. |
 |
 |
| Quadrant-wise count rates Data is divided into 100 sec bins |
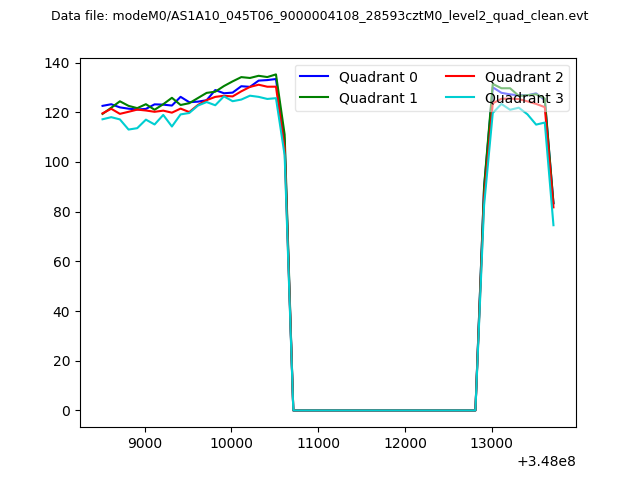 |
|
| Module-wise count rates for Quadrant A Data is divided into 100 sec bins |
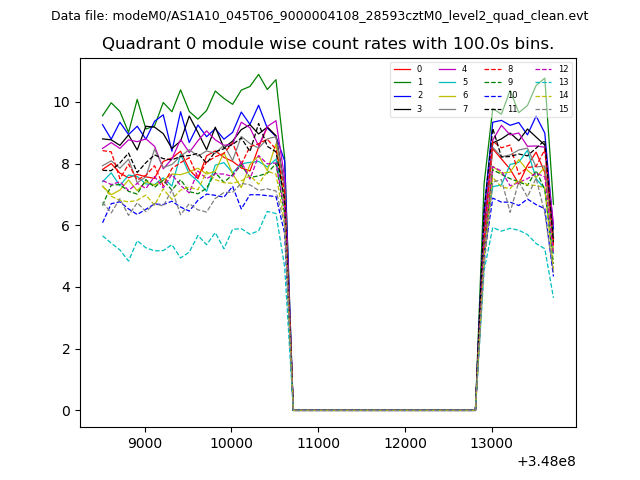 |
 |
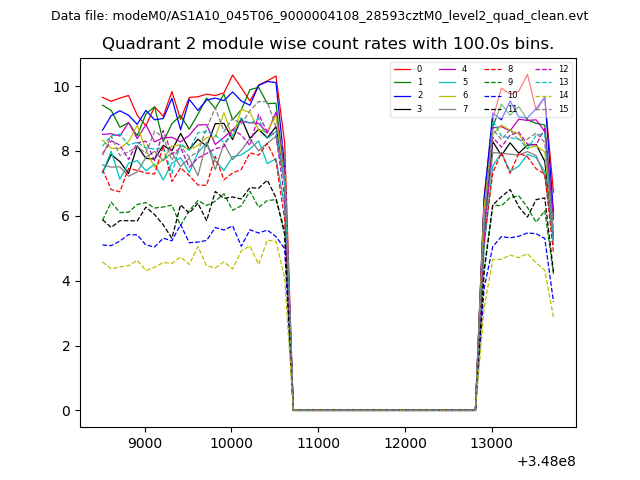
| Module-wise count rates for Quadrant B Data is divided into 100 sec bins |
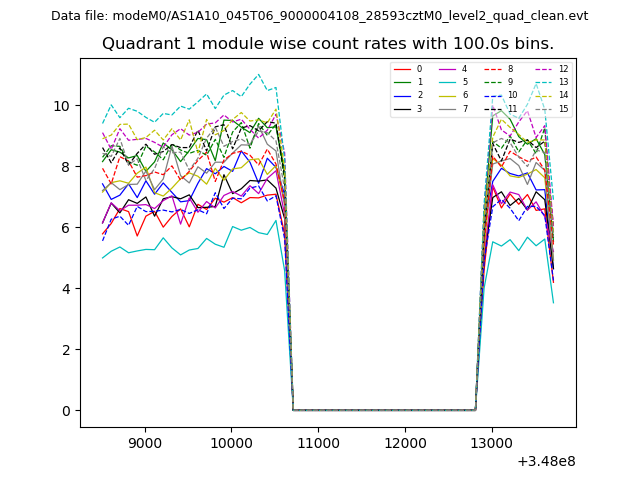 |
 |
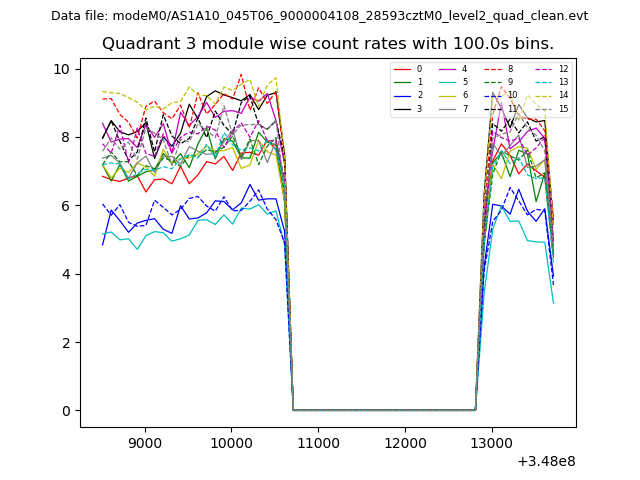
| Module-wise count rates for Quadrant C Data is divided into 100 sec bins |
 |
 |
| Module-wise count rates for Quadrant D Data is divided into 100 sec bins |
 |
 |
| Parameter | Plot |
|---|---|
| CZT HV Monitor | 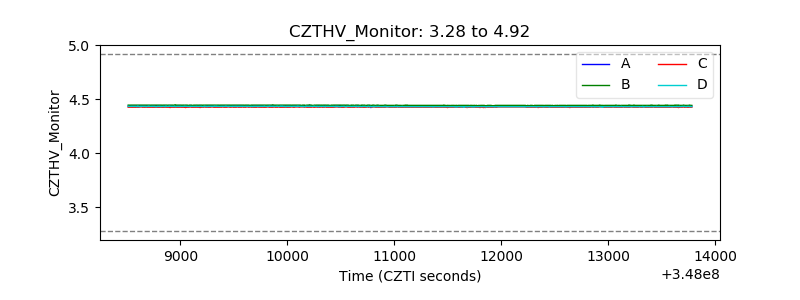 |
| D_VDD | 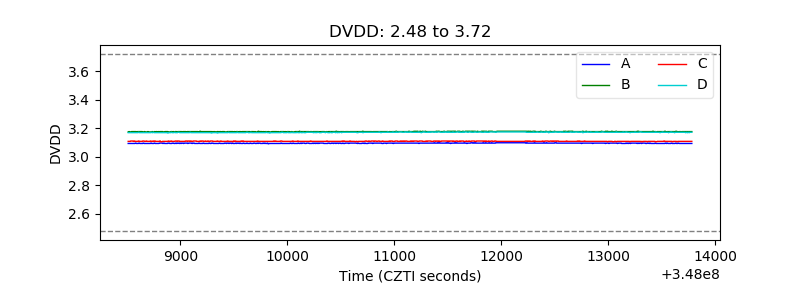 |
| Temperature 1 | 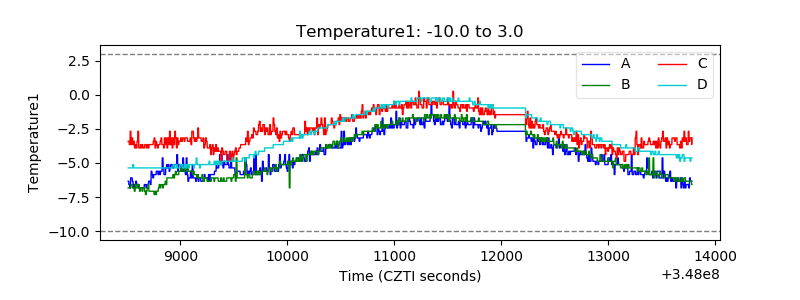 |
| Veto HV Monitor | 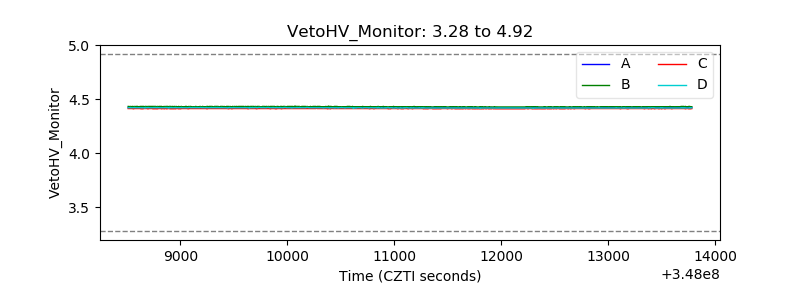 |
| Veto LLD | 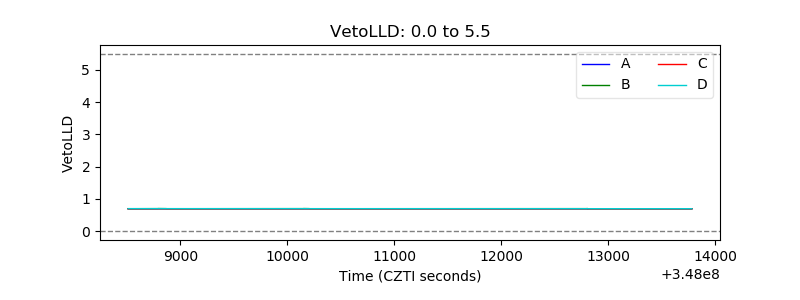 |
| Alpha Counter | 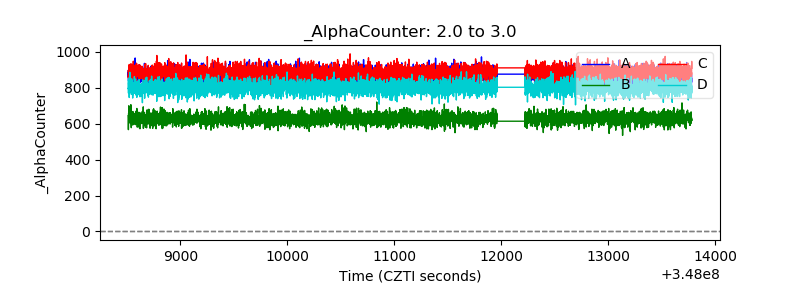 |
| _CPM_Rate | 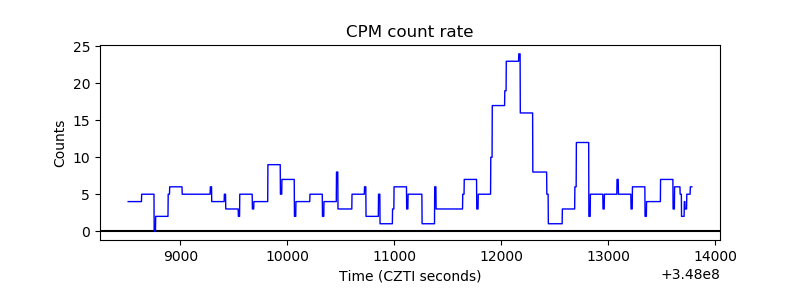 |
| CZT Counter | 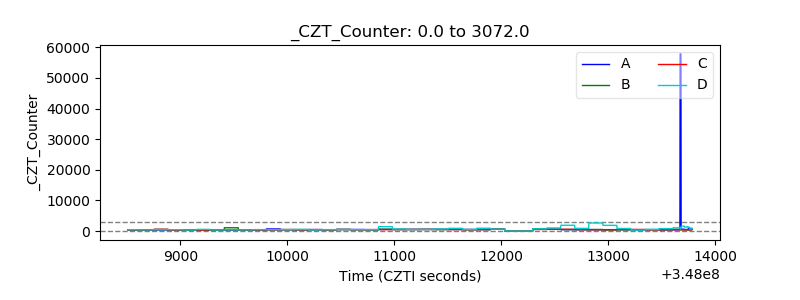 |
| +2.5 Volts monitor |  |
| +5 Volts monitor |  |
| _ROLL_ROT | 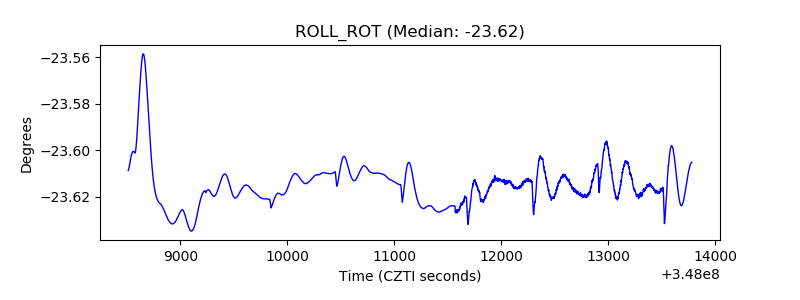 |
| _Roll_DEC | 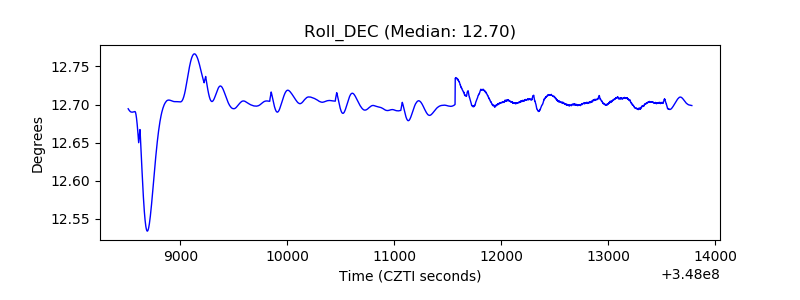 |
| _Roll_RA | 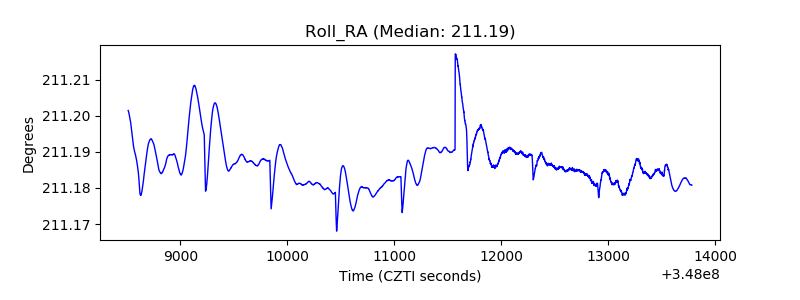 |
| Veto Counter | 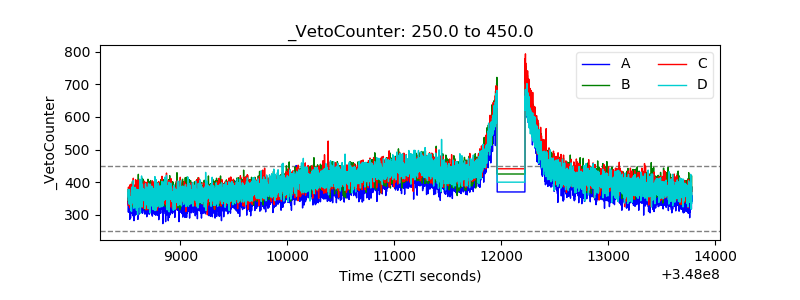 |