| Param | Original file | Final file |
|---|---|---|
| Filename | modeM0/AS1A10_045T06_9000004108_28596cztM0_level2.evt | modeM0/AS1A10_045T06_9000004108_28596cztM0_level2_quad_clean.evt |
| Size (bytes) | 435,939,840 | 70,128,000 |
| Size | 415.7 MB | 66.9 MB |
| Events in quadrant A | 2,725,383 | 442,946 |
| Events in quadrant B | 2,808,125 | 447,756 |
| Events in quadrant C | 2,675,805 | 433,743 |
| Events in quadrant D | 4,614,502 | 409,293 |
| Mode M9 | |||
|---|---|---|---|
| Quadrant | BADHDUFLAG | Total packets | Discarded packets |
| A | 0 | 3 | 0 |
| B | 0 | 3 | 0 |
| C | 0 | 3 | 0 |
| D | 0 | 3 | 0 |
| Mode M0 | |||
|---|---|---|---|
| Quadrant | BADHDUFLAG | Total packets | Discarded packets |
| A | 0 | 11805 | 1 |
| B | 0 | 12082 | 1 |
| C | 0 | 11632 | 1 |
| D | 0 | 17582 | 1 |
| Mode SS | |||
|---|---|---|---|
| Quadrant | BADHDUFLAG | Total packets | Discarded packets |
| A | 0 | 112 | 0 |
| B | 0 | 112 | 0 |
| C | 0 | 112 | 0 |
| D | 0 | 112 | 0 |
| Quadrant | Total seconds | Saturated seconds | Saturation percentage |
|---|---|---|---|
| A | 5574 | 67 | 1.202009% |
| B | 5574 | 121 | 2.170793% |
| C | 5574 | 118 | 2.116972% |
| D | 5575 | 510 | 9.147982% |
Noise dominated data is calculated using 1-second bins in cleaned event files. If a bin has >2000 counts, and if more than 50% of those come from <1% of pixels, then it is considered to be noise-dominated and hence unusable.
| Quadrant | # 1 sec bins | Bins with >0 counts | Bins with >2000 counts | High rate bins dominated by noise | Noise dominated (total time) | Noise dominated (detector-on time) | Marked lightcurve |
|---|---|---|---|---|---|---|---|
| A | 5834 | 5574 | 9 | 9 | 0.15% | 0.16% |  |
| B | 5834 | 5574 | 12 | 12 | 0.21% | 0.22% | 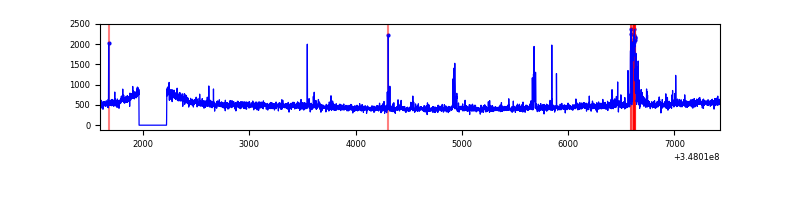 |
| C | 5834 | 5575 | 1 | 1 | 0.02% | 0.02% | 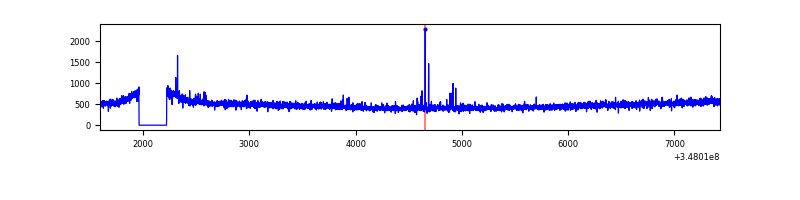 |
| D | 5835 | 5575 | 392 | 392 | 6.72% | 7.03% | 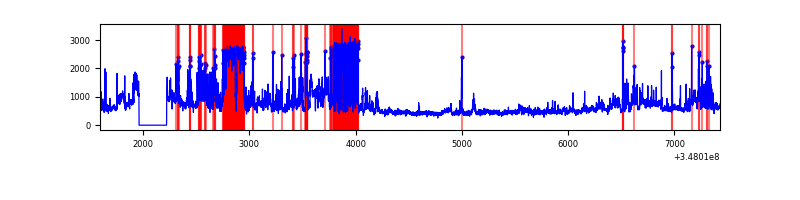 |
Top three noisy pixels from each quadrant. If the there are fewer than three noisy pixels in the level2.evt file, extra rows are filled as -1
| Pixel properties | Quadrant properties | ||||||
|---|---|---|---|---|---|---|---|
| Quadrant | DetID | PixID | Counts | Sigma | Mean | Median | Sigma |
| A | 15 | 174 | 85866 | 617.65 | 677 | 663 | 137.9 |
| A | 1 | 113 | 13383 | 92.21 | 677 | 663 | 137.9 |
| A | 13 | 254 | 10110 | 68.48 | 677 | 663 | 137.9 |
| B | 4 | 171 | 82322 | 634.52 | 669 | 652 | 128.7 |
| B | 5 | 255 | 42609 | 325.98 | 669 | 652 | 128.7 |
| B | 10 | 245 | 33759 | 257.22 | 669 | 652 | 128.7 |
| C | 14 | 238 | 105057 | 675.83 | 650 | 654 | 154.5 |
| C | 7 | 247 | 24637 | 155.25 | 650 | 654 | 154.5 |
| C | 0 | 207 | 7495 | 44.28 | 650 | 654 | 154.5 |
| D | 1 | 52 | 984074 | 6438.73 | 630 | 613 | 152.7 |
| D | 8 | 195 | 663299 | 4338.61 | 630 | 613 | 152.7 |
| D | 12 | 233 | 475743 | 3110.68 | 630 | 613 | 152.7 |
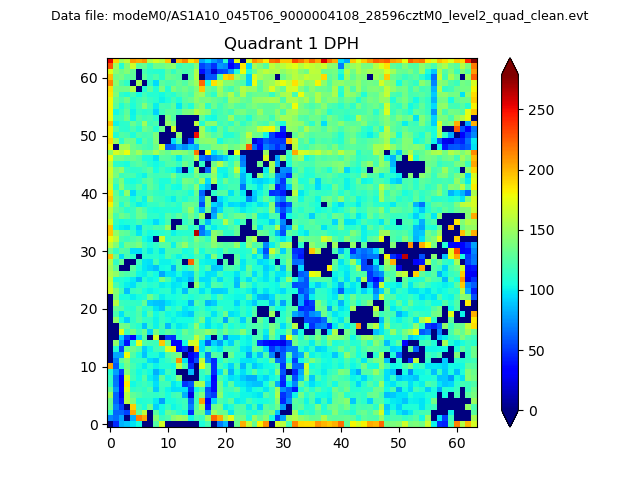
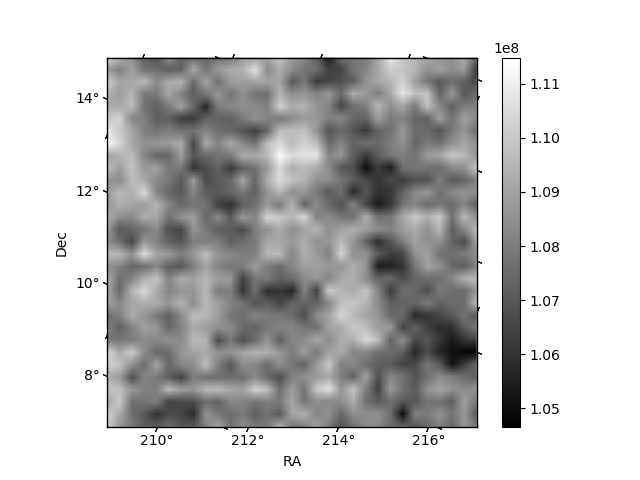
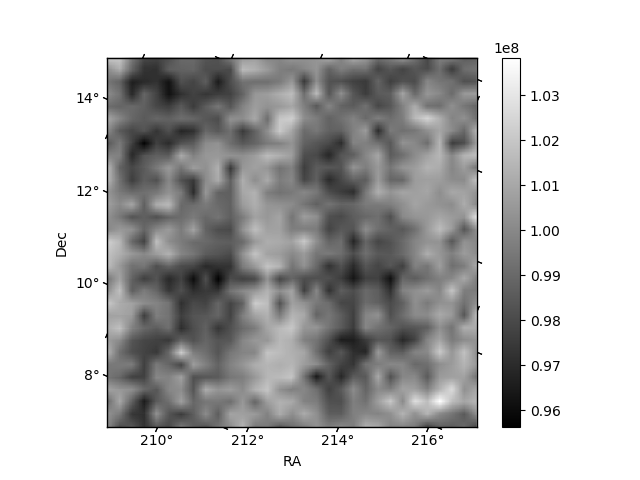
Histogram calculated using DETX and DETY for each event in the final _common_clean file
| Quadrant A | 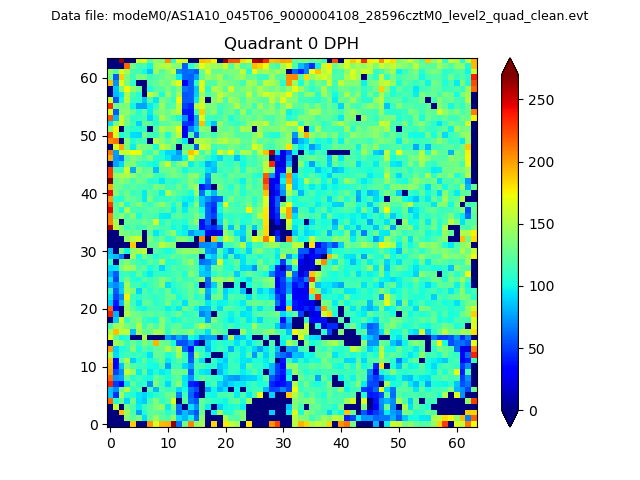 |
 |
Quadrant B |
|---|---|---|---|
| Quadrant D | 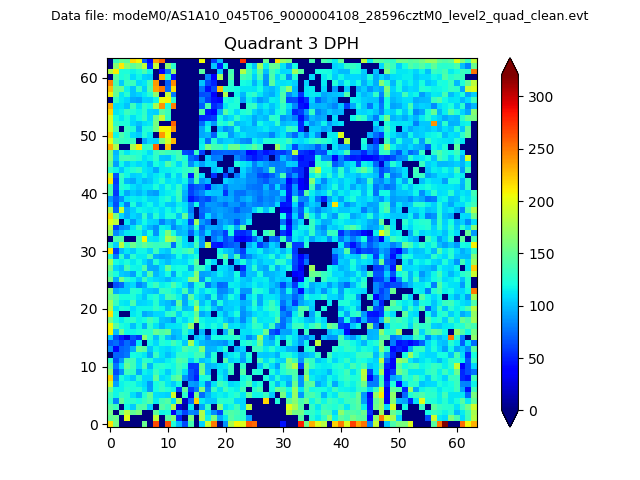 |
 |
Quadrant C |
| Plot type | Count rate plots | Images |
|---|---|---|
| Comparison with Poisson distribution Blue bars denote a histogram of data divided into 1 sec bins. Red curve is a Poisson curve with rate = median count rate of data. |
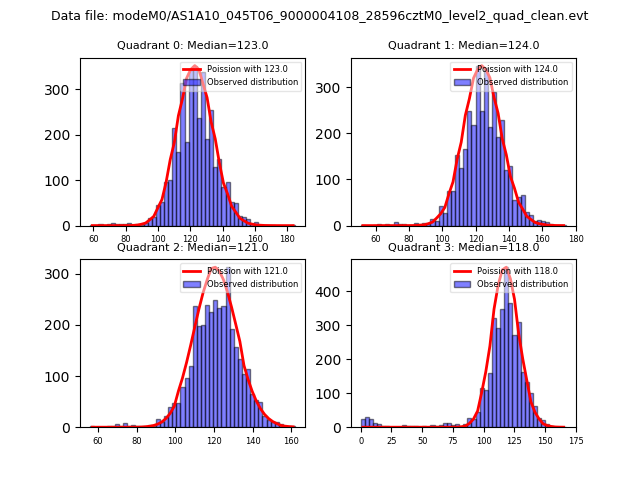 |
 |
| Quadrant-wise count rates Data is divided into 100 sec bins |
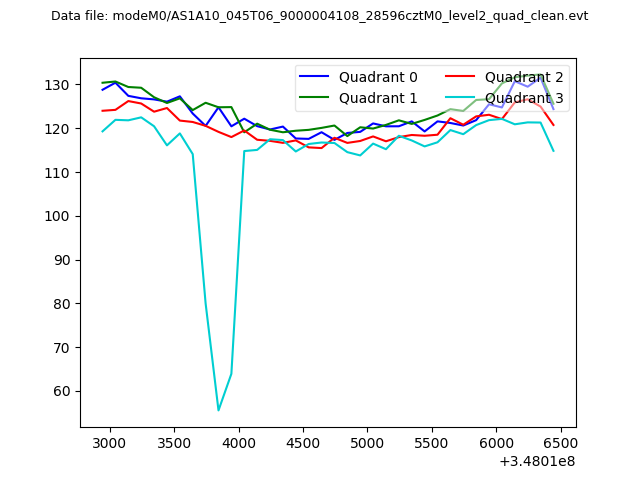 |
|
| Module-wise count rates for Quadrant A Data is divided into 100 sec bins |
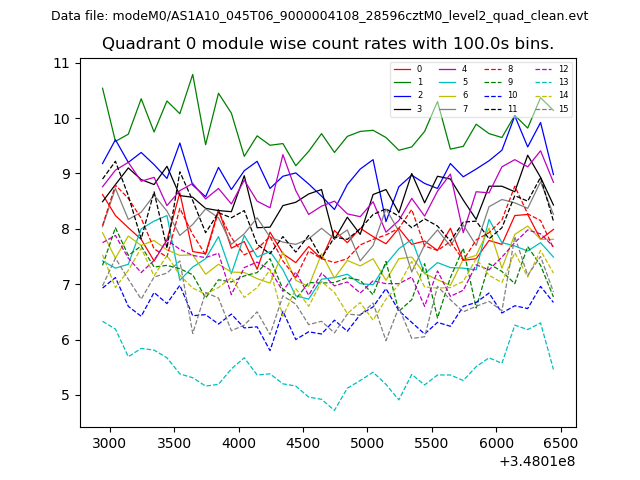 |
 |
| Module-wise count rates for Quadrant B Data is divided into 100 sec bins |
 |
 |
| Module-wise count rates for Quadrant C Data is divided into 100 sec bins |
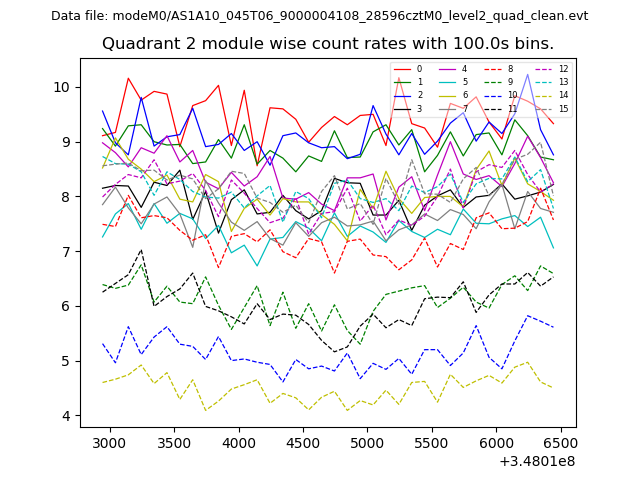 |
 |
| Module-wise count rates for Quadrant D Data is divided into 100 sec bins |
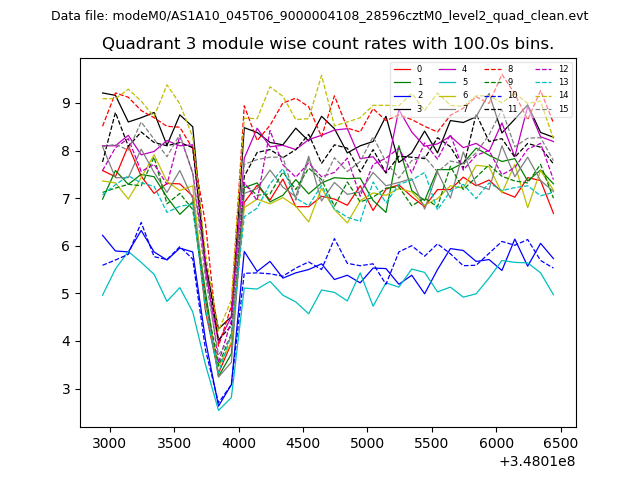 |
 |
| Parameter | Plot |
|---|---|
| CZT HV Monitor | 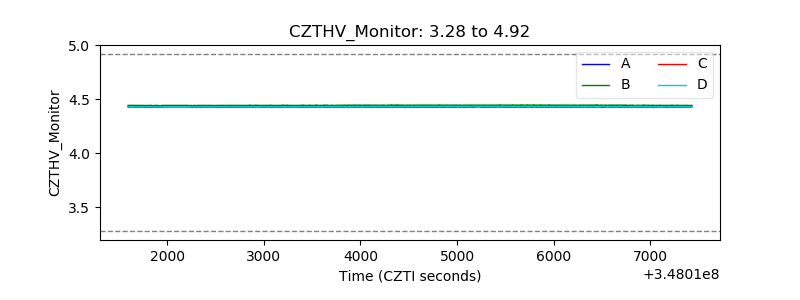 |
| D_VDD | 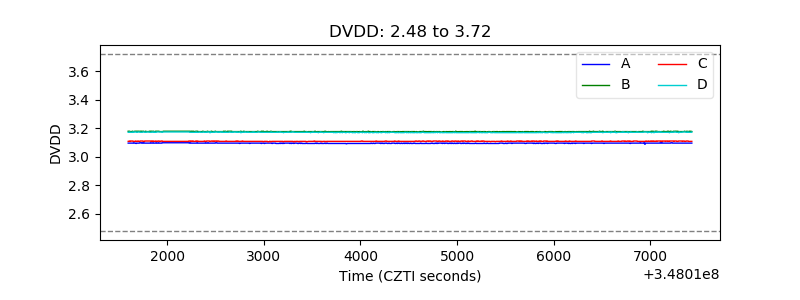 |
| Temperature 1 | 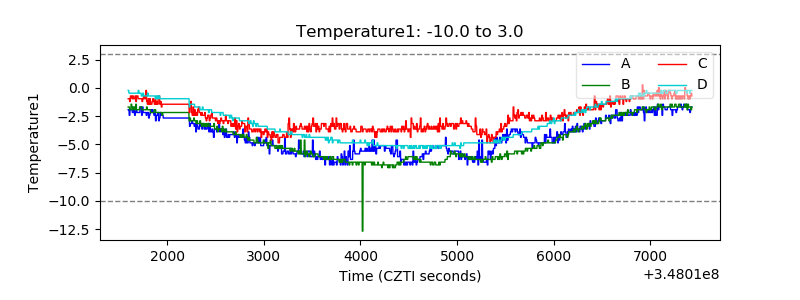 |
| Veto HV Monitor | 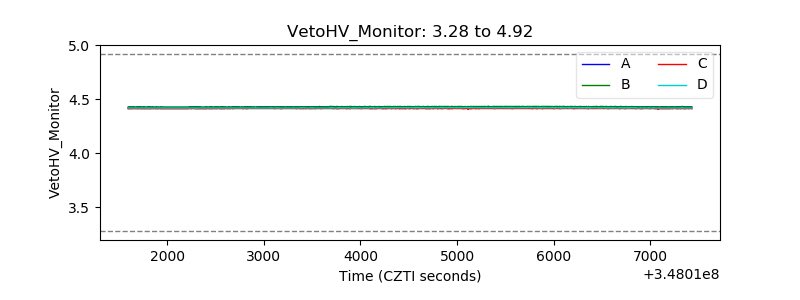 |
| Veto LLD | 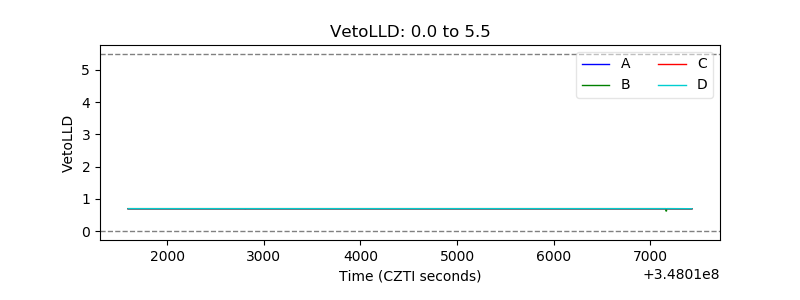 |
| Alpha Counter | 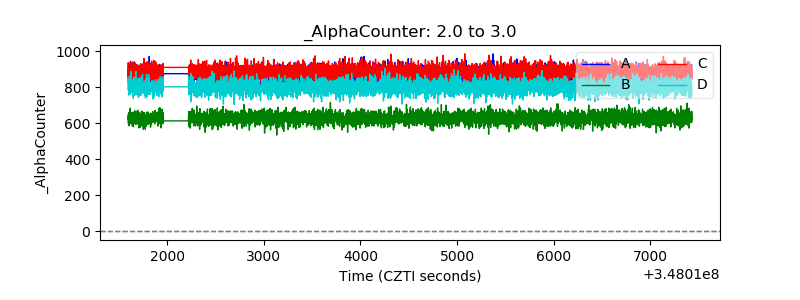 |
| _CPM_Rate | 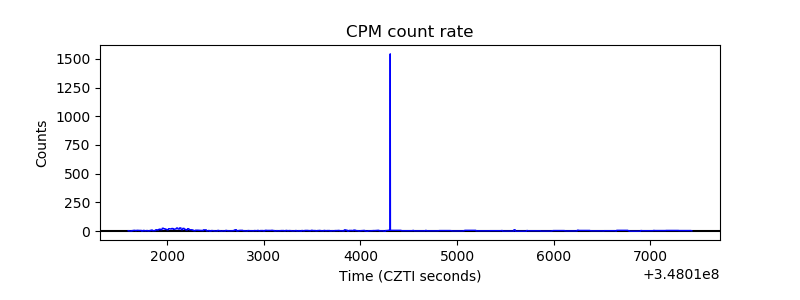 |
| CZT Counter |  |
| +2.5 Volts monitor |  |
| +5 Volts monitor |  |
| _ROLL_ROT | 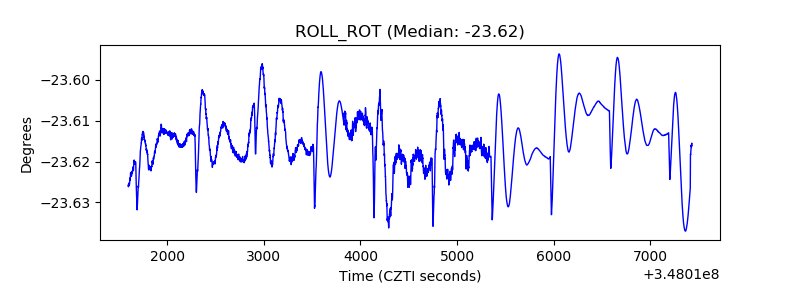 |
| _Roll_DEC | 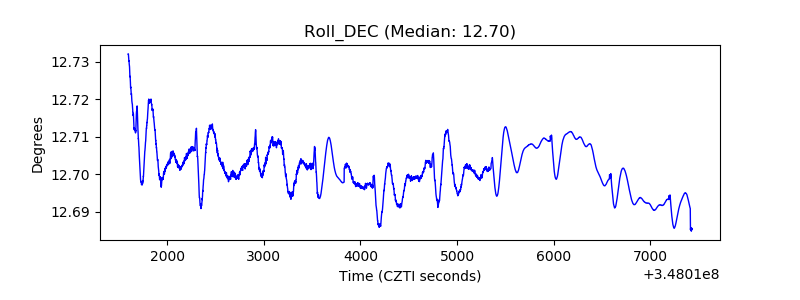 |
| _Roll_RA |  |
| Veto Counter | 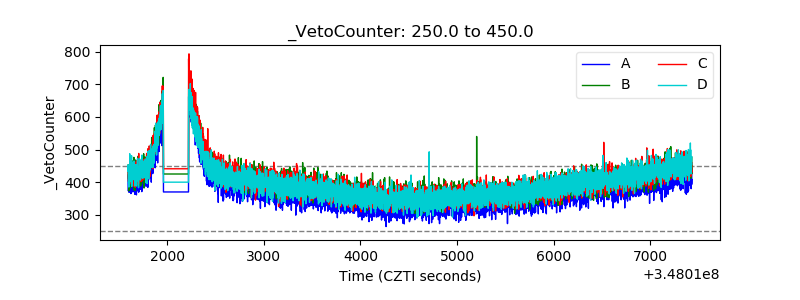 |