| Param | Original file | Final file |
|---|---|---|
| Filename | modeM0/AS1A10_045T06_9000004108_28597cztM0_level2.evt | modeM0/AS1A10_045T06_9000004108_28597cztM0_level2_quad_clean.evt |
| Size (bytes) | 1,507,219,200 | 235,347,840 |
| Size | 1.4 GB | 224.4 MB |
| Events in quadrant A | 10,162,591 | 1,449,596 |
| Events in quadrant B | 11,644,601 | 1,469,923 |
| Events in quadrant C | 9,621,111 | 1,437,559 |
| Events in quadrant D | 12,877,863 | 1,403,407 |
| Mode M9 | |||
|---|---|---|---|
| Quadrant | BADHDUFLAG | Total packets | Discarded packets |
| A | 0 | 28 | 0 |
| B | 0 | 28 | 0 |
| C | 0 | 28 | 0 |
| D | 0 | 28 | 0 |
| Mode M0 | |||
|---|---|---|---|
| Quadrant | BADHDUFLAG | Total packets | Discarded packets |
| A | 0 | 43473 | 4 |
| B | 0 | 47669 | 4 |
| C | 0 | 41333 | 4 |
| D | 0 | 52143 | 4 |
| Mode SS | |||
|---|---|---|---|
| Quadrant | BADHDUFLAG | Total packets | Discarded packets |
| A | 0 | 404 | 0 |
| B | 0 | 404 | 0 |
| C | 0 | 404 | 0 |
| D | 0 | 404 | 0 |
| Quadrant | Total seconds | Saturated seconds | Saturation percentage |
|---|---|---|---|
| A | 19857 | 262 | 1.319434% |
| B | 19858 | 711 | 3.580421% |
| C | 19858 | 300 | 1.510726% |
| D | 19857 | 334 | 1.682026% |
Noise dominated data is calculated using 1-second bins in cleaned event files. If a bin has >2000 counts, and if more than 50% of those come from <1% of pixels, then it is considered to be noise-dominated and hence unusable.
| Quadrant | # 1 sec bins | Bins with >0 counts | Bins with >2000 counts | High rate bins dominated by noise | Noise dominated (total time) | Noise dominated (detector-on time) | Marked lightcurve |
|---|---|---|---|---|---|---|---|
| A | 22592 | 19858 | 73 | 73 | 0.32% | 0.37% | 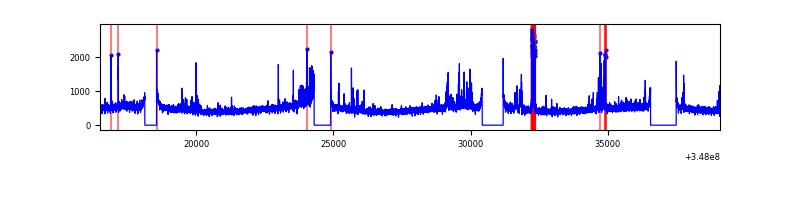 |
| B | 22593 | 19859 | 317 | 317 | 1.40% | 1.60% | 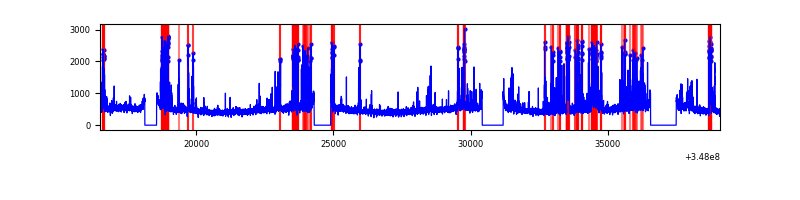 |
| C | 22593 | 19859 | 3 | 3 | 0.01% | 0.02% | 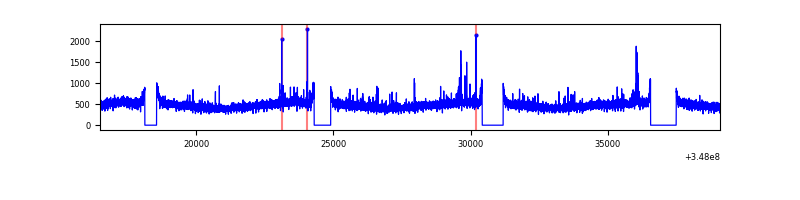 |
| D | 22592 | 19858 | 191 | 191 | 0.85% | 0.96% | 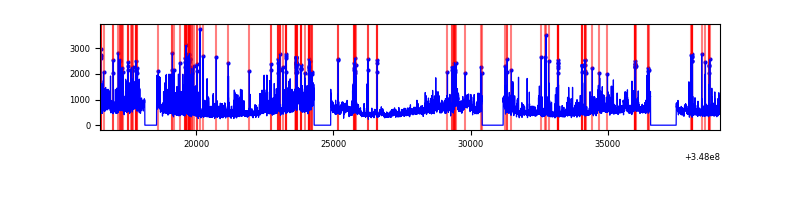 |
Top three noisy pixels from each quadrant. If the there are fewer than three noisy pixels in the level2.evt file, extra rows are filled as -1
| Pixel properties | Quadrant properties | ||||||
|---|---|---|---|---|---|---|---|
| Quadrant | DetID | PixID | Counts | Sigma | Mean | Median | Sigma |
| A | 15 | 174 | 660671 | 1359.86 | 2418 | 2370 | 484.1 |
| A | 12 | 16 | 121357 | 245.79 | 2418 | 2370 | 484.1 |
| A | 12 | 194 | 38262 | 74.14 | 2418 | 2370 | 484.1 |
| B | 10 | 245 | 2008497 | 4398.04 | 2389 | 2325 | 456.2 |
| B | 10 | 247 | 98107 | 209.98 | 2389 | 2325 | 456.2 |
| B | 4 | 171 | 71947 | 152.63 | 2389 | 2325 | 456.2 |
| C | 14 | 238 | 392377 | 715.64 | 2326 | 2342 | 545.0 |
| C | 7 | 247 | 114409 | 205.62 | 2326 | 2342 | 545.0 |
| C | 14 | 254 | 32793 | 55.87 | 2326 | 2342 | 545.0 |
| D | 1 | 52 | 1839404 | 3262.63 | 2345 | 2285 | 563.1 |
| D | 8 | 195 | 1807772 | 3206.45 | 2345 | 2285 | 563.1 |
| D | 2 | 250 | 257023 | 452.4 | 2345 | 2285 | 563.1 |
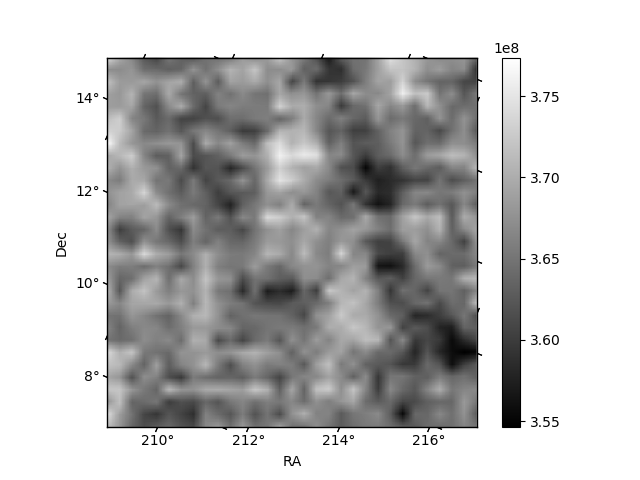
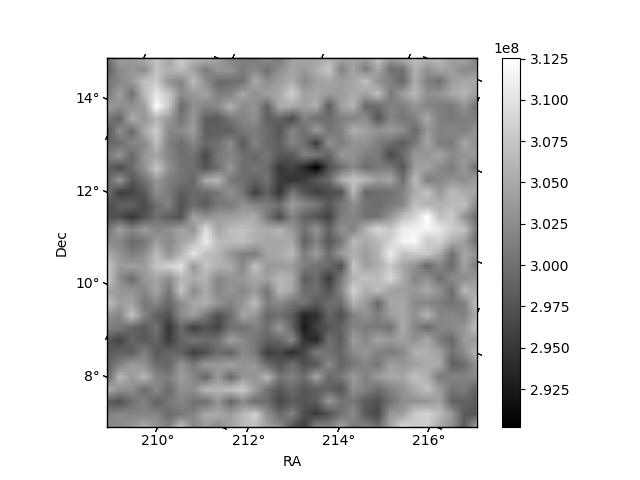
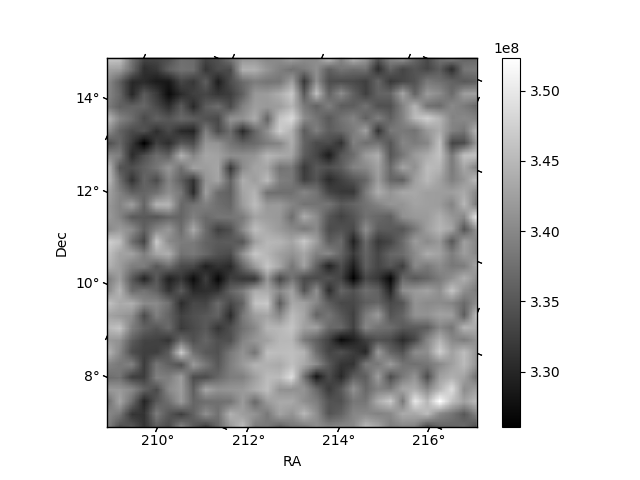
Histogram calculated using DETX and DETY for each event in the final _common_clean file
| Quadrant A |  |
 |
Quadrant B |
|---|---|---|---|
| Quadrant D |  |
 |
Quadrant C |
| Plot type | Count rate plots | Images |
|---|---|---|
| Comparison with Poisson distribution Blue bars denote a histogram of data divided into 1 sec bins. Red curve is a Poisson curve with rate = median count rate of data. |
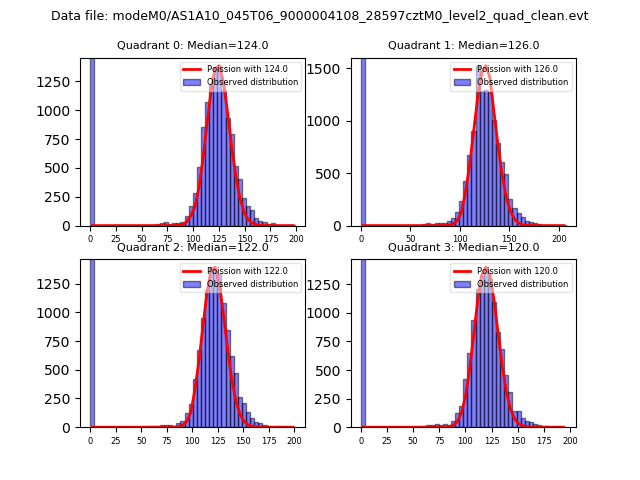 |
 |
| Quadrant-wise count rates Data is divided into 100 sec bins |
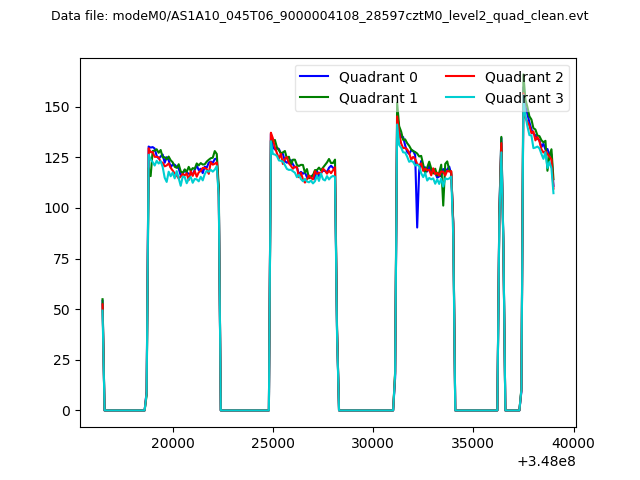 |
|
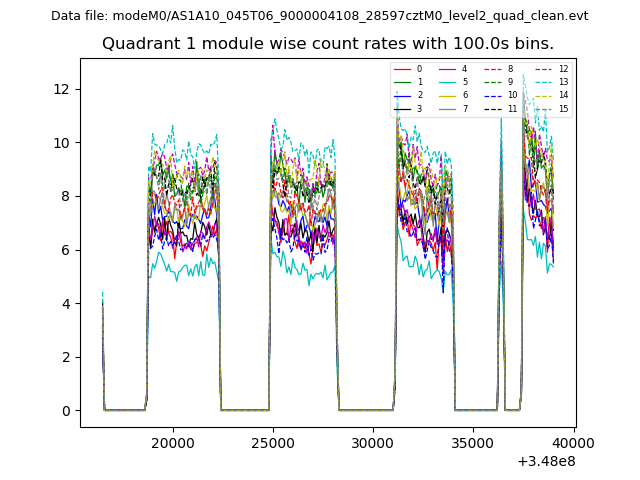
| Module-wise count rates for Quadrant A Data is divided into 100 sec bins |
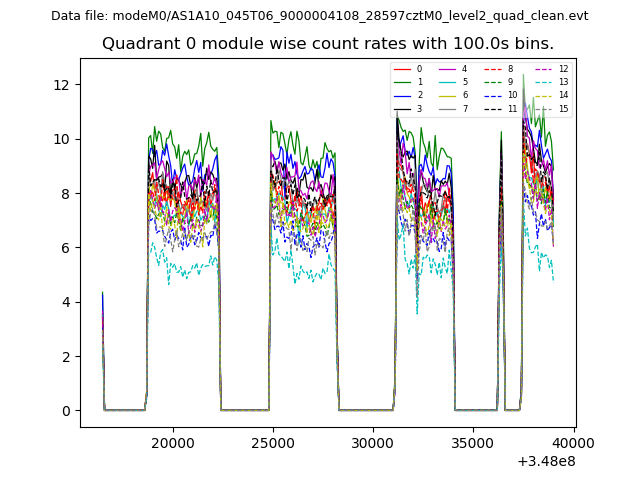 |
 |
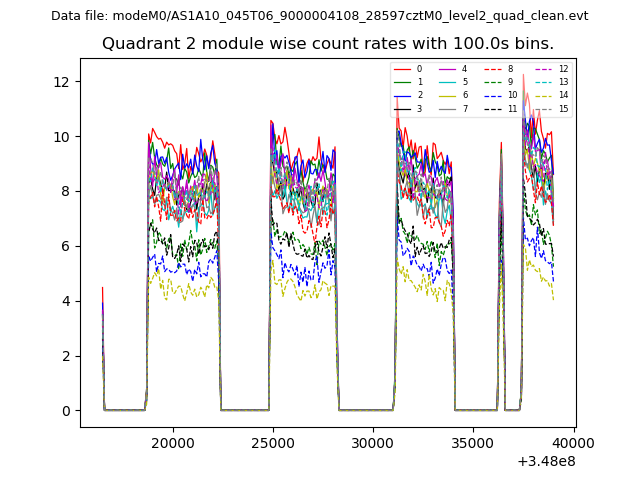
| Module-wise count rates for Quadrant B Data is divided into 100 sec bins |
 |
 |
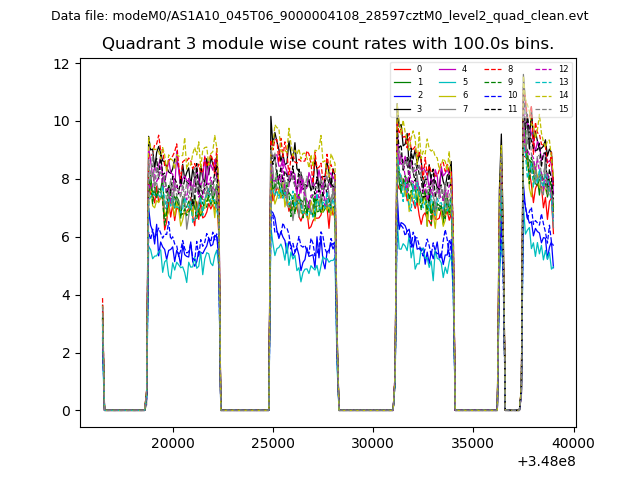
| Module-wise count rates for Quadrant C Data is divided into 100 sec bins |
 |
 |
| Module-wise count rates for Quadrant D Data is divided into 100 sec bins |
 |
 |
| Parameter | Plot |
|---|---|
| CZT HV Monitor | 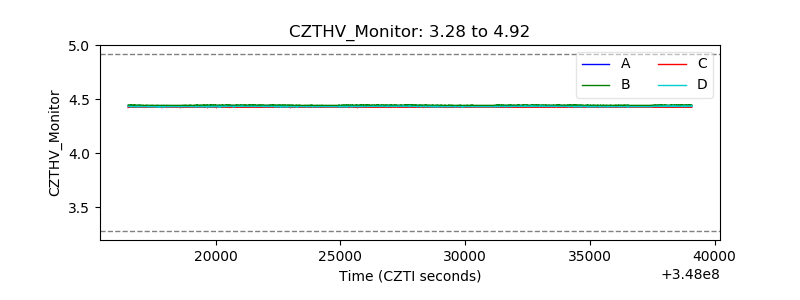 |
| D_VDD | 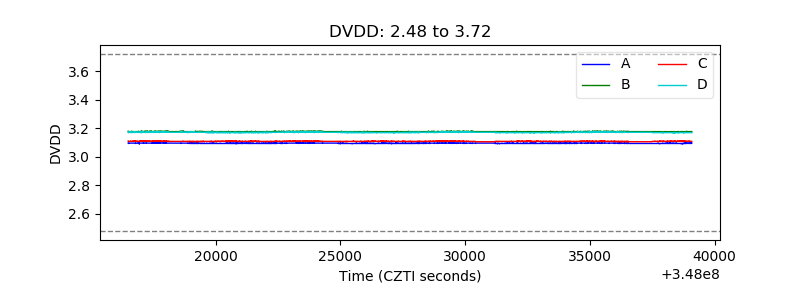 |
| Temperature 1 |  |
| Veto HV Monitor |  |
| Veto LLD |  |
| Alpha Counter | 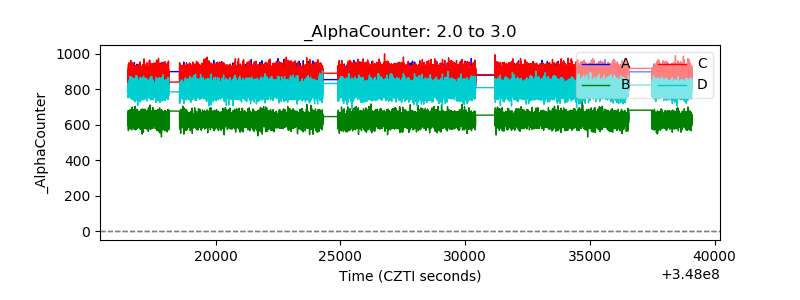 |
| _CPM_Rate | 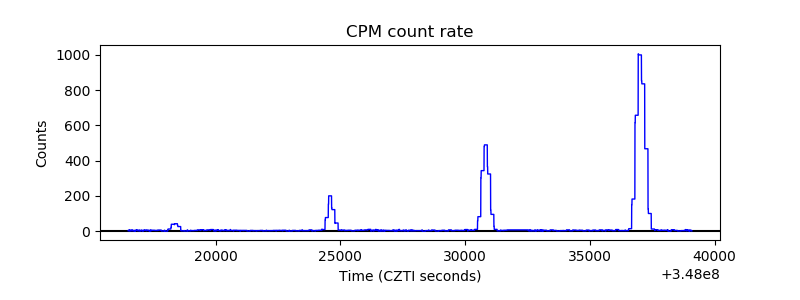 |
| CZT Counter |  |
| +2.5 Volts monitor |  |
| +5 Volts monitor |  |
| _ROLL_ROT | 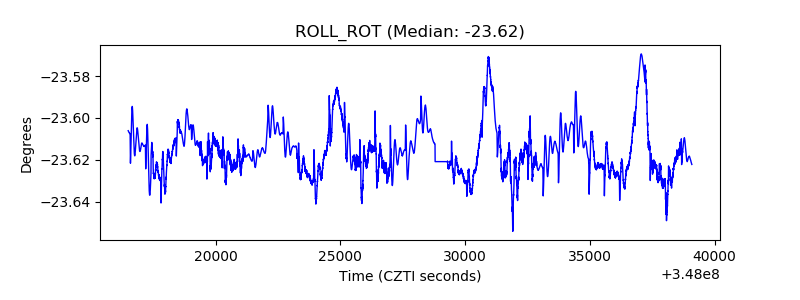 |
| _Roll_DEC |  |
| _Roll_RA |  |
| Veto Counter | 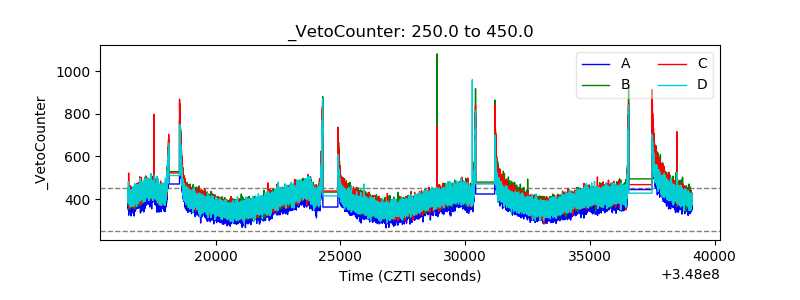 |