| Param | Original file | Final file |
|---|---|---|
| Filename | modeM0/AS1A10_045T06_9000004108_28598cztM0_level2.evt | modeM0/AS1A10_045T06_9000004108_28598cztM0_level2_quad_clean.evt |
| Size (bytes) | 467,429,760 | 85,178,880 |
| Size | 445.8 MB | 81.2 MB |
| Events in quadrant A | 3,086,255 | 543,521 |
| Events in quadrant B | 3,203,409 | 553,504 |
| Events in quadrant C | 3,004,106 | 536,364 |
| Events in quadrant D | 4,441,706 | 513,548 |
| Mode M9 | |||
|---|---|---|---|
| Quadrant | BADHDUFLAG | Total packets | Discarded packets |
| A | 0 | 10 | 0 |
| B | 0 | 10 | 0 |
| C | 0 | 10 | 0 |
| D | 0 | 10 | 0 |
| Mode M0 | |||
|---|---|---|---|
| Quadrant | BADHDUFLAG | Total packets | Discarded packets |
| A | 0 | 13038 | 1 |
| B | 0 | 13392 | 1 |
| C | 0 | 12706 | 1 |
| D | 0 | 17332 | 1 |
| Mode SS | |||
|---|---|---|---|
| Quadrant | BADHDUFLAG | Total packets | Discarded packets |
| A | 0 | 126 | 0 |
| B | 0 | 126 | 0 |
| C | 0 | 126 | 0 |
| D | 0 | 126 | 0 |
| Quadrant | Total seconds | Saturated seconds | Saturation percentage |
|---|---|---|---|
| A | 6194 | 46 | 0.742654% |
| B | 6195 | 77 | 1.242938% |
| C | 6195 | 75 | 1.210654% |
| D | 6194 | 218 | 3.519535% |
Noise dominated data is calculated using 1-second bins in cleaned event files. If a bin has >2000 counts, and if more than 50% of those come from <1% of pixels, then it is considered to be noise-dominated and hence unusable.
| Quadrant | # 1 sec bins | Bins with >0 counts | Bins with >2000 counts | High rate bins dominated by noise | Noise dominated (total time) | Noise dominated (detector-on time) | Marked lightcurve |
|---|---|---|---|---|---|---|---|
| A | 7249 | 6194 | 5 | 5 | 0.07% | 0.08% |  |
| B | 7250 | 6195 | 25 | 25 | 0.34% | 0.40% |  |
| C | 7250 | 6195 | 0 | 0 | 0.00% | 0.00% | 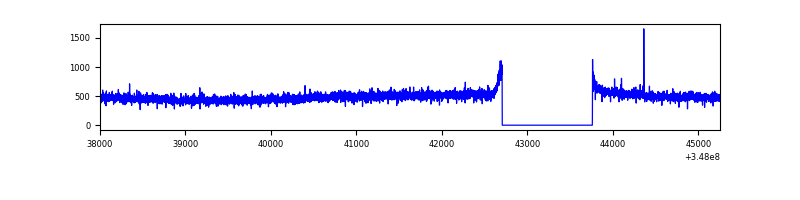 |
| D | 7249 | 6194 | 175 | 175 | 2.41% | 2.83% |  |
Top three noisy pixels from each quadrant. If the there are fewer than three noisy pixels in the level2.evt file, extra rows are filled as -1
| Pixel properties | Quadrant properties | ||||||
|---|---|---|---|---|---|---|---|
| Quadrant | DetID | PixID | Counts | Sigma | Mean | Median | Sigma |
| A | 15 | 174 | 122726 | 792.68 | 763 | 748 | 153.9 |
| A | 13 | 254 | 9709 | 58.23 | 763 | 748 | 153.9 |
| A | 3 | 137 | 7308 | 42.63 | 763 | 748 | 153.9 |
| B | 10 | 245 | 194663 | 1352.81 | 755 | 736 | 143.4 |
| B | 4 | 80 | 36890 | 252.2 | 755 | 736 | 143.4 |
| B | 12 | 111 | 17692 | 118.28 | 755 | 736 | 143.4 |
| C | 14 | 238 | 120807 | 695.92 | 735 | 740 | 172.5 |
| C | 7 | 247 | 14223 | 78.15 | 735 | 740 | 172.5 |
| C | 3 | 233 | 4984 | 24.6 | 735 | 740 | 172.5 |
| D | 1 | 52 | 779985 | 4469.15 | 734 | 716 | 174.4 |
| D | 8 | 195 | 564231 | 3231.79 | 734 | 716 | 174.4 |
| D | 13 | 104 | 281765 | 1611.83 | 734 | 716 | 174.4 |
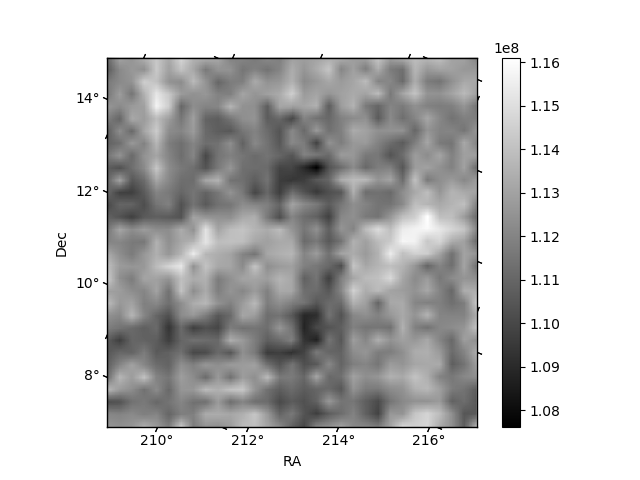
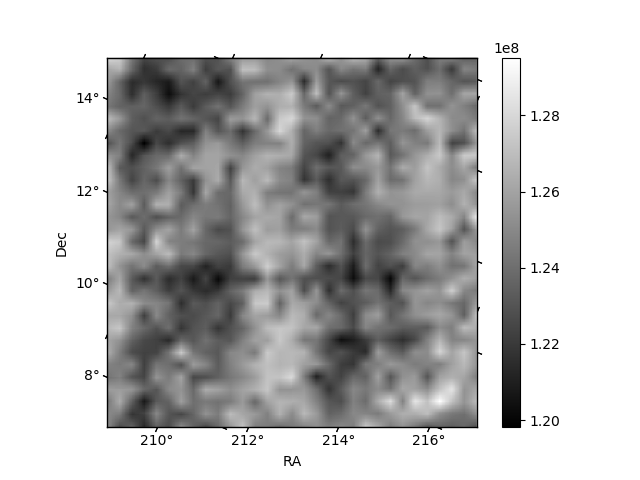
Histogram calculated using DETX and DETY for each event in the final _common_clean file
| Quadrant A | 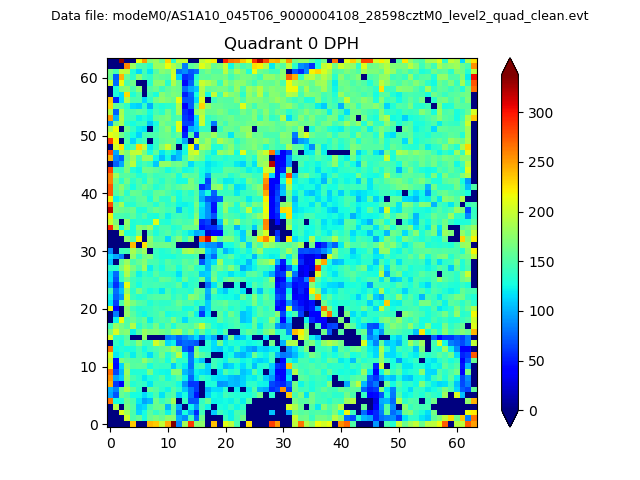 |
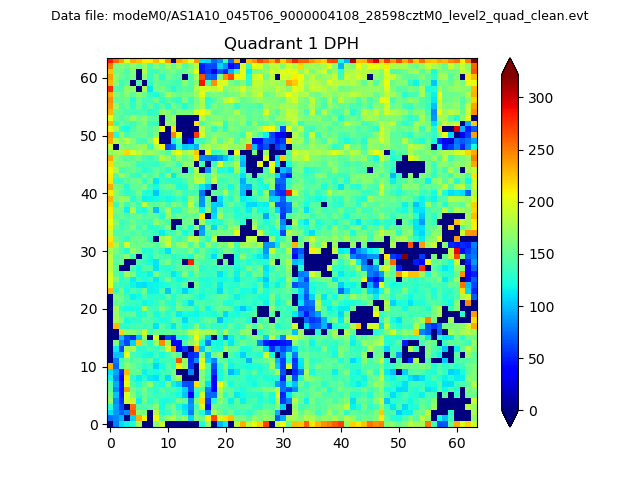 |
Quadrant B |
|---|---|---|---|
| Quadrant D | 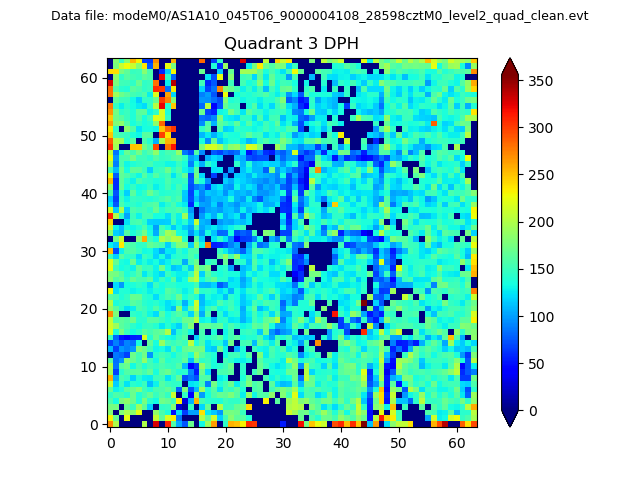 |
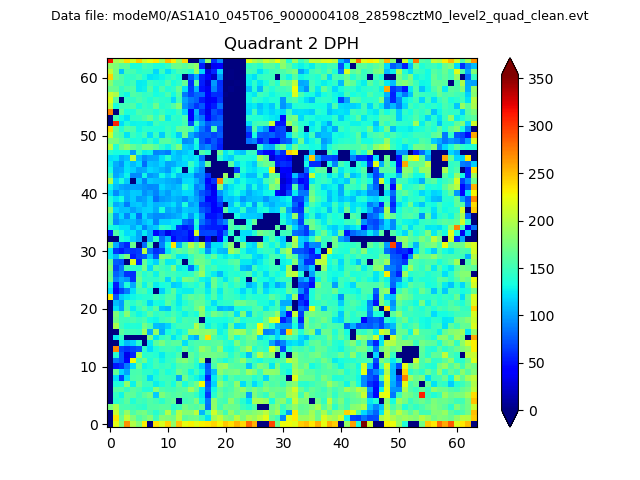 |
Quadrant C |
| Plot type | Count rate plots | Images |
|---|---|---|
| Comparison with Poisson distribution Blue bars denote a histogram of data divided into 1 sec bins. Red curve is a Poisson curve with rate = median count rate of data. |
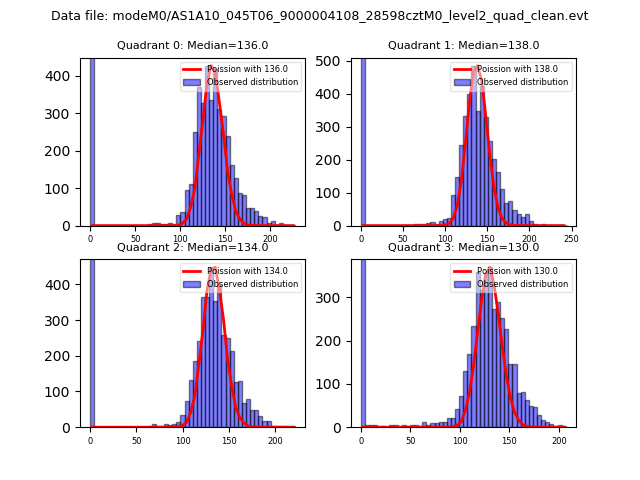 |
 |
| Quadrant-wise count rates Data is divided into 100 sec bins |
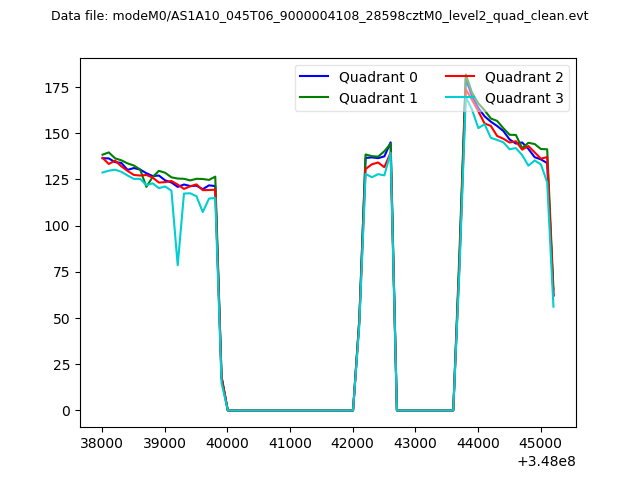 |
|
| Module-wise count rates for Quadrant A Data is divided into 100 sec bins |
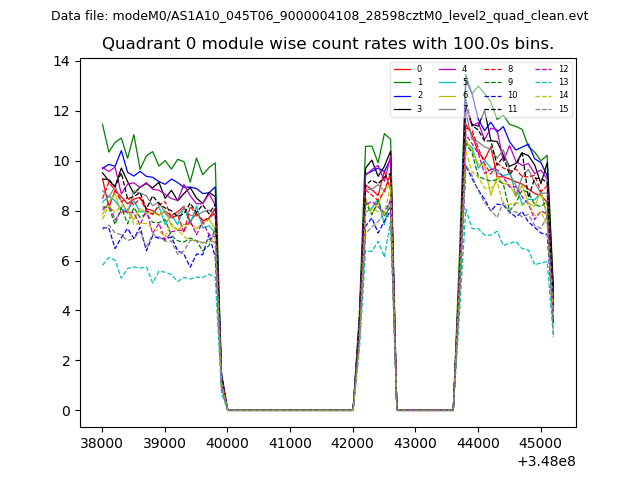 |
 |
| Module-wise count rates for Quadrant B Data is divided into 100 sec bins |
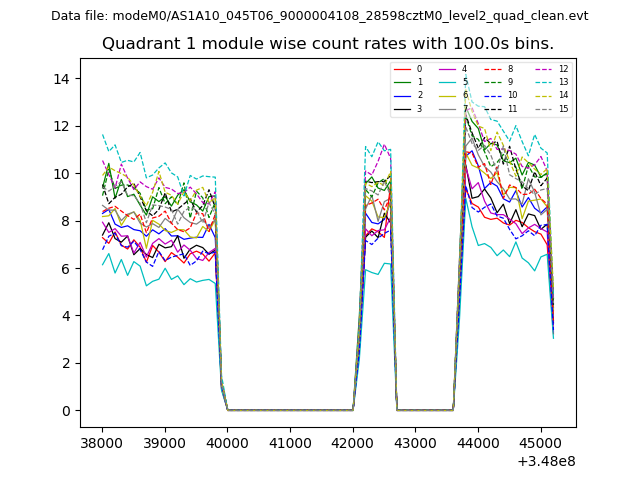 |
 |
| Module-wise count rates for Quadrant C Data is divided into 100 sec bins |
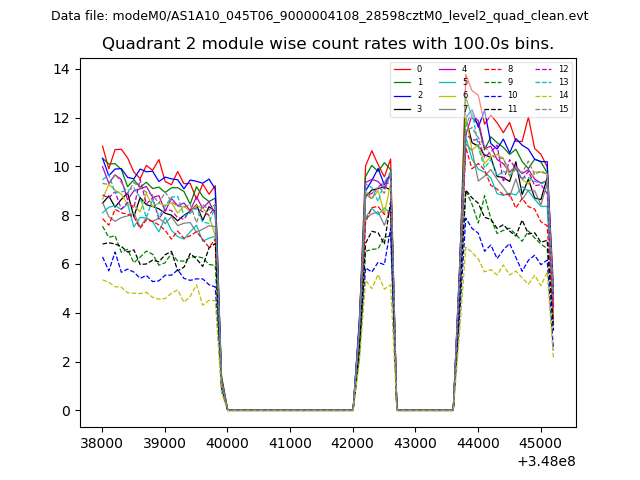 |
 |
| Module-wise count rates for Quadrant D Data is divided into 100 sec bins |
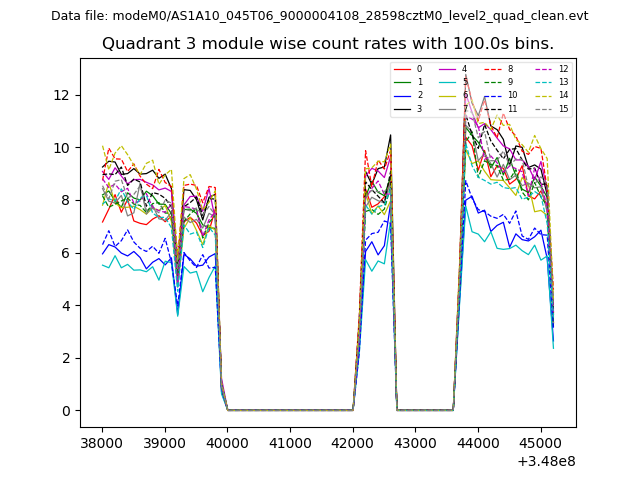 |
 |
| Parameter | Plot |
|---|---|
| CZT HV Monitor | 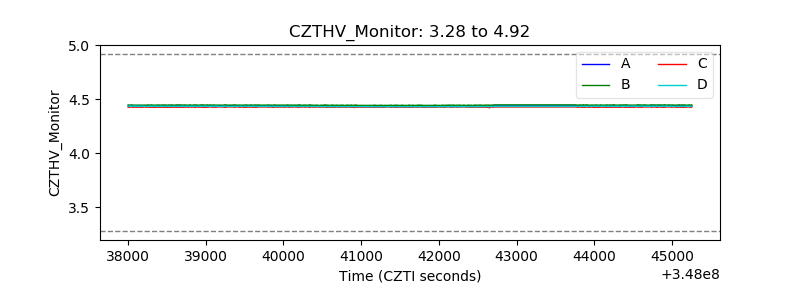 |
| D_VDD |  |
| Temperature 1 | 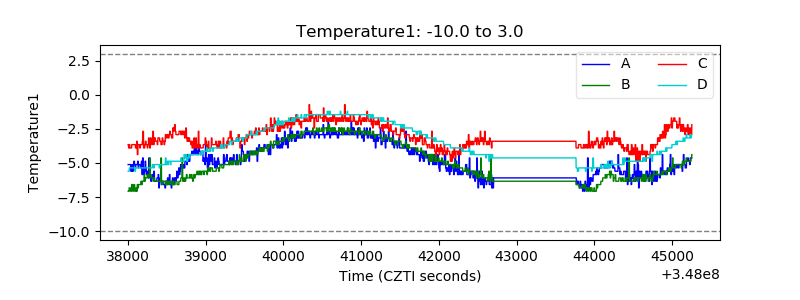 |
| Veto HV Monitor | 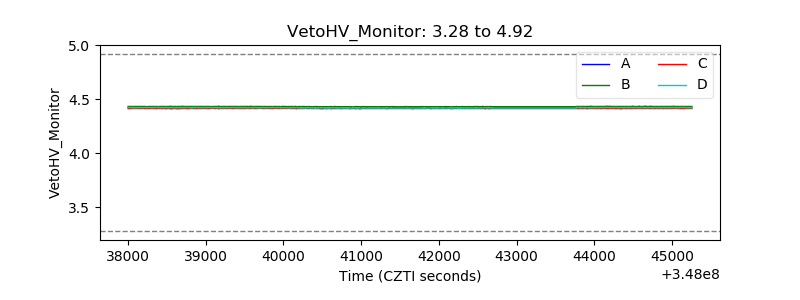 |
| Veto LLD | 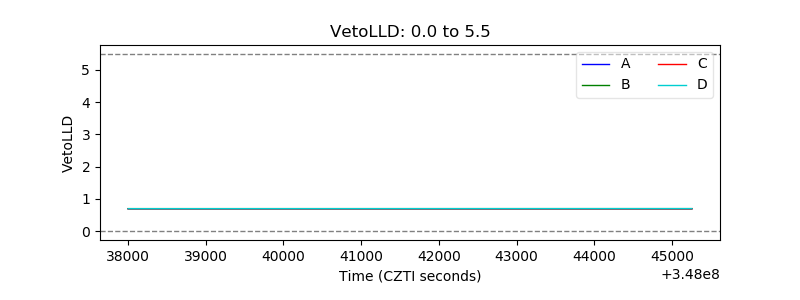 |
| Alpha Counter | 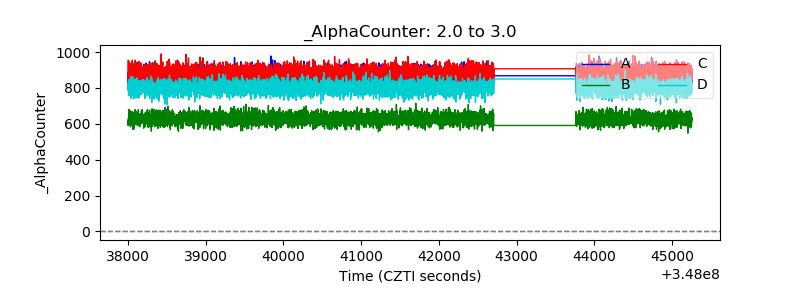 |
| _CPM_Rate | 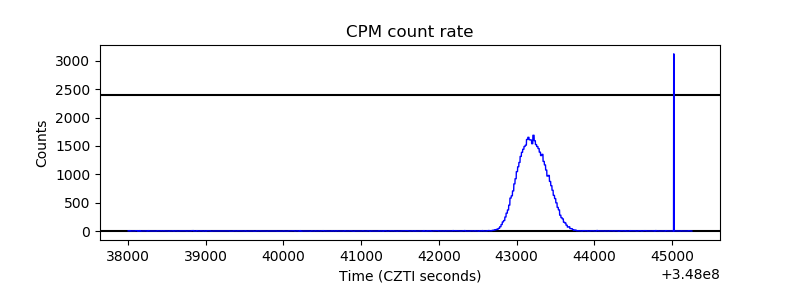 |
| CZT Counter | 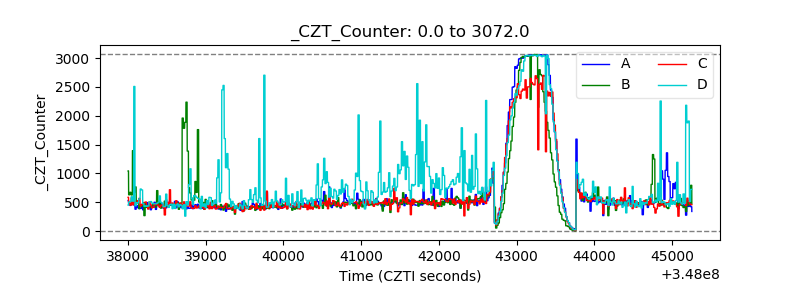 |
| +2.5 Volts monitor |  |
| +5 Volts monitor |  |
| _ROLL_ROT | 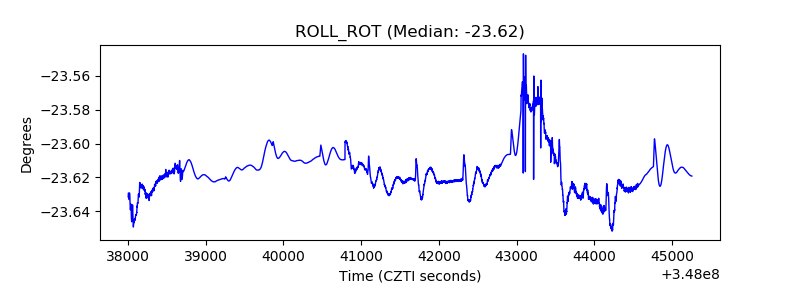 |
| _Roll_DEC | 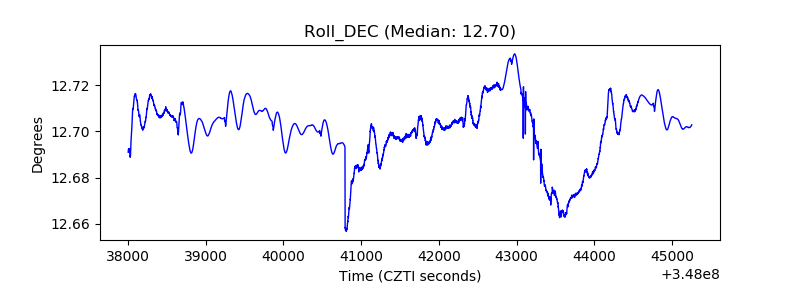 |
| _Roll_RA | 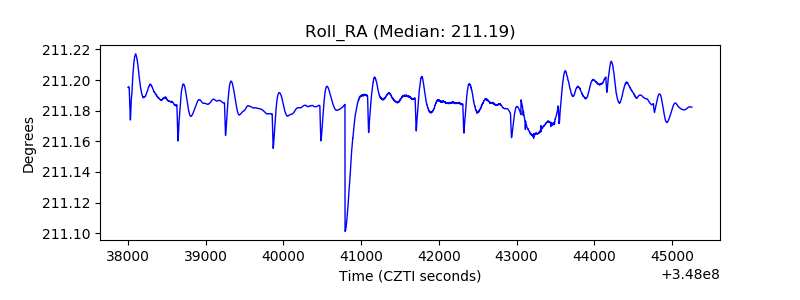 |
| Veto Counter | 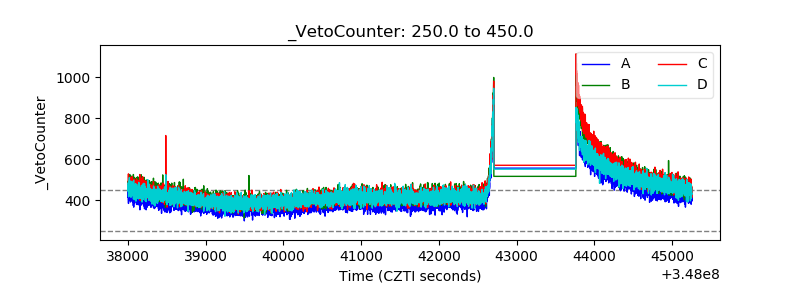 |