| Param | Original file | Final file |
|---|---|---|
| Filename | modeM0/AS1A10_045T06_9000004108_28600cztM0_level2.evt | modeM0/AS1A10_045T06_9000004108_28600cztM0_level2_quad_clean.evt |
| Size (bytes) | 445,870,080 | 85,371,840 |
| Size | 425.2 MB | 81.4 MB |
| Events in quadrant A | 3,263,746 | 546,870 |
| Events in quadrant B | 3,042,797 | 560,398 |
| Events in quadrant C | 3,025,995 | 541,686 |
| Events in quadrant D | 3,770,618 | 524,601 |
| Mode M9 | |||
|---|---|---|---|
| Quadrant | BADHDUFLAG | Total packets | Discarded packets |
| A | 0 | 12 | 0 |
| B | 0 | 12 | 0 |
| C | 0 | 12 | 0 |
| D | 0 | 12 | 0 |
| Mode M0 | |||
|---|---|---|---|
| Quadrant | BADHDUFLAG | Total packets | Discarded packets |
| A | 0 | 13302 | 1 |
| B | 0 | 12491 | 1 |
| C | 0 | 12365 | 1 |
| D | 0 | 14975 | 1 |
| Mode SS | |||
|---|---|---|---|
| Quadrant | BADHDUFLAG | Total packets | Discarded packets |
| A | 0 | 120 | 0 |
| B | 0 | 120 | 0 |
| C | 0 | 120 | 0 |
| D | 0 | 120 | 0 |
| Quadrant | Total seconds | Saturated seconds | Saturation percentage |
|---|---|---|---|
| A | 5891 | 61 | 1.035478% |
| B | 5892 | 61 | 1.035302% |
| C | 5892 | 70 | 1.188052% |
| D | 5892 | 103 | 1.748133% |
Noise dominated data is calculated using 1-second bins in cleaned event files. If a bin has >2000 counts, and if more than 50% of those come from <1% of pixels, then it is considered to be noise-dominated and hence unusable.
| Quadrant | # 1 sec bins | Bins with >0 counts | Bins with >2000 counts | High rate bins dominated by noise | Noise dominated (total time) | Noise dominated (detector-on time) | Marked lightcurve |
|---|---|---|---|---|---|---|---|
| A | 7056 | 5891 | 4 | 4 | 0.06% | 0.07% | 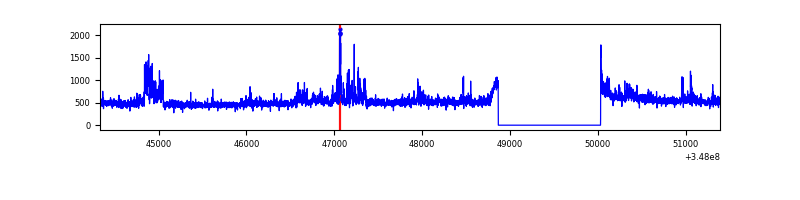 |
| B | 7057 | 5892 | 4 | 4 | 0.06% | 0.07% | 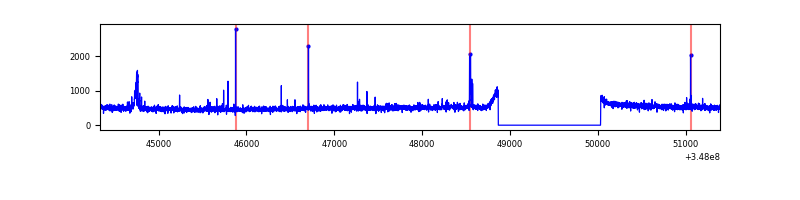 |
| C | 7057 | 5892 | 0 | 0 | 0.00% | 0.00% | 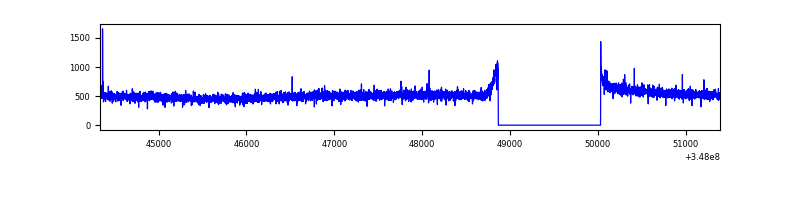 |
| D | 7057 | 5892 | 68 | 68 | 0.96% | 1.15% | 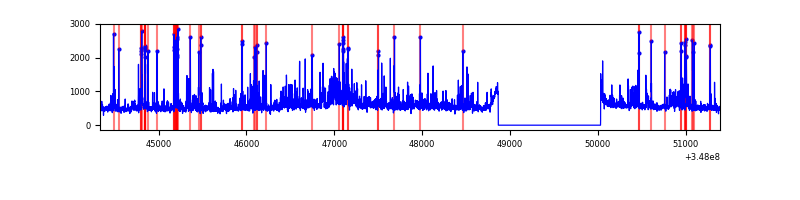 |
Top three noisy pixels from each quadrant. If the there are fewer than three noisy pixels in the level2.evt file, extra rows are filled as -1
| Pixel properties | Quadrant properties | ||||||
|---|---|---|---|---|---|---|---|
| Quadrant | DetID | PixID | Counts | Sigma | Mean | Median | Sigma |
| A | 12 | 16 | 164934 | 1075.62 | 764 | 750 | 152.6 |
| A | 15 | 174 | 90826 | 590.12 | 764 | 750 | 152.6 |
| A | 12 | 194 | 35291 | 226.29 | 764 | 750 | 152.6 |
| B | 4 | 80 | 39486 | 270.68 | 753 | 735 | 143.2 |
| B | 15 | 222 | 18232 | 122.22 | 753 | 735 | 143.2 |
| B | 12 | 111 | 17450 | 116.75 | 753 | 735 | 143.2 |
| C | 14 | 238 | 121553 | 704.7 | 737 | 744 | 171.4 |
| C | 3 | 233 | 14282 | 78.97 | 737 | 744 | 171.4 |
| C | 7 | 247 | 14226 | 78.64 | 737 | 744 | 171.4 |
| D | 1 | 52 | 519268 | 2936.11 | 743 | 726 | 176.6 |
| D | 8 | 195 | 202009 | 1139.71 | 743 | 726 | 176.6 |
| D | 13 | 104 | 177200 | 999.24 | 743 | 726 | 176.6 |
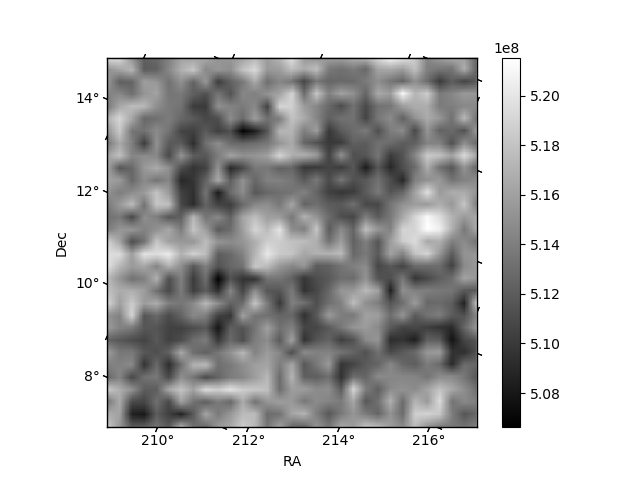
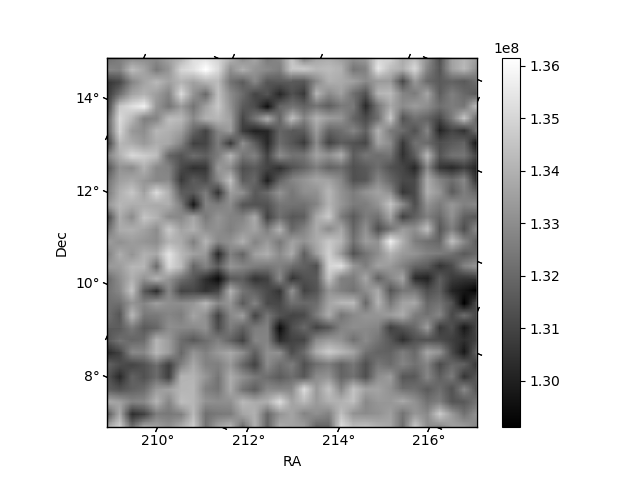
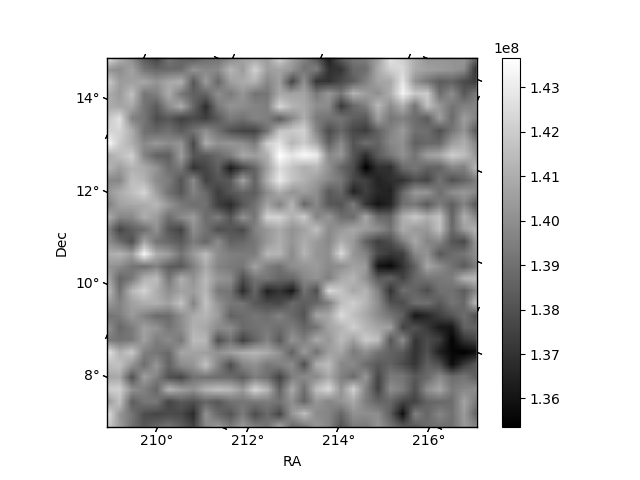
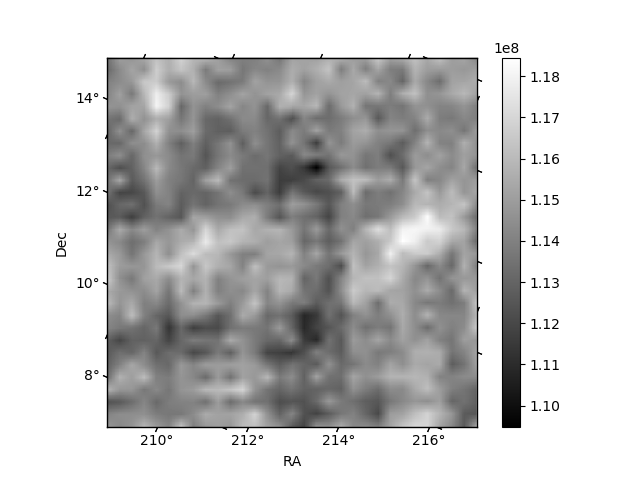
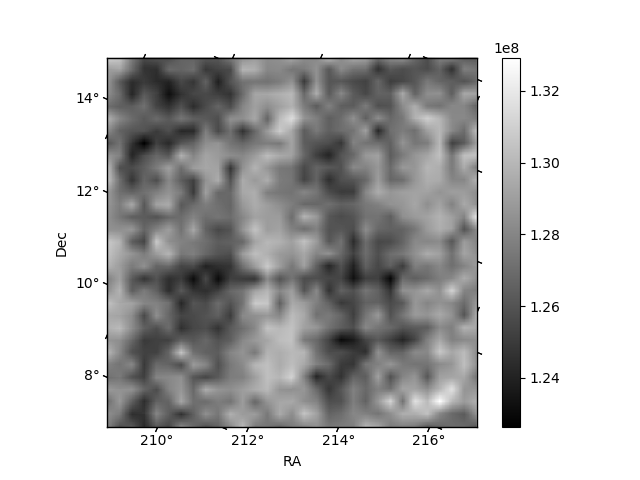
Histogram calculated using DETX and DETY for each event in the final _common_clean file
| Quadrant A | 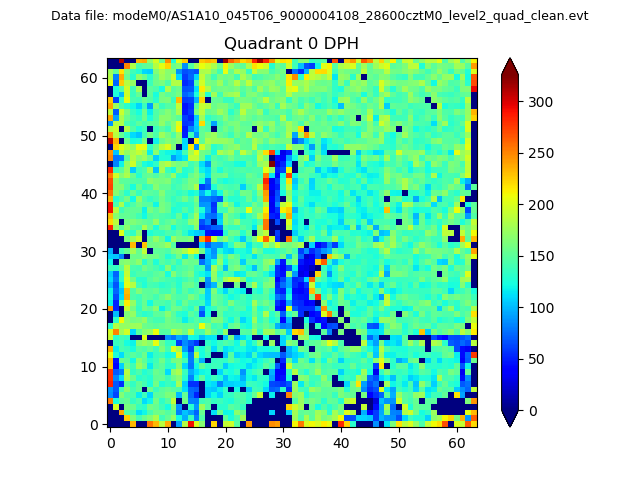 |
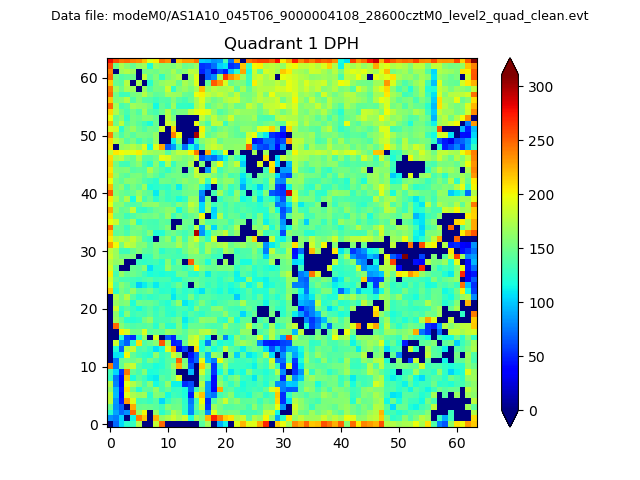 |
Quadrant B |
|---|---|---|---|
| Quadrant D | 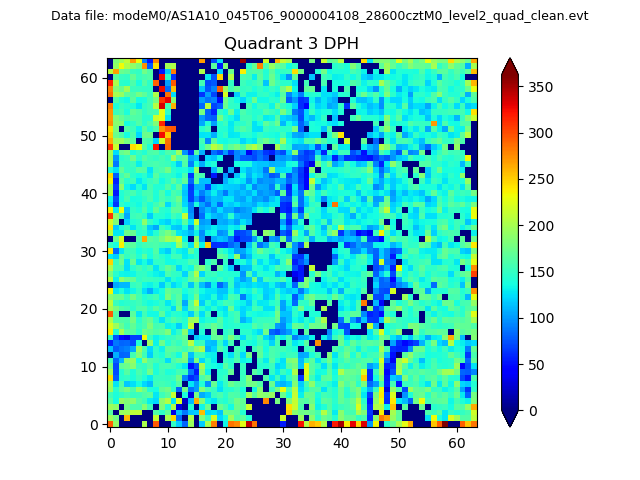 |
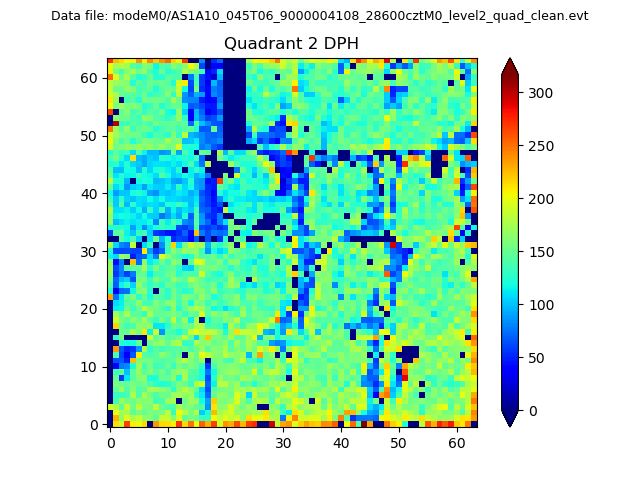 |
Quadrant C |
| Plot type | Count rate plots | Images |
|---|---|---|
| Comparison with Poisson distribution Blue bars denote a histogram of data divided into 1 sec bins. Red curve is a Poisson curve with rate = median count rate of data. |
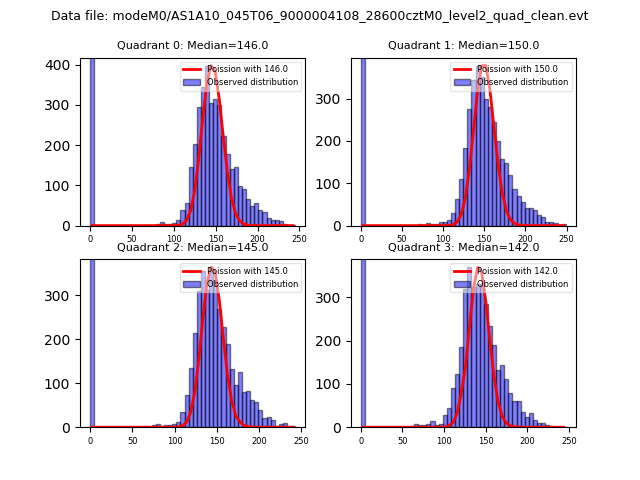 |
 |
| Quadrant-wise count rates Data is divided into 100 sec bins |
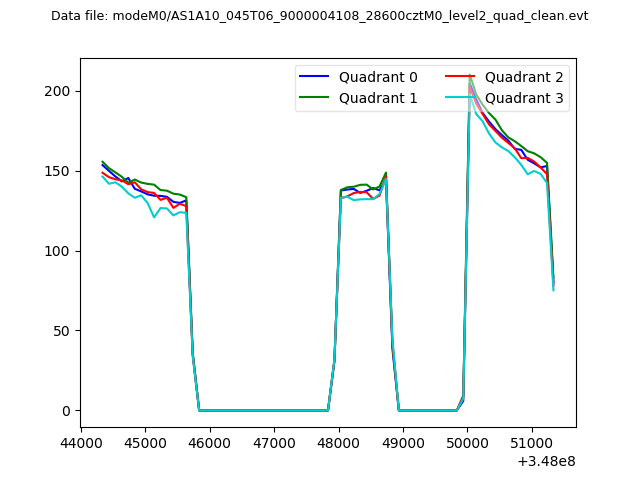 |
|
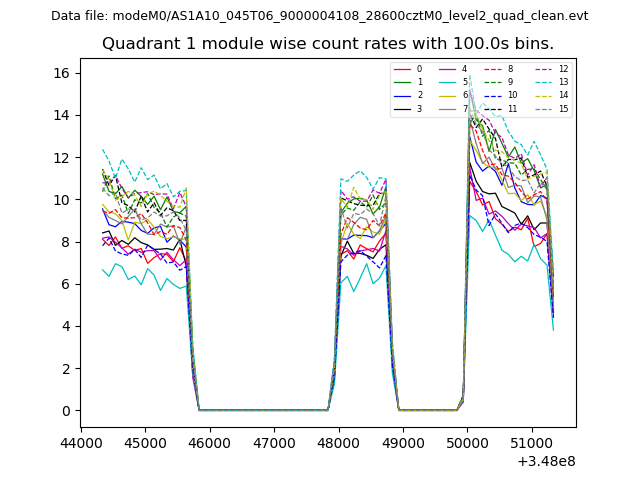
| Module-wise count rates for Quadrant A Data is divided into 100 sec bins |
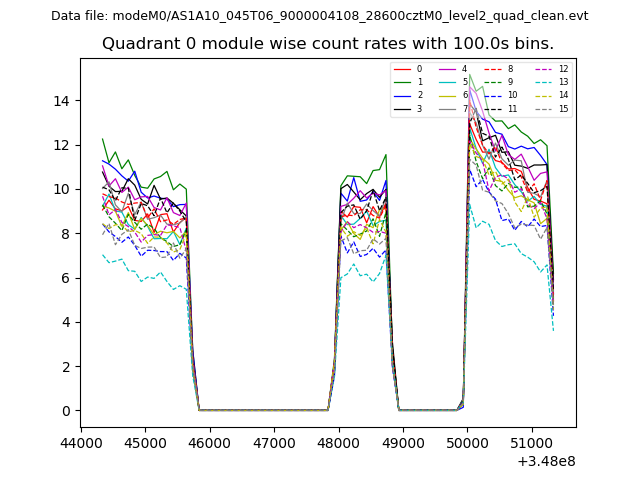 |
 |
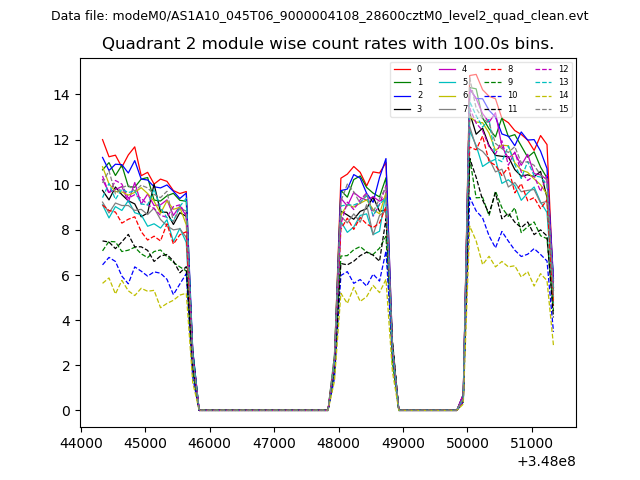
| Module-wise count rates for Quadrant B Data is divided into 100 sec bins |
 |
 |
| Module-wise count rates for Quadrant C Data is divided into 100 sec bins |
 |
 |
| Module-wise count rates for Quadrant D Data is divided into 100 sec bins |
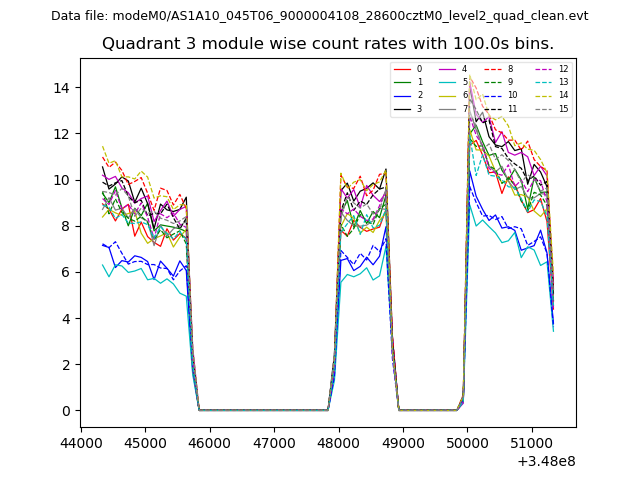 |
 |
| Parameter | Plot |
|---|---|
| CZT HV Monitor | 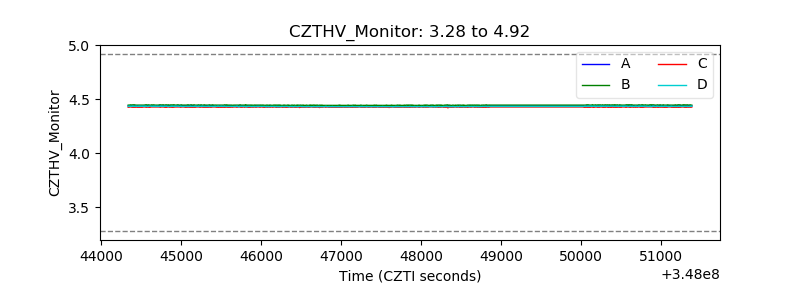 |
| D_VDD | 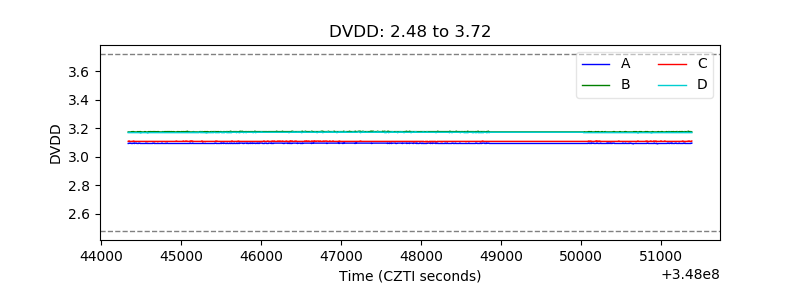 |
| Temperature 1 | 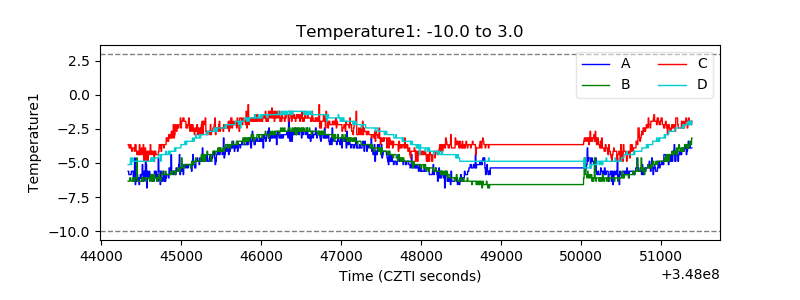 |
| Veto HV Monitor | 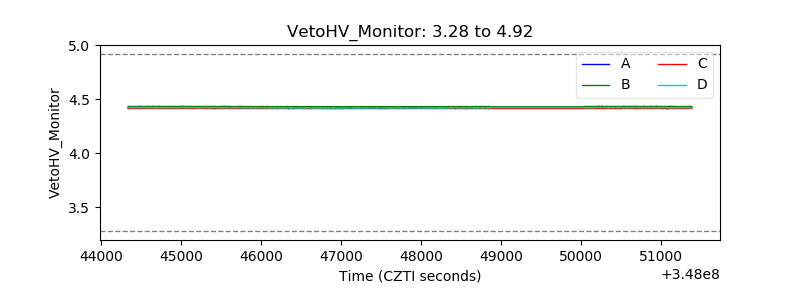 |
| Veto LLD | 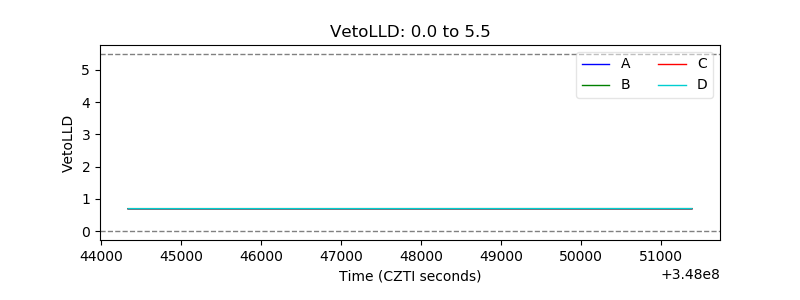 |
| Alpha Counter | 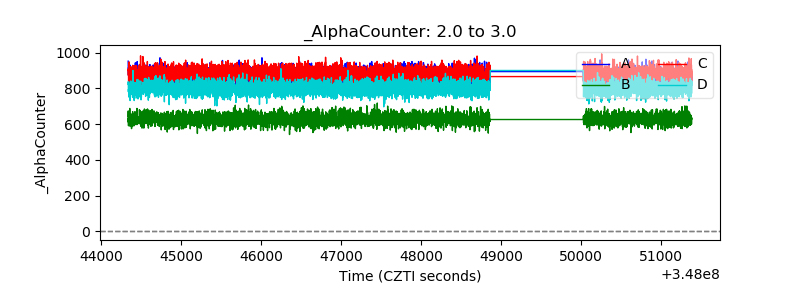 |
| _CPM_Rate | 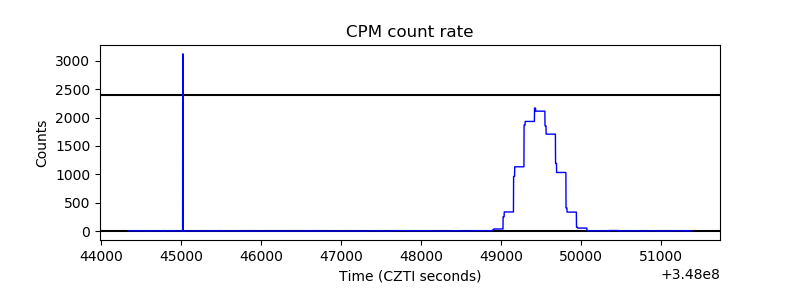 |
| CZT Counter | 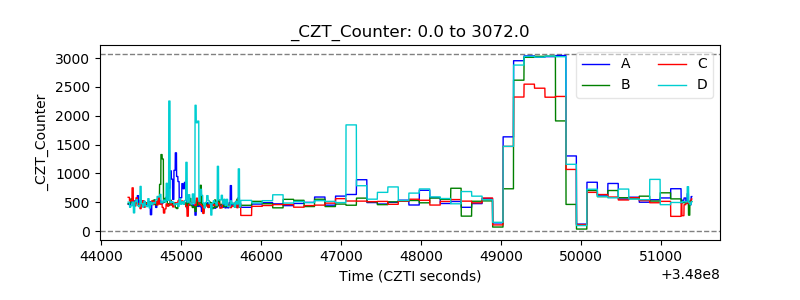 |
| +2.5 Volts monitor |  |
| +5 Volts monitor |  |
| _ROLL_ROT | 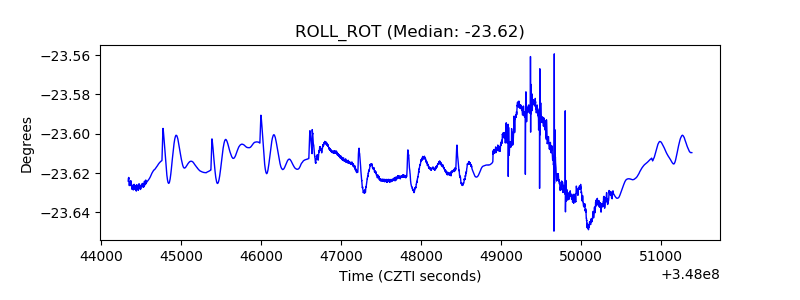 |
| _Roll_DEC | 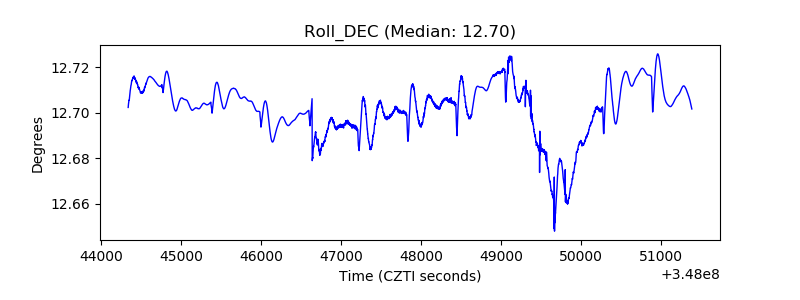 |
| _Roll_RA | 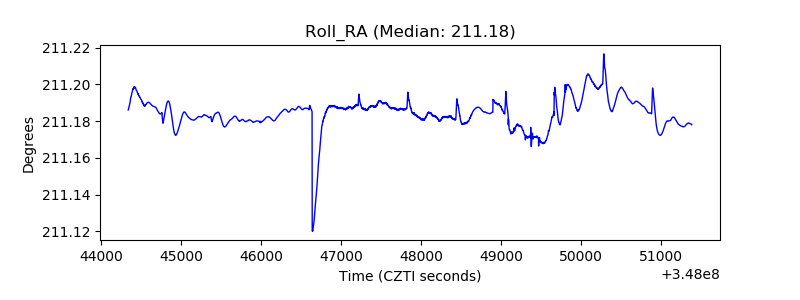 |
| Veto Counter | 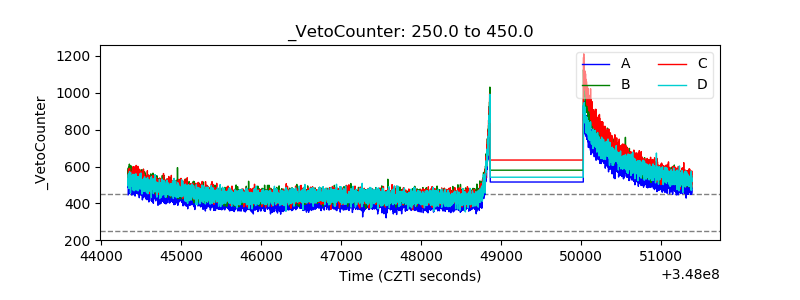 |