| Param | Original file | Final file |
|---|---|---|
| Filename | modeM0/AS1A10_045T06_9000004108_28601cztM0_level2.evt | modeM0/AS1A10_045T06_9000004108_28601cztM0_level2_quad_clean.evt |
| Size (bytes) | 474,284,160 | 88,655,040 |
| Size | 452.3 MB | 84.5 MB |
| Events in quadrant A | 3,697,475 | 575,394 |
| Events in quadrant B | 3,137,468 | 587,075 |
| Events in quadrant C | 3,281,311 | 568,962 |
| Events in quadrant D | 3,849,547 | 543,327 |
| Mode M9 | |||
|---|---|---|---|
| Quadrant | BADHDUFLAG | Total packets | Discarded packets |
| A | 0 | 13 | 0 |
| B | 0 | 13 | 0 |
| C | 0 | 13 | 0 |
| D | 0 | 13 | 0 |
| Mode M0 | |||
|---|---|---|---|
| Quadrant | BADHDUFLAG | Total packets | Discarded packets |
| A | 0 | 14729 | 1 |
| B | 0 | 12641 | 1 |
| C | 0 | 13161 | 1 |
| D | 0 | 15123 | 2 |
| Mode SS | |||
|---|---|---|---|
| Quadrant | BADHDUFLAG | Total packets | Discarded packets |
| A | 0 | 118 | 0 |
| B | 0 | 118 | 0 |
| C | 0 | 118 | 0 |
| D | 0 | 118 | 0 |
| Quadrant | Total seconds | Saturated seconds | Saturation percentage |
|---|---|---|---|
| A | 5872 | 37 | 0.630109% |
| B | 5873 | 31 | 0.527839% |
| C | 5873 | 74 | 1.260003% |
| D | 5872 | 116 | 1.975477% |
Noise dominated data is calculated using 1-second bins in cleaned event files. If a bin has >2000 counts, and if more than 50% of those come from <1% of pixels, then it is considered to be noise-dominated and hence unusable.
| Quadrant | # 1 sec bins | Bins with >0 counts | Bins with >2000 counts | High rate bins dominated by noise | Noise dominated (total time) | Noise dominated (detector-on time) | Marked lightcurve |
|---|---|---|---|---|---|---|---|
| A | 7157 | 5872 | 2 | 2 | 0.03% | 0.03% | 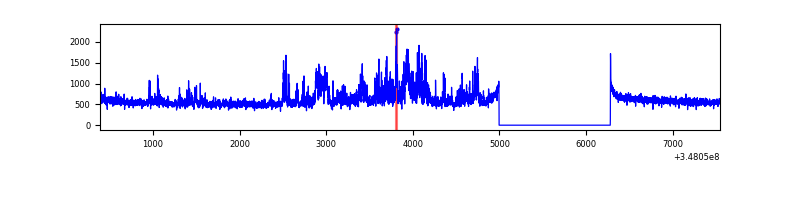 |
| B | 7158 | 5873 | 3 | 3 | 0.04% | 0.05% | 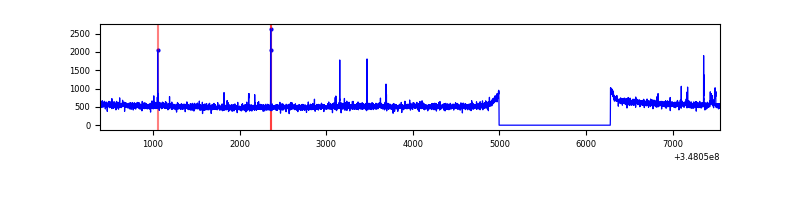 |
| C | 7158 | 5873 | 6 | 6 | 0.08% | 0.10% | 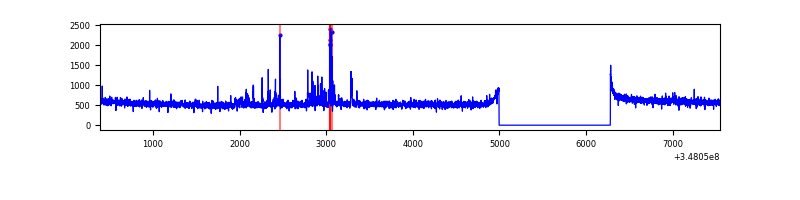 |
| D | 7157 | 5872 | 113 | 113 | 1.58% | 1.92% | 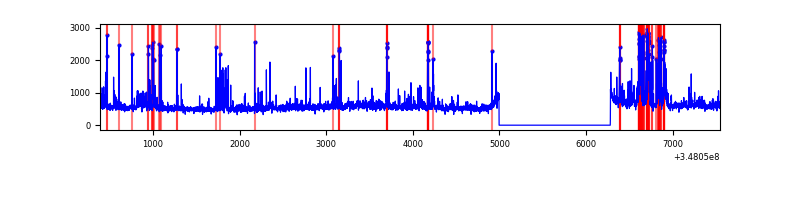 |
Top three noisy pixels from each quadrant. If the there are fewer than three noisy pixels in the level2.evt file, extra rows are filled as -1
| Pixel properties | Quadrant properties | ||||||
|---|---|---|---|---|---|---|---|
| Quadrant | DetID | PixID | Counts | Sigma | Mean | Median | Sigma |
| A | 12 | 16 | 503093 | 3166.21 | 803 | 789 | 158.6 |
| A | 12 | 194 | 90585 | 566.02 | 803 | 789 | 158.6 |
| A | 13 | 254 | 10092 | 58.64 | 803 | 789 | 158.6 |
| B | 10 | 245 | 17880 | 114.96 | 788 | 769 | 148.8 |
| B | 12 | 111 | 17405 | 111.77 | 788 | 769 | 148.8 |
| B | 11 | 111 | 16241 | 103.95 | 788 | 769 | 148.8 |
| C | 14 | 238 | 126354 | 704.92 | 771 | 778 | 178.1 |
| C | 15 | 208 | 52159 | 288.43 | 771 | 778 | 178.1 |
| C | 3 | 233 | 50212 | 277.5 | 771 | 778 | 178.1 |
| D | 1 | 52 | 507537 | 2780.15 | 775 | 758 | 182.3 |
| D | 8 | 195 | 197574 | 1079.72 | 775 | 758 | 182.3 |
| D | 13 | 104 | 133864 | 730.21 | 775 | 758 | 182.3 |
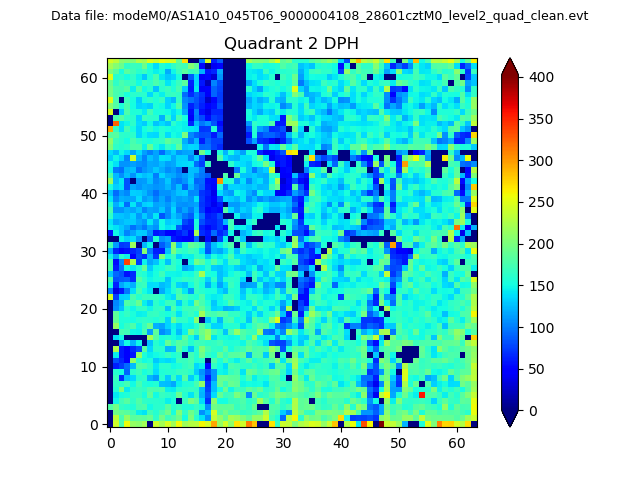
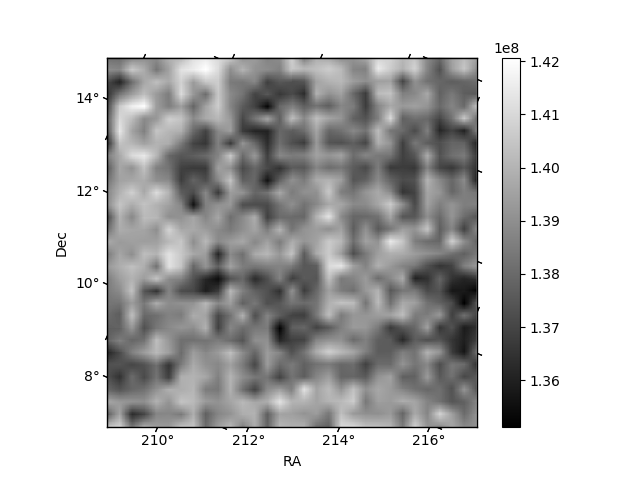
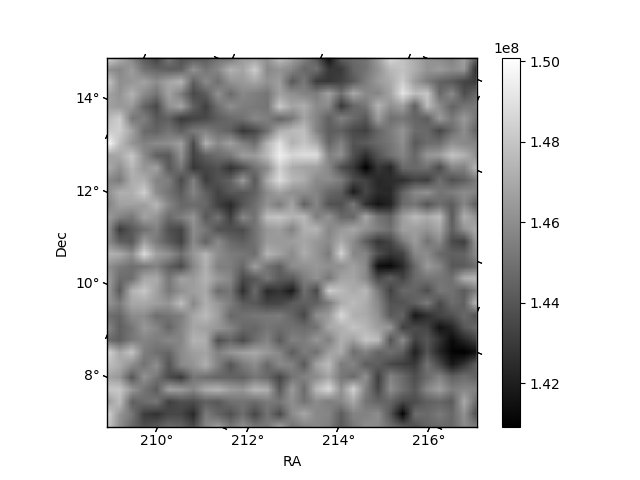
Histogram calculated using DETX and DETY for each event in the final _common_clean file
| Quadrant A | 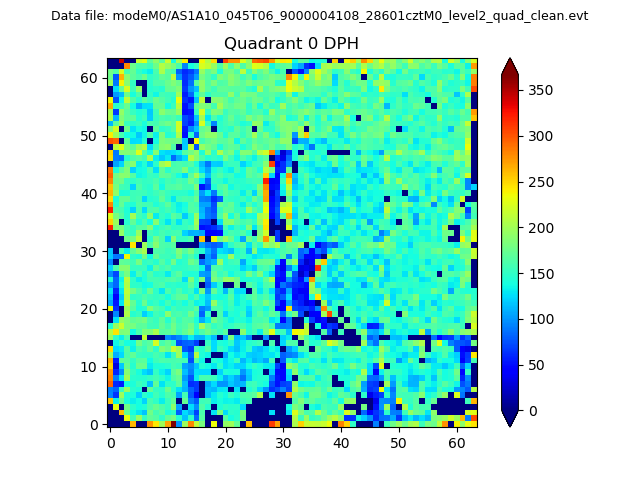 |
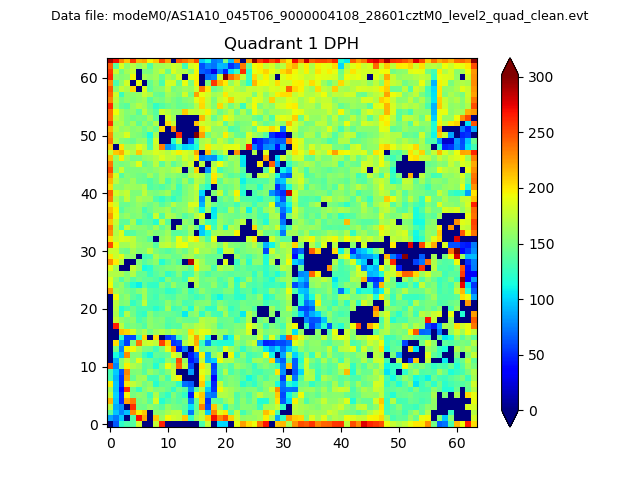 |
Quadrant B |
|---|---|---|---|
| Quadrant D | 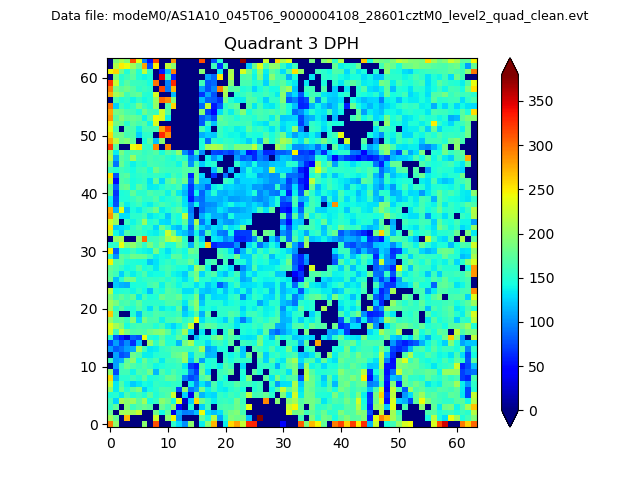 |
 |
Quadrant C |
| Plot type | Count rate plots | Images |
|---|---|---|
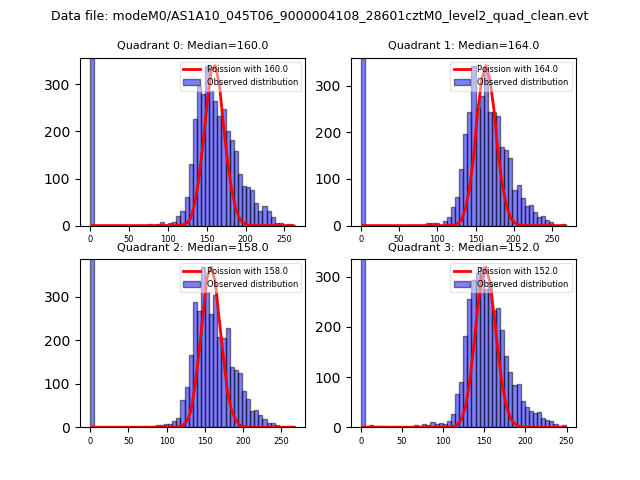
| Comparison with Poisson distribution Blue bars denote a histogram of data divided into 1 sec bins. Red curve is a Poisson curve with rate = median count rate of data. |
 |
 |
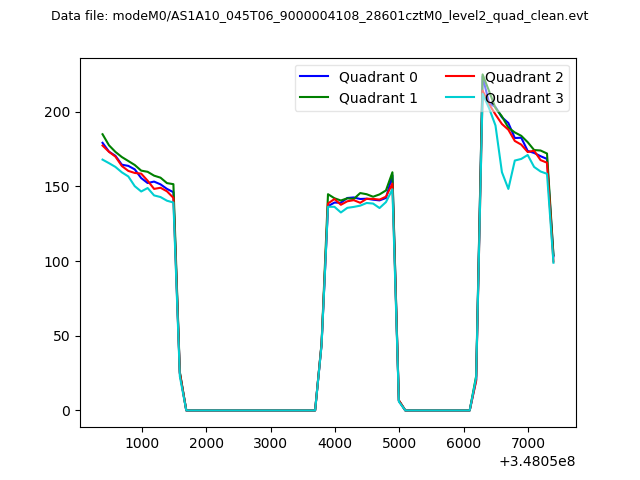
| Quadrant-wise count rates Data is divided into 100 sec bins |
 |
|
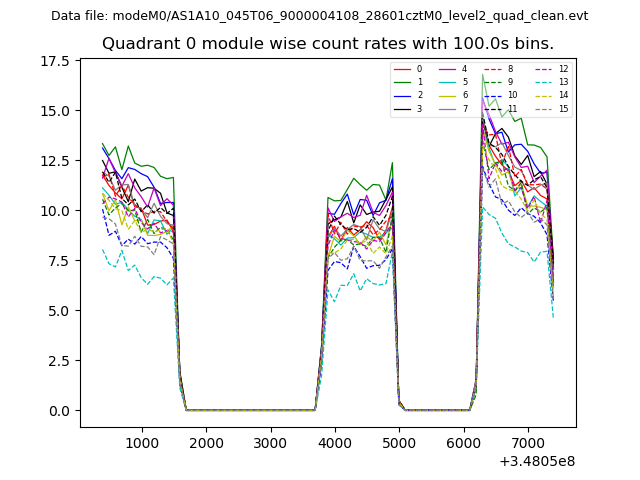
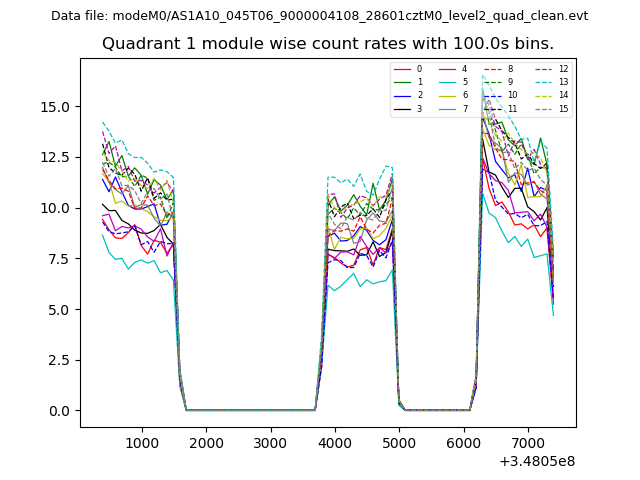
| Module-wise count rates for Quadrant A Data is divided into 100 sec bins |
 |
 |
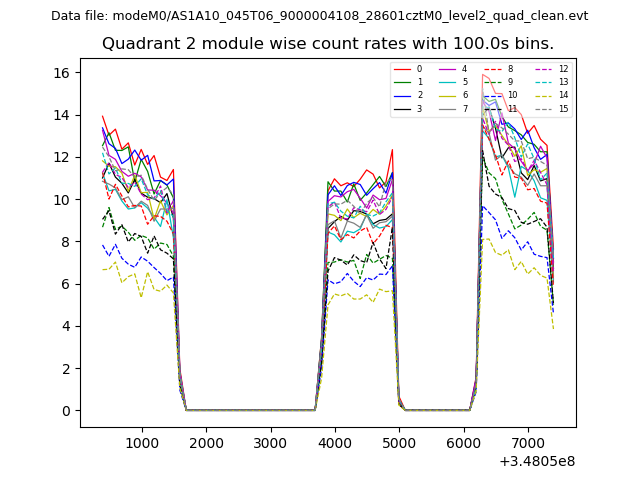
| Module-wise count rates for Quadrant B Data is divided into 100 sec bins |
 |
 |
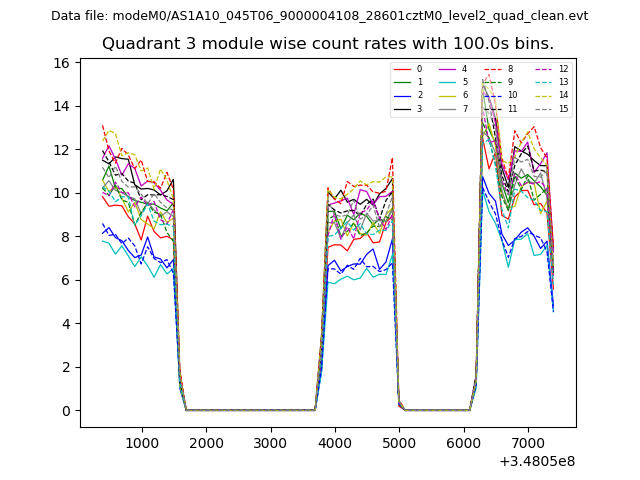
| Module-wise count rates for Quadrant C Data is divided into 100 sec bins |
 |
 |
| Module-wise count rates for Quadrant D Data is divided into 100 sec bins |
 |
 |
| Parameter | Plot |
|---|---|
| CZT HV Monitor | 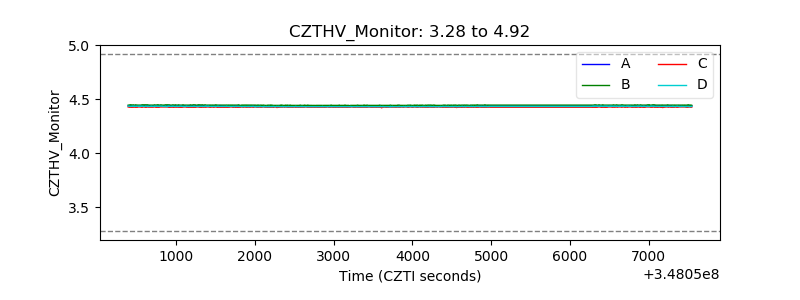 |
| D_VDD | 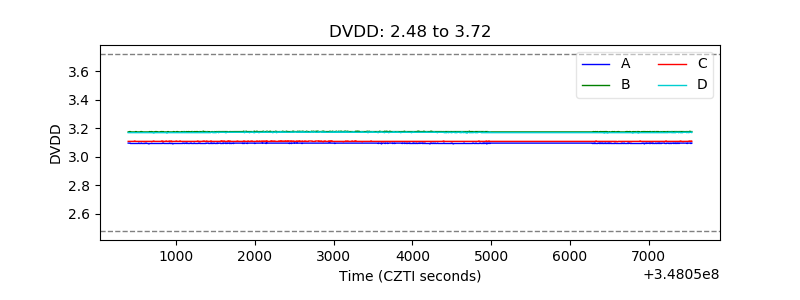 |
| Temperature 1 | 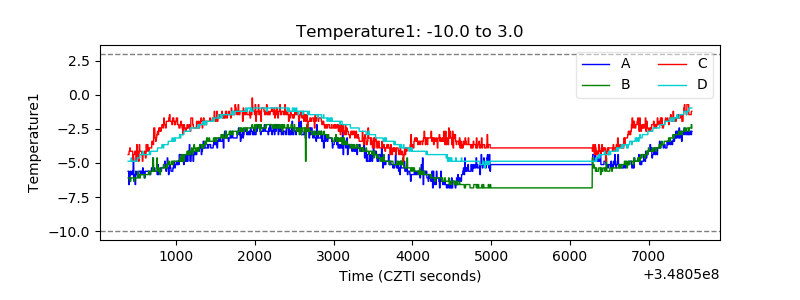 |
| Veto HV Monitor | 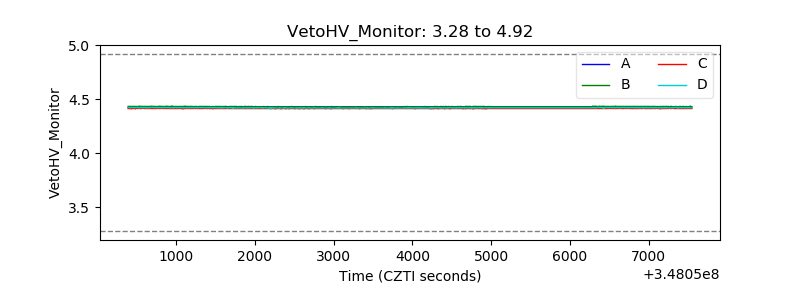 |
| Veto LLD | 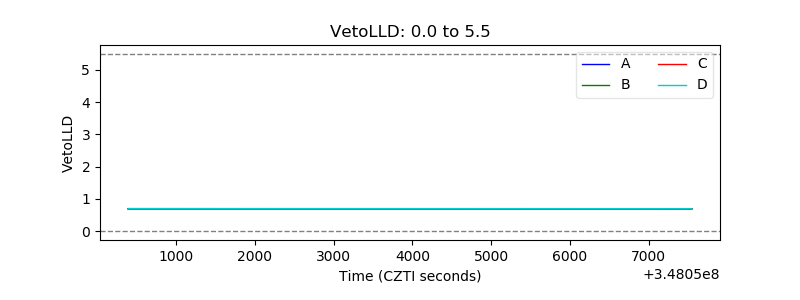 |
| Alpha Counter | 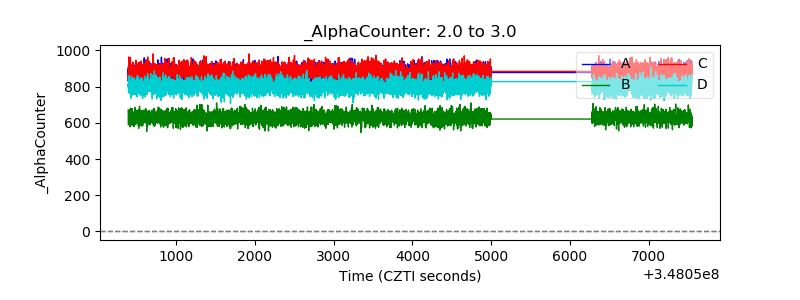 |
| _CPM_Rate | 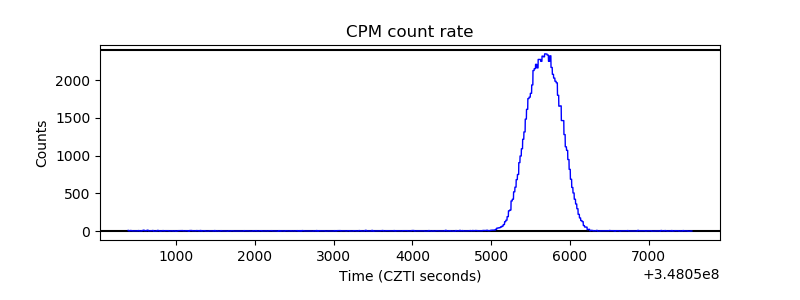 |
| CZT Counter | 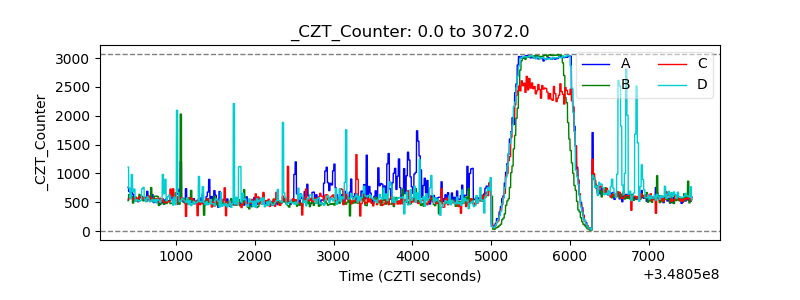 |
| +2.5 Volts monitor |  |
| +5 Volts monitor |  |
| _ROLL_ROT | 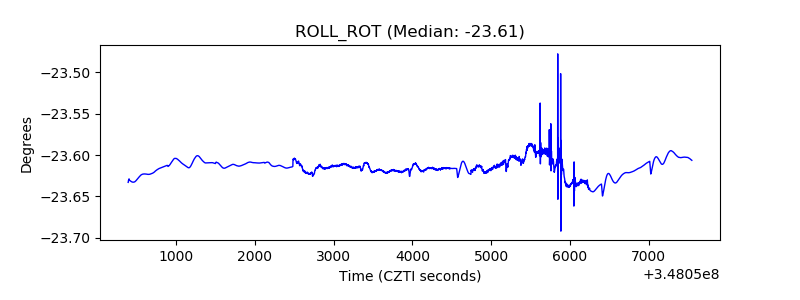 |
| _Roll_DEC | 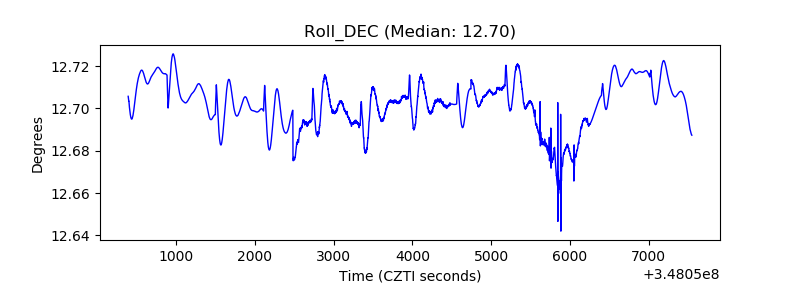 |
| _Roll_RA | 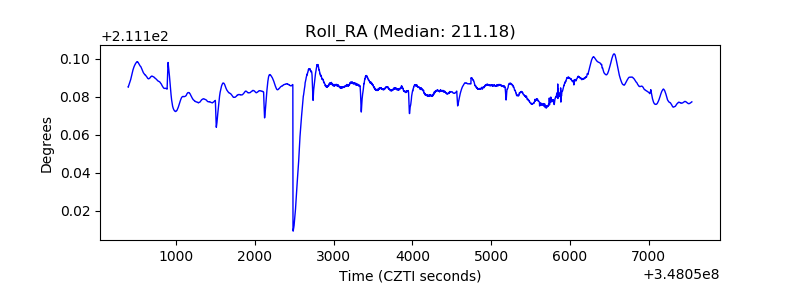 |
| Veto Counter | 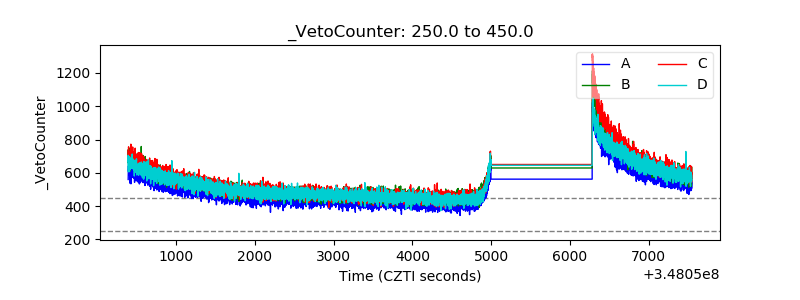 |