| Param | Original file | Final file |
|---|---|---|
| Filename | modeM0/AS1A10_045T06_9000004108_28602cztM0_level2.evt | modeM0/AS1A10_045T06_9000004108_28602cztM0_level2_quad_clean.evt |
| Size (bytes) | 504,357,120 | 88,323,840 |
| Size | 481.0 MB | 84.2 MB |
| Events in quadrant A | 3,390,351 | 569,181 |
| Events in quadrant B | 3,398,522 | 578,473 |
| Events in quadrant C | 3,762,850 | 560,711 |
| Events in quadrant D | 4,308,119 | 539,336 |
| Mode M9 | |||
|---|---|---|---|
| Quadrant | BADHDUFLAG | Total packets | Discarded packets |
| A | 0 | 13 | 0 |
| B | 0 | 13 | 0 |
| C | 0 | 13 | 0 |
| D | 0 | 13 | 0 |
| Mode M0 | |||
|---|---|---|---|
| Quadrant | BADHDUFLAG | Total packets | Discarded packets |
| A | 0 | 13699 | 1 |
| B | 0 | 13720 | 1 |
| C | 0 | 15060 | 1 |
| D | 0 | 17017 | 1 |
| Mode SS | |||
|---|---|---|---|
| Quadrant | BADHDUFLAG | Total packets | Discarded packets |
| A | 0 | 124 | 0 |
| B | 0 | 124 | 0 |
| C | 0 | 124 | 0 |
| D | 0 | 124 | 0 |
| Quadrant | Total seconds | Saturated seconds | Saturation percentage |
|---|---|---|---|
| A | 6118 | 93 | 1.520105% |
| B | 6118 | 86 | 1.405688% |
| C | 6119 | 194 | 3.170453% |
| D | 6119 | 176 | 2.876287% |
Noise dominated data is calculated using 1-second bins in cleaned event files. If a bin has >2000 counts, and if more than 50% of those come from <1% of pixels, then it is considered to be noise-dominated and hence unusable.
| Quadrant | # 1 sec bins | Bins with >0 counts | Bins with >2000 counts | High rate bins dominated by noise | Noise dominated (total time) | Noise dominated (detector-on time) | Marked lightcurve |
|---|---|---|---|---|---|---|---|
| A | 7408 | 6118 | 0 | 0 | 0.00% | 0.00% | 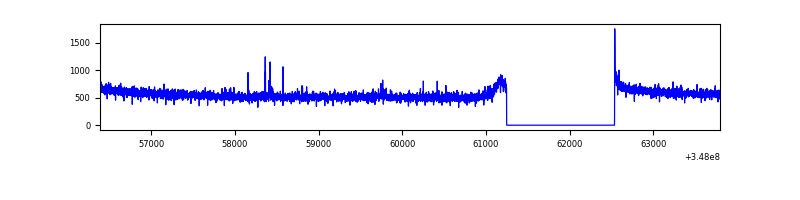 |
| B | 7408 | 6118 | 0 | 0 | 0.00% | 0.00% | 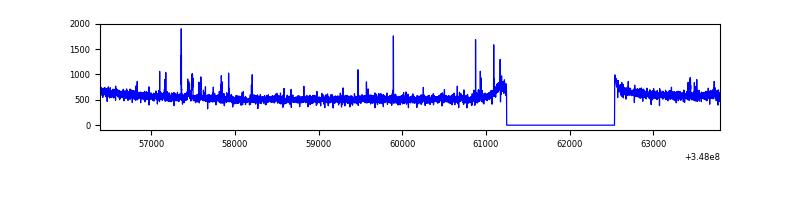 |
| C | 7409 | 6119 | 42 | 42 | 0.57% | 0.69% |  |
| D | 7409 | 6119 | 106 | 106 | 1.43% | 1.73% | 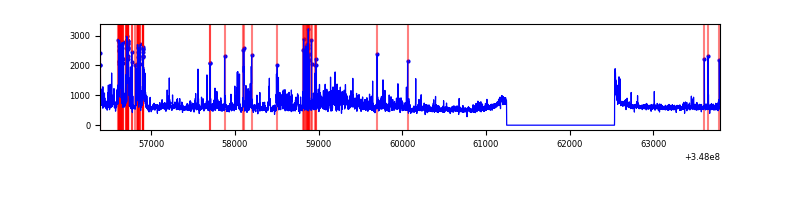 |
Top three noisy pixels from each quadrant. If the there are fewer than three noisy pixels in the level2.evt file, extra rows are filled as -1
| Pixel properties | Quadrant properties | ||||||
|---|---|---|---|---|---|---|---|
| Quadrant | DetID | PixID | Counts | Sigma | Mean | Median | Sigma |
| A | 15 | 174 | 17967 | 98.16 | 873 | 857 | 174.3 |
| A | 13 | 254 | 10062 | 52.81 | 873 | 857 | 174.3 |
| A | 3 | 137 | 7591 | 38.63 | 873 | 857 | 174.3 |
| B | 10 | 245 | 33699 | 204.62 | 854 | 836 | 160.6 |
| B | 12 | 111 | 18202 | 108.13 | 854 | 836 | 160.6 |
| B | 11 | 111 | 17078 | 101.13 | 854 | 836 | 160.6 |
| C | 15 | 208 | 282040 | 1446.12 | 837 | 847 | 194.4 |
| C | 14 | 238 | 136924 | 699.81 | 837 | 847 | 194.4 |
| C | 3 | 233 | 41325 | 208.17 | 837 | 847 | 194.4 |
| D | 1 | 52 | 515711 | 2599.71 | 847 | 831 | 198.1 |
| D | 8 | 195 | 384838 | 1938.91 | 847 | 831 | 198.1 |
| D | 13 | 104 | 87442 | 437.31 | 847 | 831 | 198.1 |
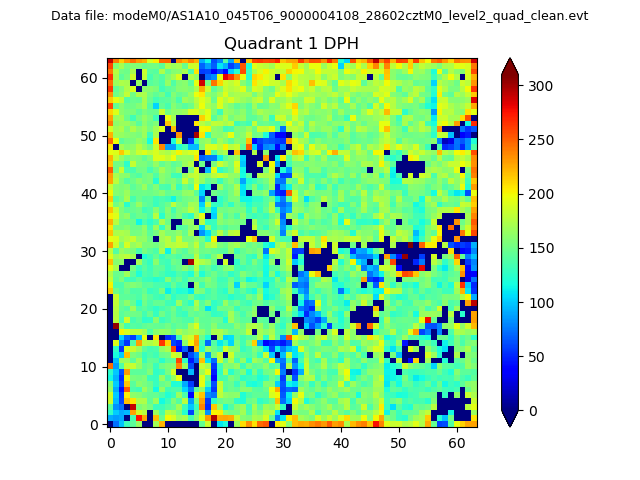
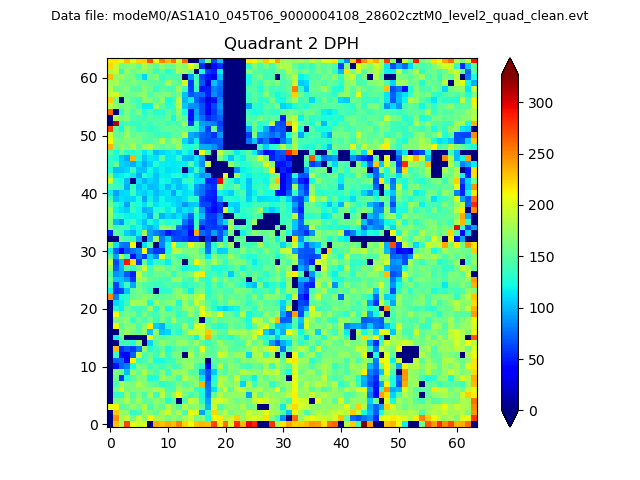
Histogram calculated using DETX and DETY for each event in the final _common_clean file
| Quadrant A | 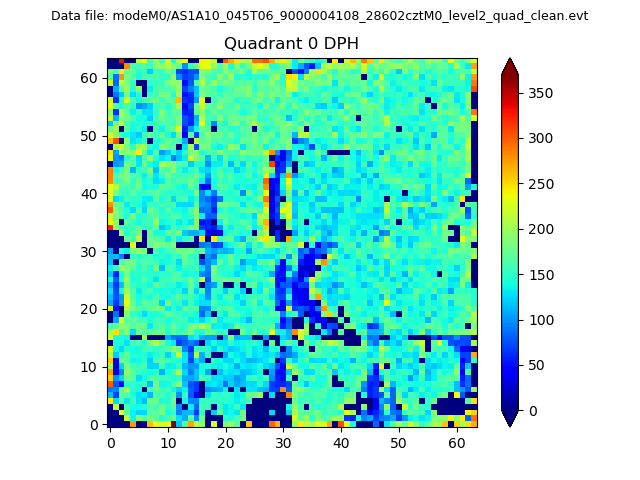 |
 |
Quadrant B |
|---|---|---|---|
| Quadrant D | 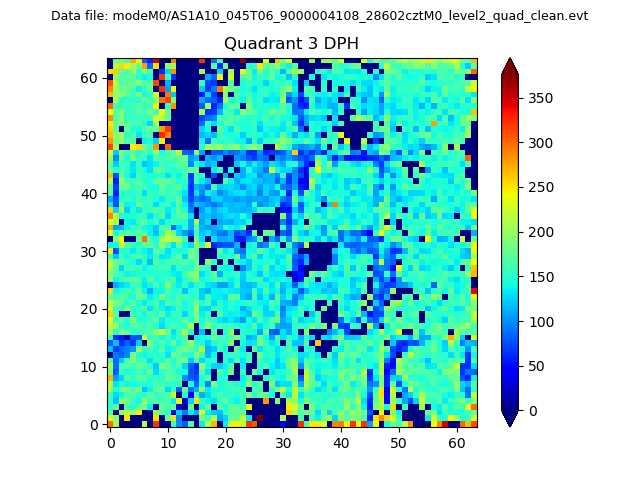 |
 |
Quadrant C |
| Plot type | Count rate plots | Images |
|---|---|---|
| Comparison with Poisson distribution Blue bars denote a histogram of data divided into 1 sec bins. Red curve is a Poisson curve with rate = median count rate of data. |
 |
 |
| Quadrant-wise count rates Data is divided into 100 sec bins |
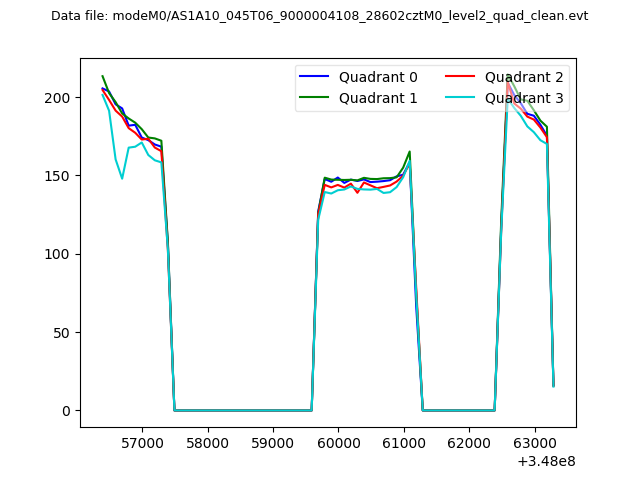 |
|
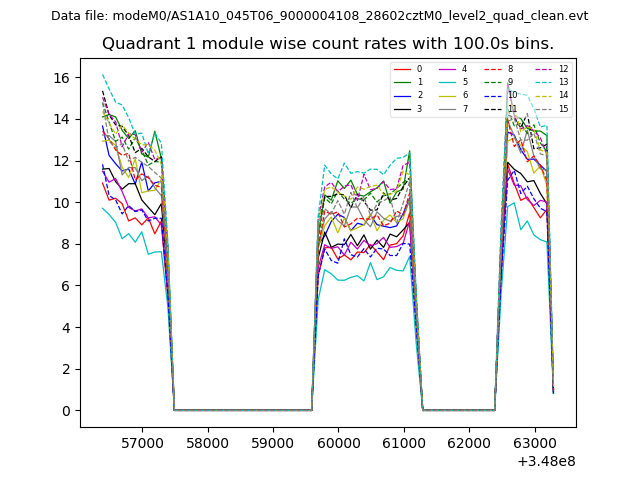
| Module-wise count rates for Quadrant A Data is divided into 100 sec bins |
 |
 |
| Module-wise count rates for Quadrant B Data is divided into 100 sec bins |
 |
 |
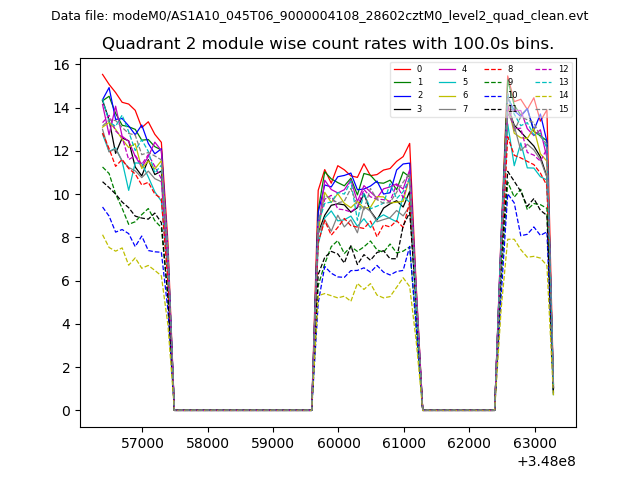
| Module-wise count rates for Quadrant C Data is divided into 100 sec bins |
 |
 |
| Module-wise count rates for Quadrant D Data is divided into 100 sec bins |
 |
 |
| Parameter | Plot |
|---|---|
| CZT HV Monitor | 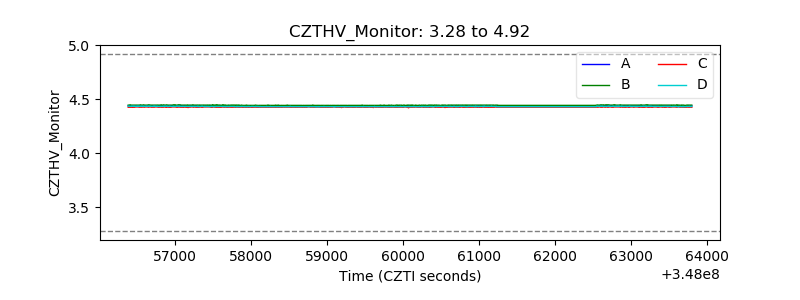 |
| D_VDD | 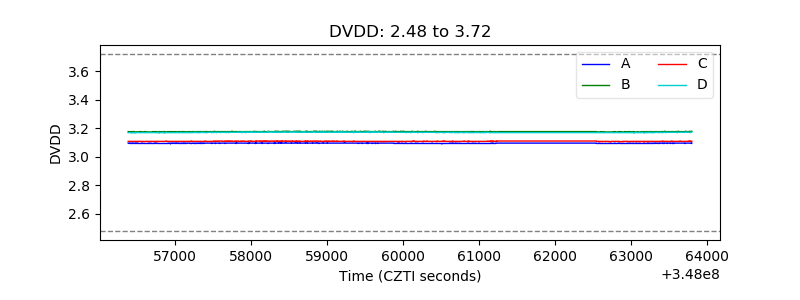 |
| Temperature 1 | 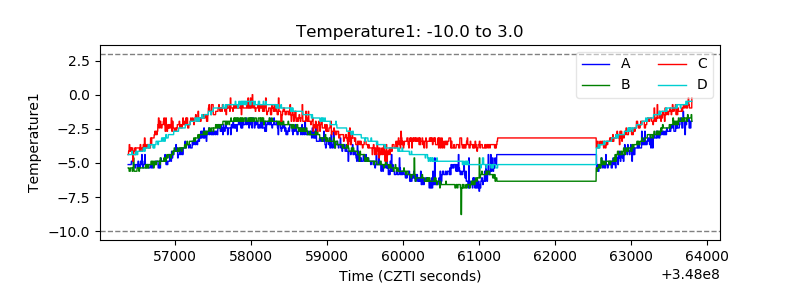 |
| Veto HV Monitor | 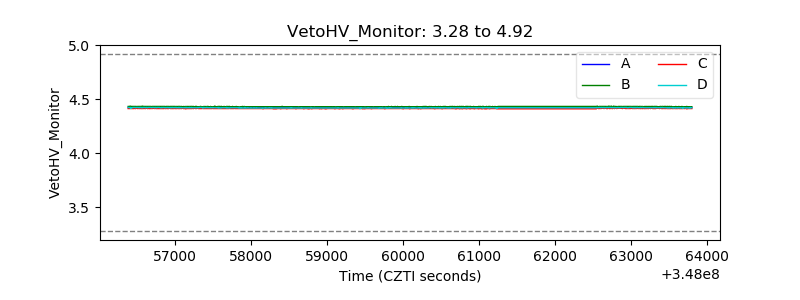 |
| Veto LLD | 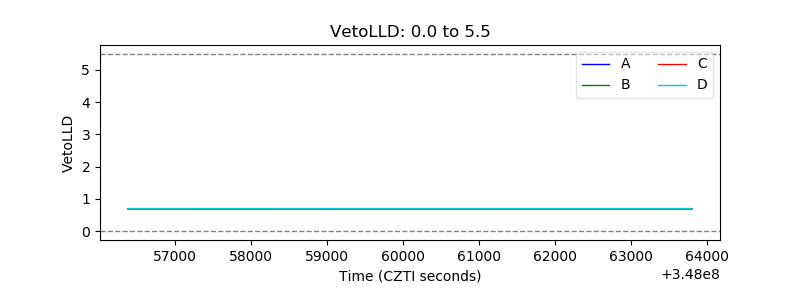 |
| Alpha Counter | 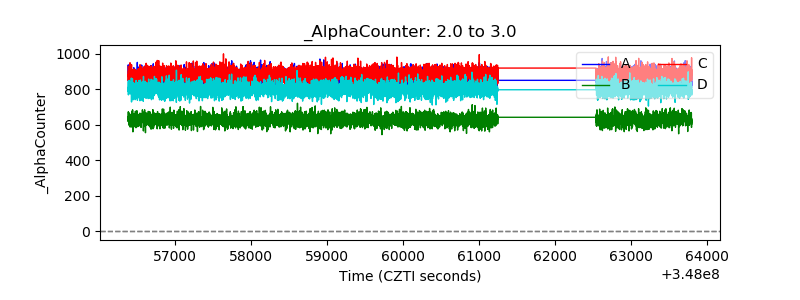 |
| _CPM_Rate | 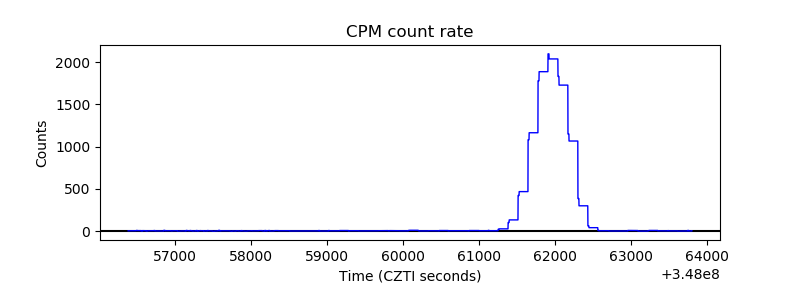 |
| CZT Counter | 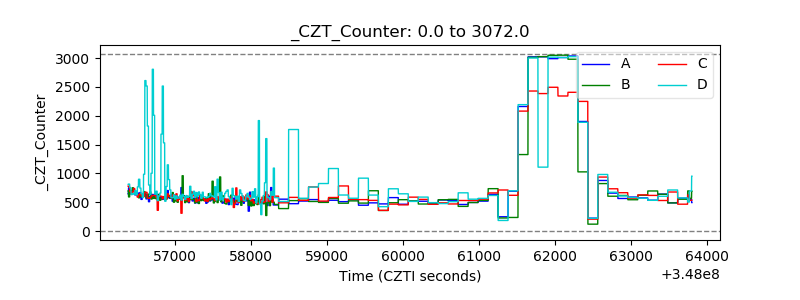 |
| +2.5 Volts monitor | 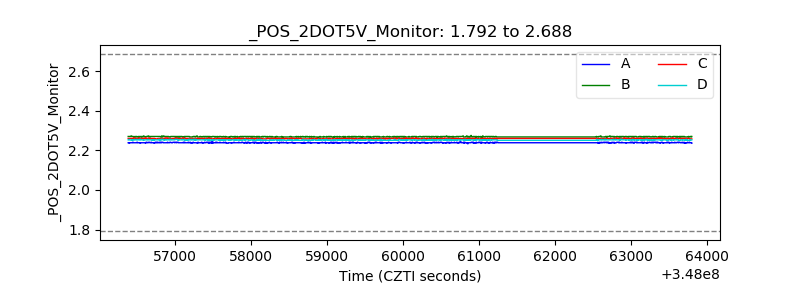 |
| +5 Volts monitor |  |
| _ROLL_ROT | 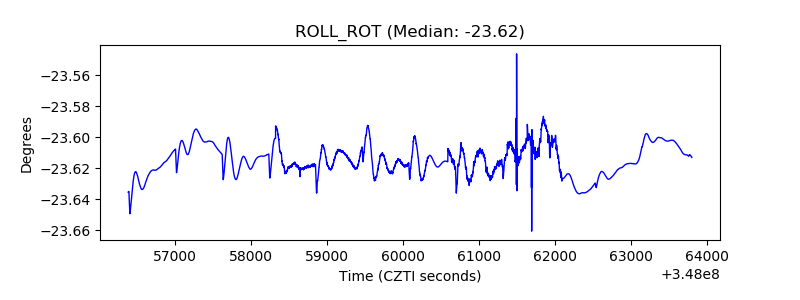 |
| _Roll_DEC | 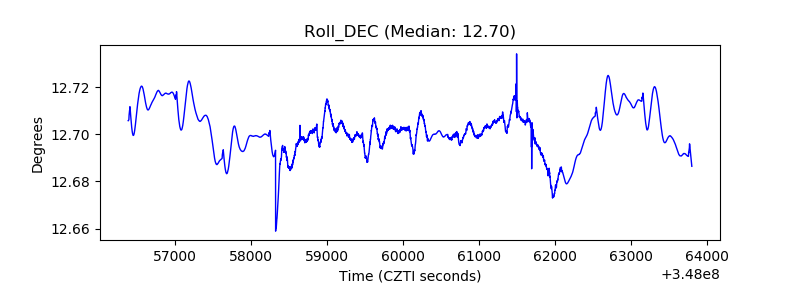 |
| _Roll_RA | 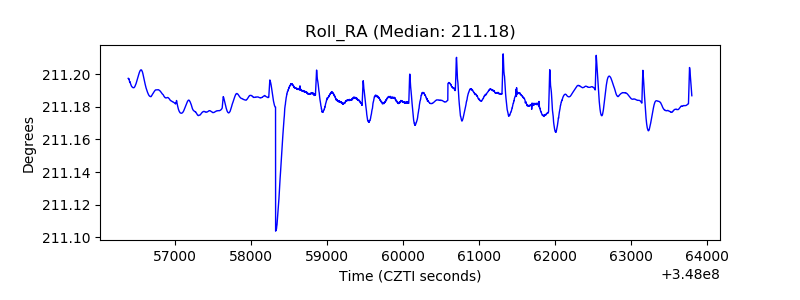 |
| Veto Counter | 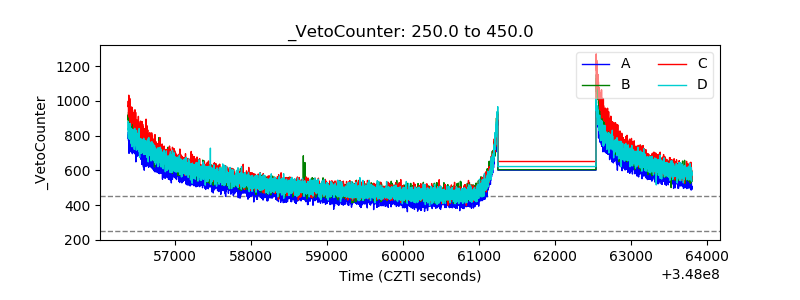 |