| Param | Original file | Final file |
|---|---|---|
| Filename | modeM0/AS1A10_045T06_9000004108_28604cztM0_level2.evt | modeM0/AS1A10_045T06_9000004108_28604cztM0_level2_quad_clean.evt |
| Size (bytes) | 562,772,160 | 70,346,880 |
| Size | 536.7 MB | 67.1 MB |
| Events in quadrant A | 3,595,077 | 422,013 |
| Events in quadrant B | 3,584,251 | 426,972 |
| Events in quadrant C | 3,635,522 | 415,319 |
| Events in quadrant D | 5,777,152 | 400,914 |
| Mode M9 | |||
|---|---|---|---|
| Quadrant | BADHDUFLAG | Total packets | Discarded packets |
| A | 0 | 11 | 0 |
| B | 0 | 12 | 0 |
| C | 0 | 12 | 0 |
| D | 0 | 12 | 0 |
| Mode M0 | |||
|---|---|---|---|
| Quadrant | BADHDUFLAG | Total packets | Discarded packets |
| A | 0 | 14605 | 2 |
| B | 0 | 14497 | 2 |
| C | 0 | 14660 | 2 |
| D | 0 | 21756 | 2 |
| Mode SS | |||
|---|---|---|---|
| Quadrant | BADHDUFLAG | Total packets | Discarded packets |
| A | 0 | 136 | 0 |
| B | 0 | 136 | 0 |
| C | 0 | 136 | 0 |
| D | 0 | 136 | 0 |
| Quadrant | Total seconds | Saturated seconds | Saturation percentage |
|---|---|---|---|
| A | 6665 | 106 | 1.590398% |
| B | 6665 | 111 | 1.665416% |
| C | 6664 | 159 | 2.385954% |
| D | 6664 | 418 | 6.272509% |
Noise dominated data is calculated using 1-second bins in cleaned event files. If a bin has >2000 counts, and if more than 50% of those come from <1% of pixels, then it is considered to be noise-dominated and hence unusable.
| Quadrant | # 1 sec bins | Bins with >0 counts | Bins with >2000 counts | High rate bins dominated by noise | Noise dominated (total time) | Noise dominated (detector-on time) | Marked lightcurve |
|---|---|---|---|---|---|---|---|
| A | 7805 | 6665 | 0 | 0 | 0.00% | 0.00% | 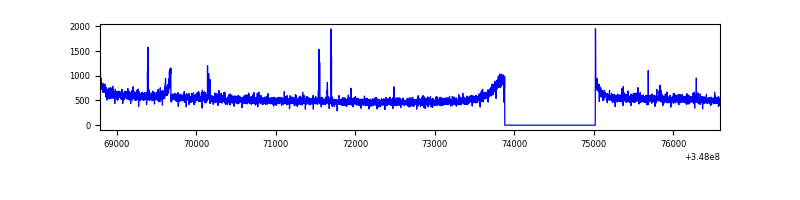 |
| B | 7805 | 6665 | 1 | 1 | 0.01% | 0.02% | 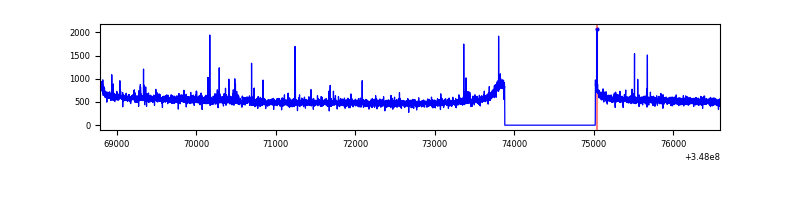 |
| C | 7804 | 6664 | 6 | 6 | 0.08% | 0.09% | 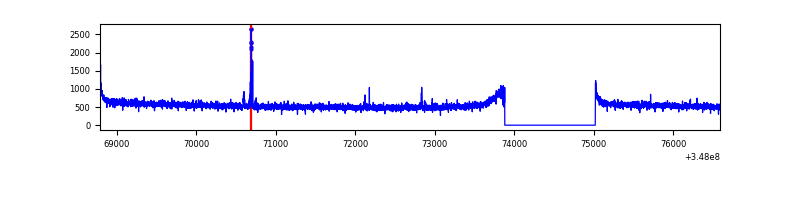 |
| D | 7804 | 6664 | 286 | 286 | 3.66% | 4.29% | 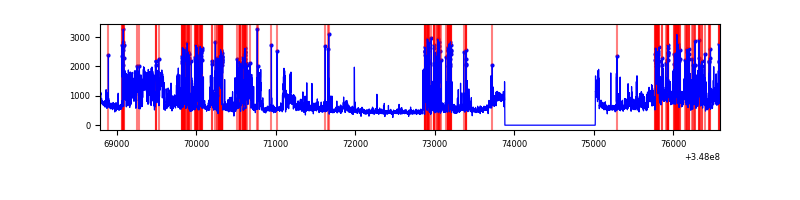 |
Top three noisy pixels from each quadrant. If the there are fewer than three noisy pixels in the level2.evt file, extra rows are filled as -1
| Pixel properties | Quadrant properties | ||||||
|---|---|---|---|---|---|---|---|
| Quadrant | DetID | PixID | Counts | Sigma | Mean | Median | Sigma |
| A | 15 | 174 | 52398 | 283.83 | 912 | 895 | 181.5 |
| A | 13 | 254 | 11597 | 58.98 | 912 | 895 | 181.5 |
| A | 15 | 47 | 11072 | 56.08 | 912 | 895 | 181.5 |
| B | 10 | 245 | 40615 | 235.18 | 896 | 875 | 169.0 |
| B | 12 | 111 | 20254 | 114.68 | 896 | 875 | 169.0 |
| B | 11 | 111 | 18514 | 104.39 | 896 | 875 | 169.0 |
| C | 14 | 238 | 142833 | 697.32 | 876 | 883 | 203.6 |
| C | 7 | 247 | 31221 | 149.03 | 876 | 883 | 203.6 |
| C | 0 | 207 | 24539 | 116.21 | 876 | 883 | 203.6 |
| D | 1 | 52 | 1934188 | 9292.56 | 877 | 857 | 208.1 |
| D | 8 | 195 | 418625 | 2008.0 | 877 | 857 | 208.1 |
| D | 2 | 250 | 40974 | 192.82 | 877 | 857 | 208.1 |
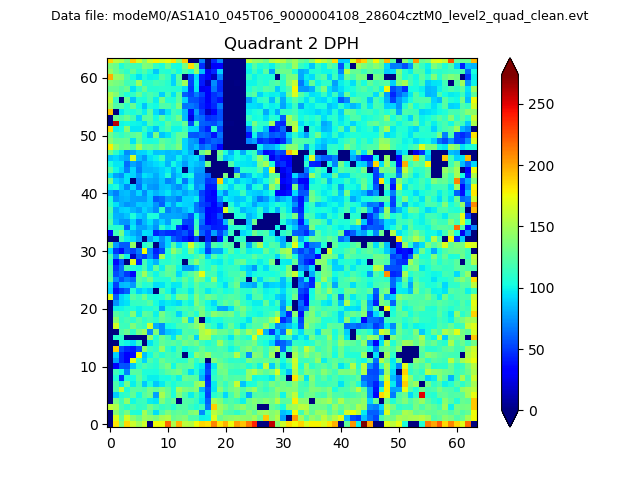
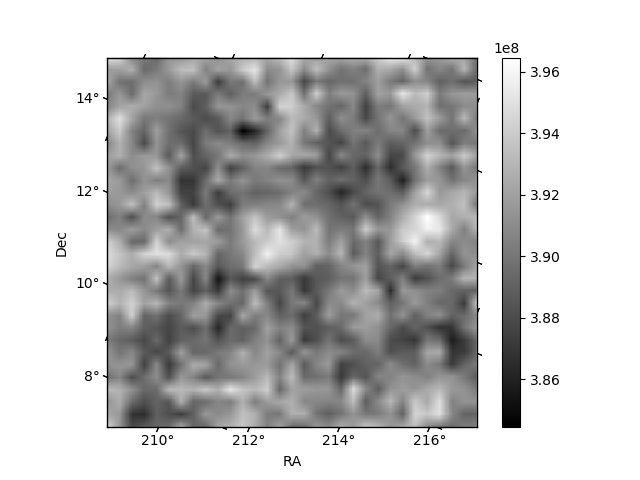
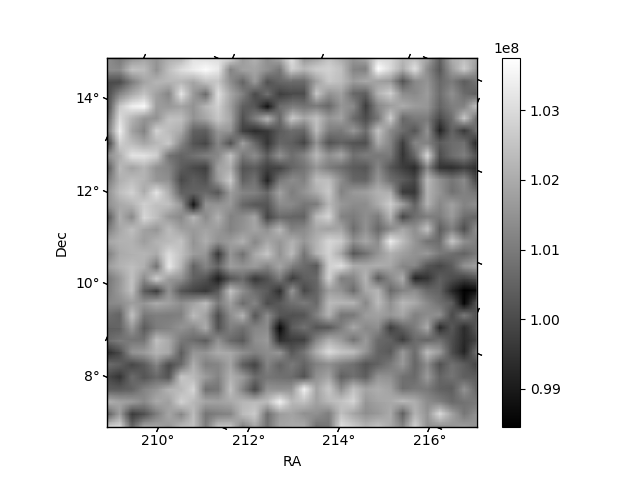
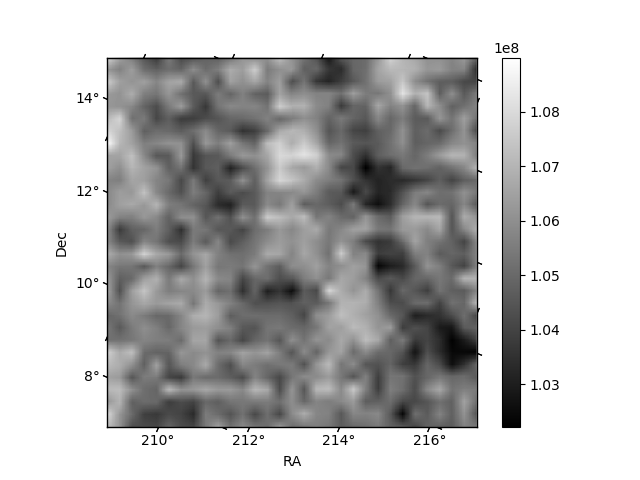
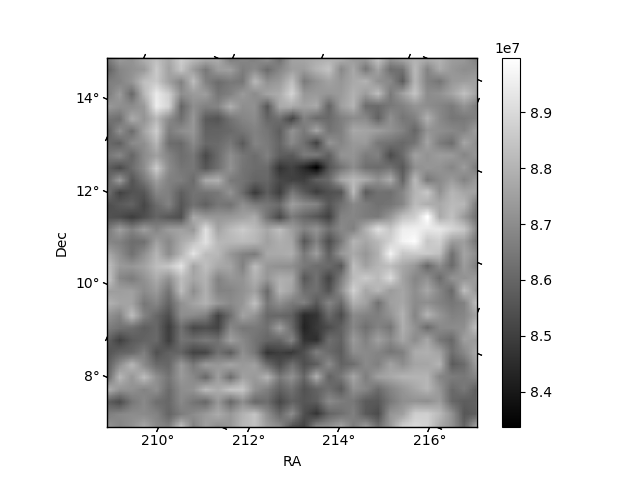
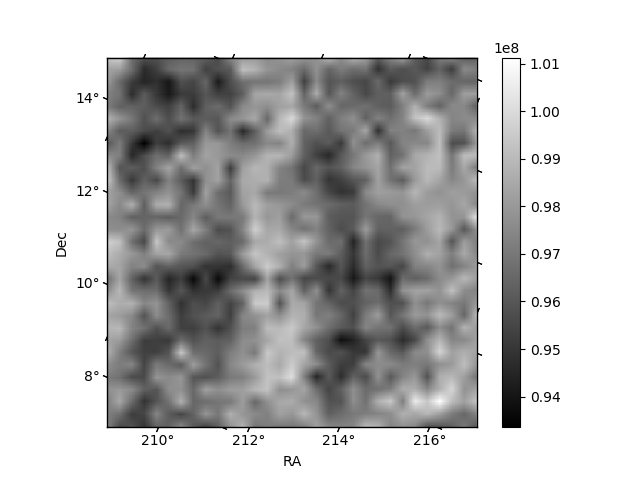
Histogram calculated using DETX and DETY for each event in the final _common_clean file
| Quadrant A | 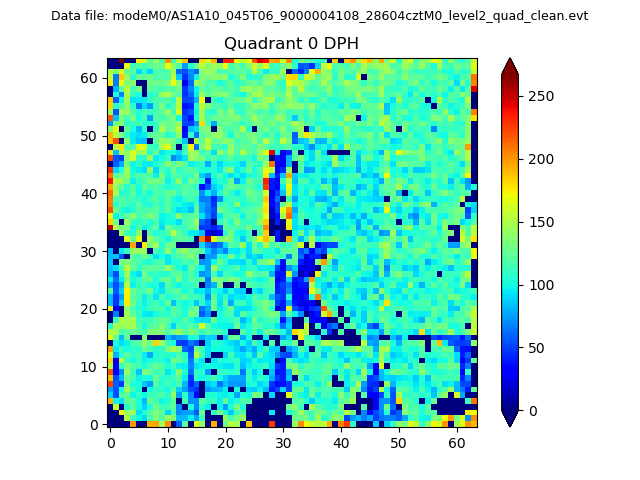 |
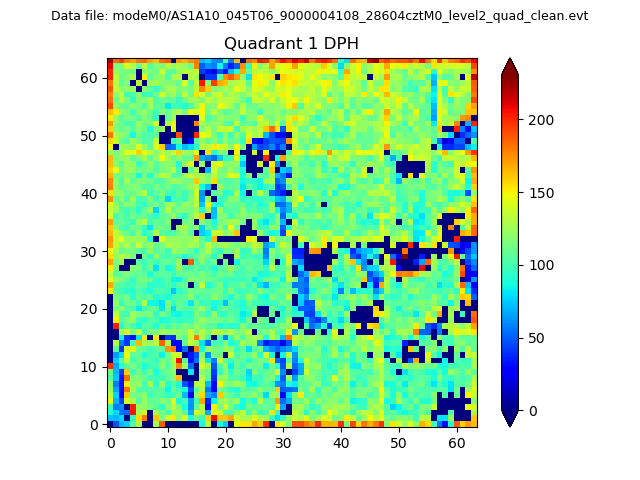 |
Quadrant B |
|---|---|---|---|
| Quadrant D | 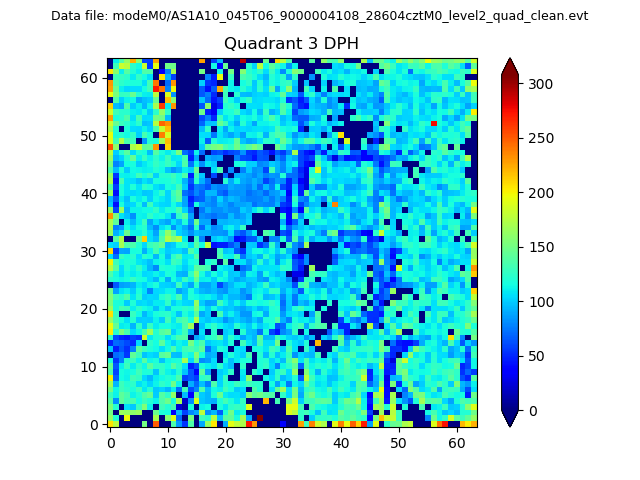 |
 |
Quadrant C |
| Plot type | Count rate plots | Images |
|---|---|---|
| Comparison with Poisson distribution Blue bars denote a histogram of data divided into 1 sec bins. Red curve is a Poisson curve with rate = median count rate of data. |
 |
 |
| Quadrant-wise count rates Data is divided into 100 sec bins |
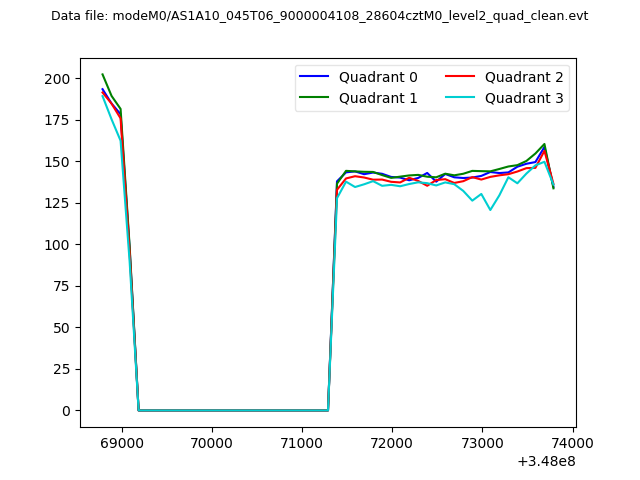 |
|
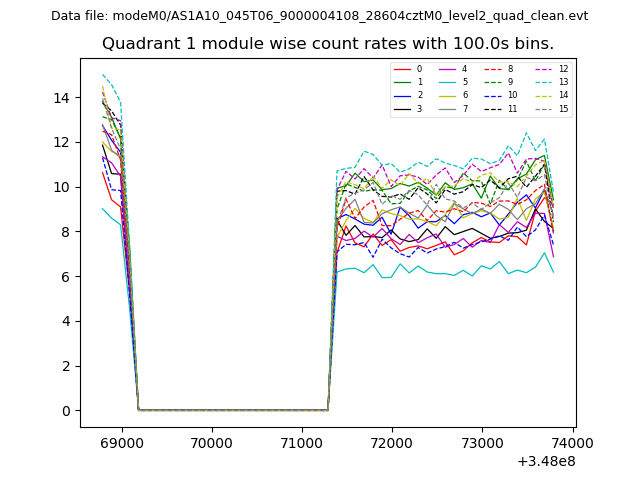
| Module-wise count rates for Quadrant A Data is divided into 100 sec bins |
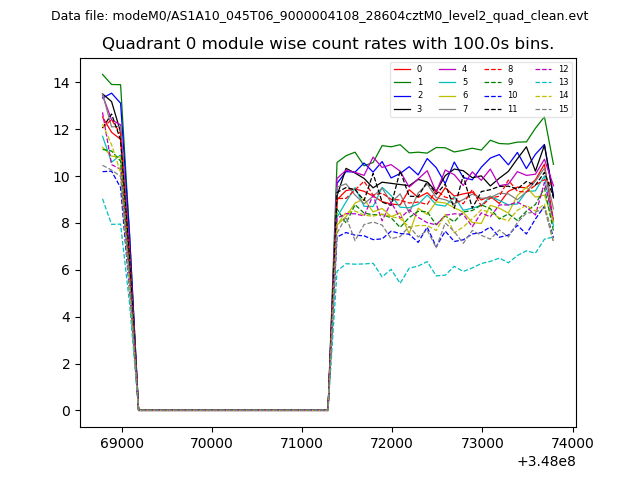 |
 |
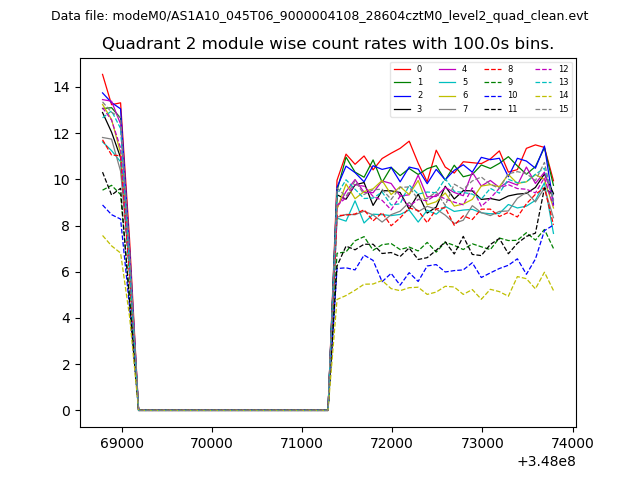
| Module-wise count rates for Quadrant B Data is divided into 100 sec bins |
 |
 |
| Module-wise count rates for Quadrant C Data is divided into 100 sec bins |
 |
 |
| Module-wise count rates for Quadrant D Data is divided into 100 sec bins |
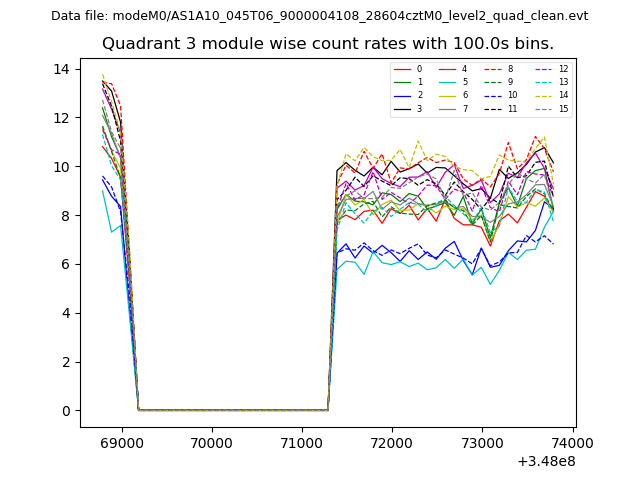 |
 |
| Parameter | Plot |
|---|---|
| CZT HV Monitor | 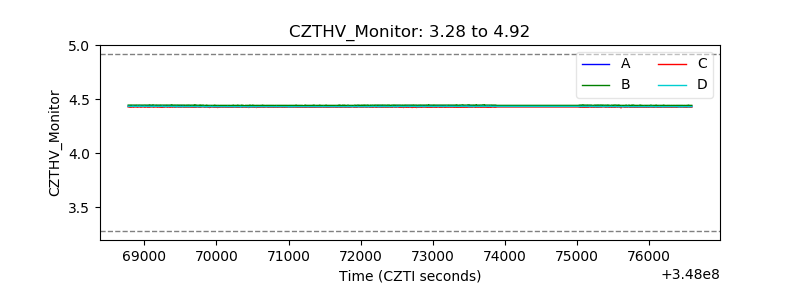 |
| D_VDD | 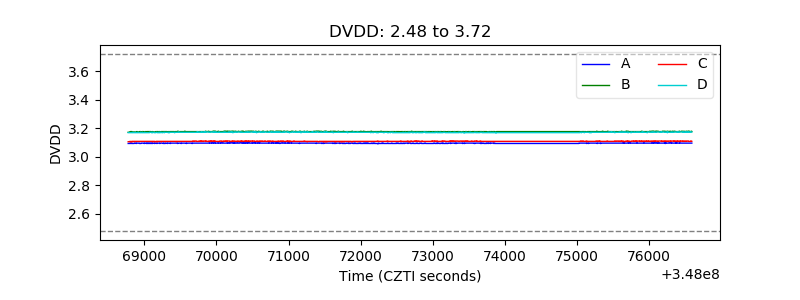 |
| Temperature 1 | 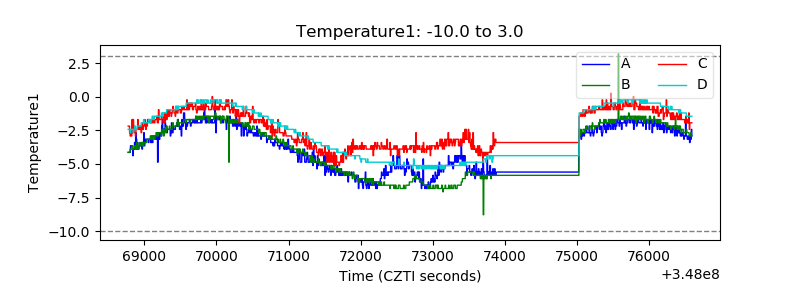 |
| Veto HV Monitor | 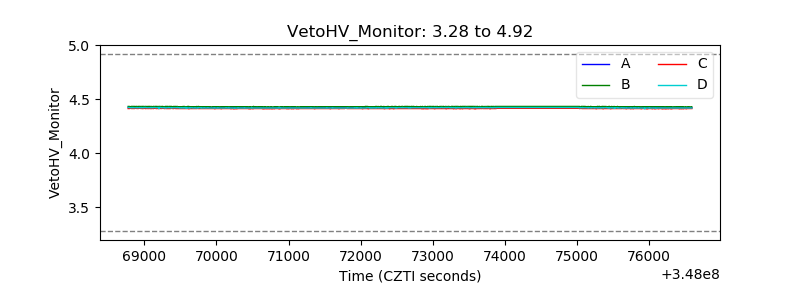 |
| Veto LLD | 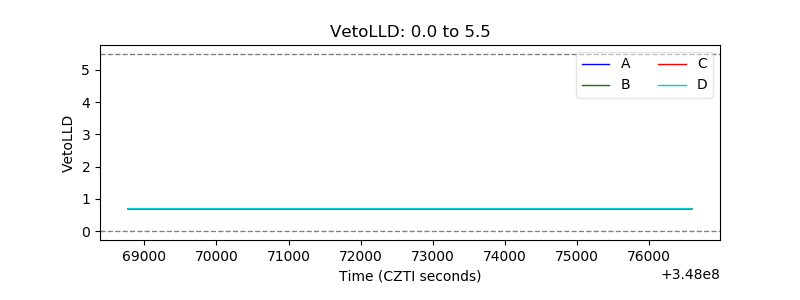 |
| Alpha Counter | 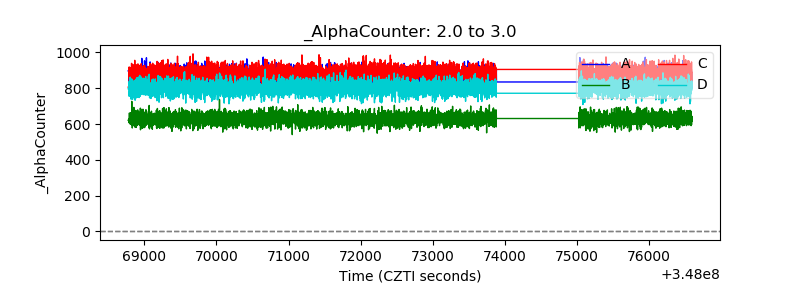 |
| _CPM_Rate | 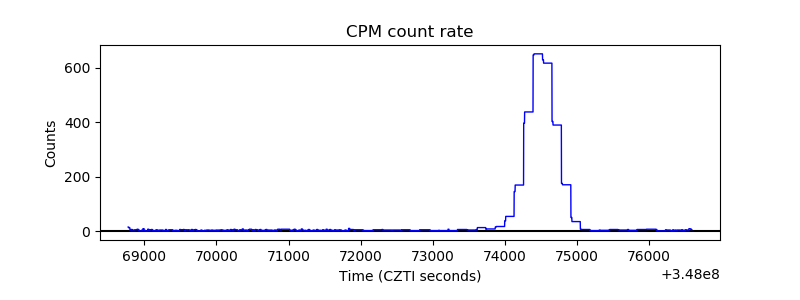 |
| CZT Counter | 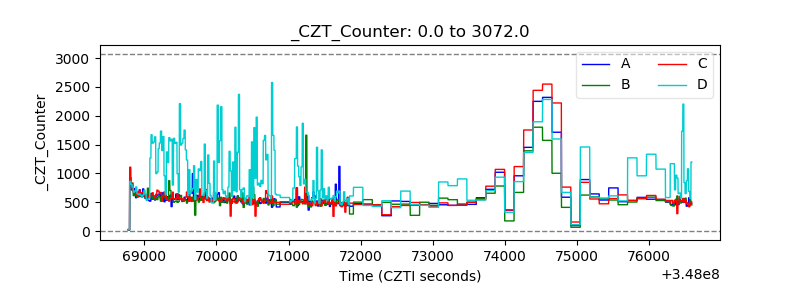 |
| +2.5 Volts monitor | 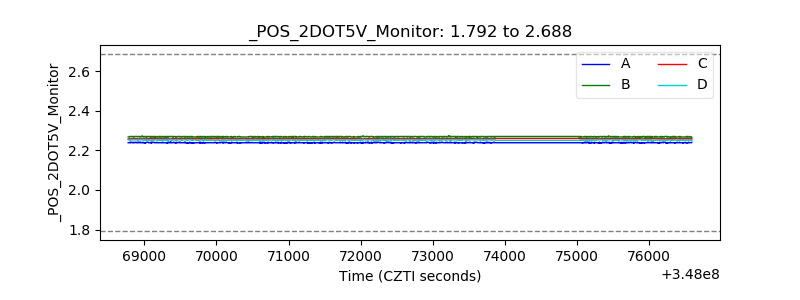 |
| +5 Volts monitor |  |
| _ROLL_ROT | 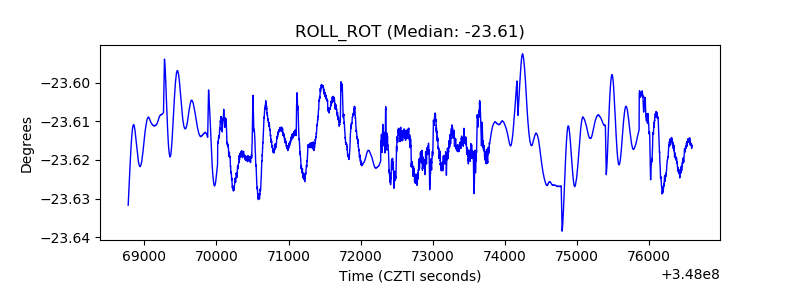 |
| _Roll_DEC |  |
| _Roll_RA | 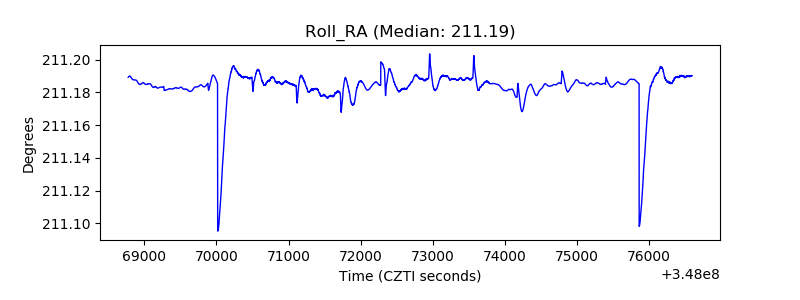 |
| Veto Counter | 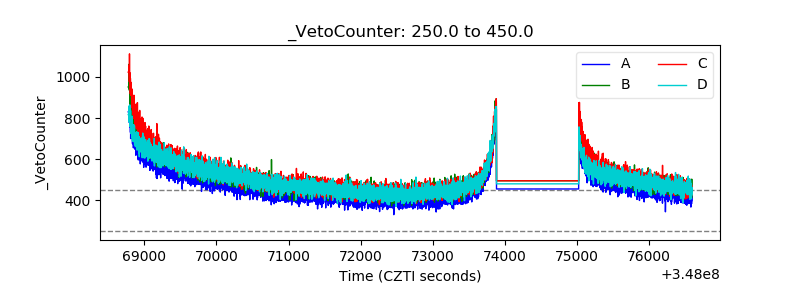 |