| Param | Original file | Final file |
|---|---|---|
| Filename | modeM0/AS1A10_045T06_9000004108_28606cztM0_level2.evt | modeM0/AS1A10_045T06_9000004108_28606cztM0_level2_quad_clean.evt |
| Size (bytes) | 505,848,960 | 77,333,760 |
| Size | 482.4 MB | 73.8 MB |
| Events in quadrant A | 3,615,858 | 471,329 |
| Events in quadrant B | 3,337,083 | 477,371 |
| Events in quadrant C | 3,372,791 | 464,270 |
| Events in quadrant D | 4,534,788 | 457,270 |
| Mode M9 | |||
|---|---|---|---|
| Quadrant | BADHDUFLAG | Total packets | Discarded packets |
| A | 0 | 4 | 0 |
| B | 0 | 4 | 0 |
| C | 0 | 4 | 0 |
| D | 0 | 4 | 0 |
| Mode M0 | |||
|---|---|---|---|
| Quadrant | BADHDUFLAG | Total packets | Discarded packets |
| A | 0 | 14937 | 1 |
| B | 0 | 14102 | 1 |
| C | 0 | 14025 | 1 |
| D | 0 | 18086 | 2 |
| Mode SS | |||
|---|---|---|---|
| Quadrant | BADHDUFLAG | Total packets | Discarded packets |
| A | 0 | 138 | 0 |
| B | 0 | 138 | 0 |
| C | 0 | 138 | 0 |
| D | 0 | 138 | 0 |
| Quadrant | Total seconds | Saturated seconds | Saturation percentage |
|---|---|---|---|
| A | 6762 | 157 | 2.321798% |
| B | 6762 | 77 | 1.138716% |
| C | 6762 | 113 | 1.671103% |
| D | 6762 | 164 | 2.425318% |
Noise dominated data is calculated using 1-second bins in cleaned event files. If a bin has >2000 counts, and if more than 50% of those come from <1% of pixels, then it is considered to be noise-dominated and hence unusable.
| Quadrant | # 1 sec bins | Bins with >0 counts | Bins with >2000 counts | High rate bins dominated by noise | Noise dominated (total time) | Noise dominated (detector-on time) | Marked lightcurve |
|---|---|---|---|---|---|---|---|
| A | 7222 | 6763 | 97 | 97 | 1.34% | 1.43% | 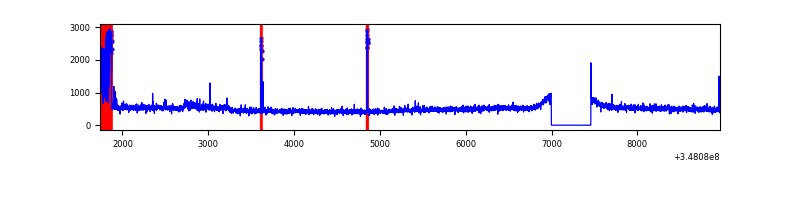 |
| B | 7222 | 6762 | 1 | 1 | 0.01% | 0.01% | 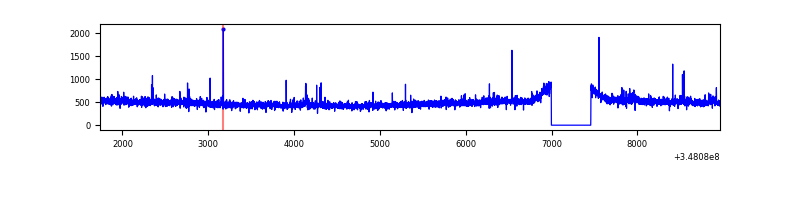 |
| C | 7222 | 6762 | 0 | 0 | 0.00% | 0.00% |  |
| D | 7222 | 6763 | 90 | 90 | 1.25% | 1.33% | 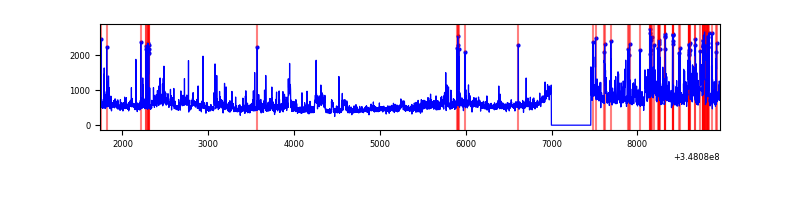 |
Top three noisy pixels from each quadrant. If the there are fewer than three noisy pixels in the level2.evt file, extra rows are filled as -1
| Pixel properties | Quadrant properties | ||||||
|---|---|---|---|---|---|---|---|
| Quadrant | DetID | PixID | Counts | Sigma | Mean | Median | Sigma |
| A | 15 | 174 | 260835 | 1528.36 | 839 | 820 | 170.1 |
| A | 15 | 47 | 112859 | 658.56 | 839 | 820 | 170.1 |
| A | 13 | 254 | 12753 | 70.14 | 839 | 820 | 170.1 |
| B | 12 | 111 | 19795 | 118.95 | 837 | 815 | 159.6 |
| B | 11 | 111 | 17865 | 106.85 | 837 | 815 | 159.6 |
| B | 14 | 111 | 16065 | 95.57 | 837 | 815 | 159.6 |
| C | 14 | 238 | 131850 | 681.53 | 813 | 818 | 192.3 |
| C | 3 | 233 | 26260 | 132.33 | 813 | 818 | 192.3 |
| C | 7 | 247 | 19745 | 98.44 | 813 | 818 | 192.3 |
| D | 8 | 195 | 694866 | 3560.2 | 818 | 796 | 195.0 |
| D | 1 | 52 | 392729 | 2010.4 | 818 | 796 | 195.0 |
| D | 2 | 250 | 113228 | 576.71 | 818 | 796 | 195.0 |
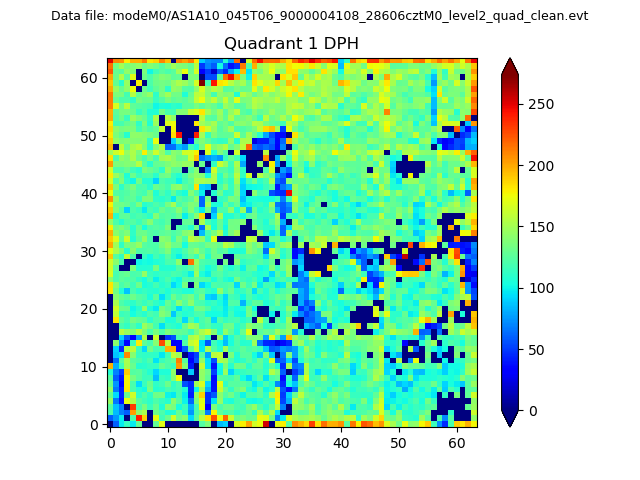
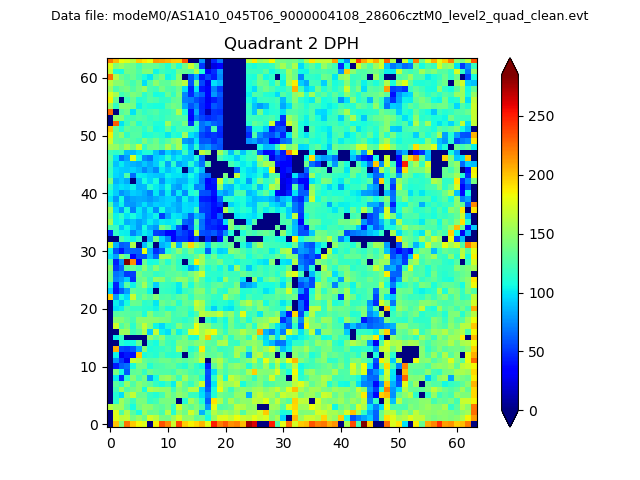
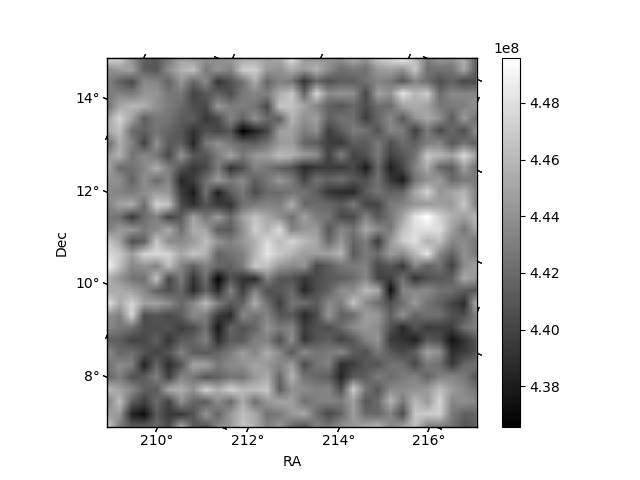
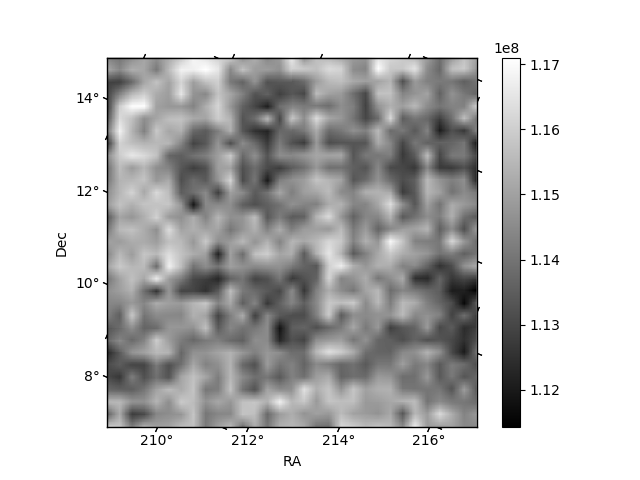
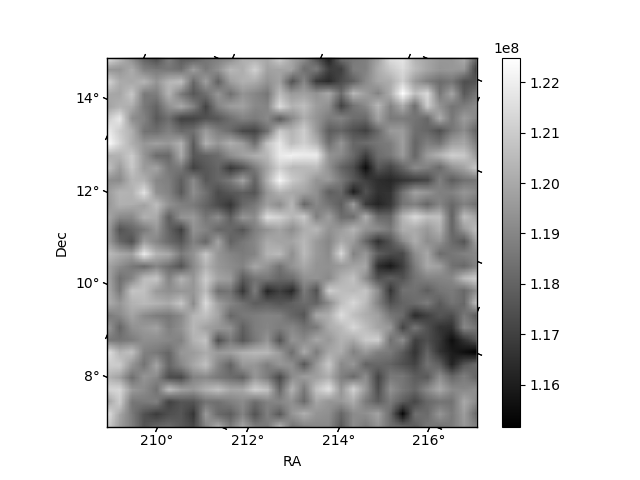
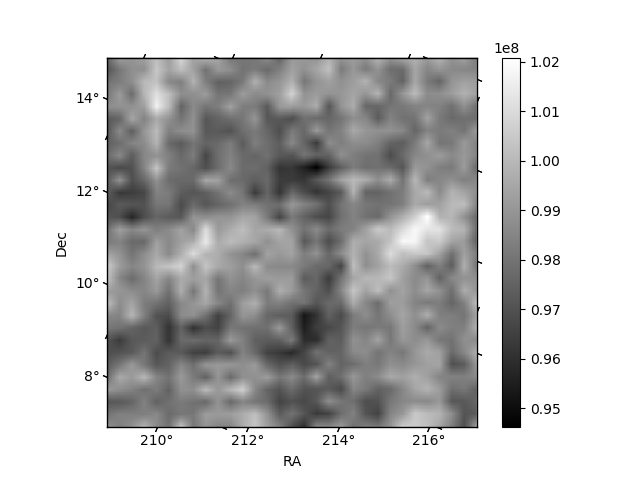
Histogram calculated using DETX and DETY for each event in the final _common_clean file
| Quadrant A | 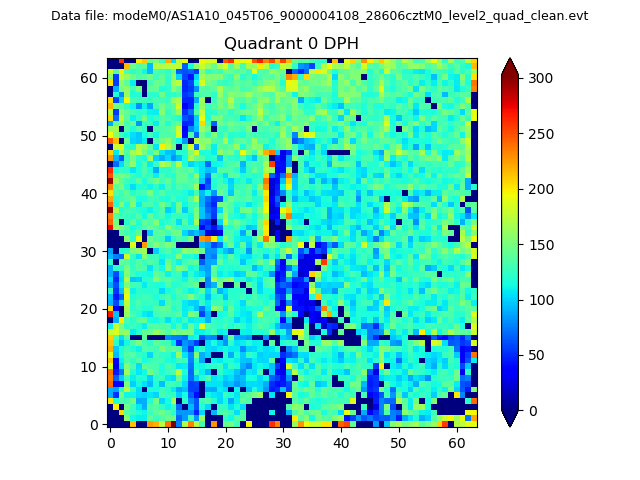 |
 |
Quadrant B |
|---|---|---|---|
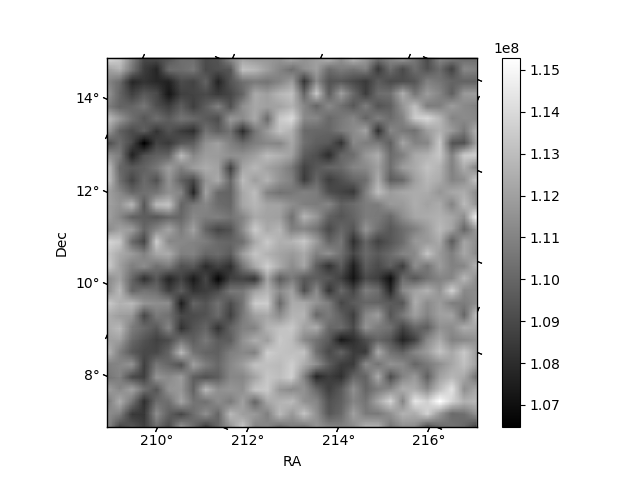
| Quadrant D | 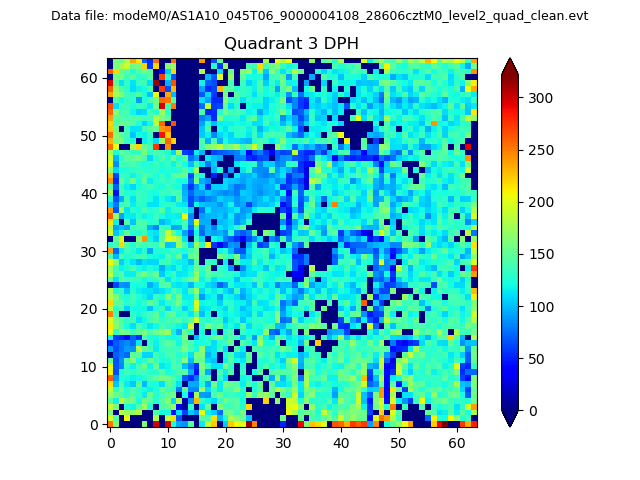 |
 |
Quadrant C |
| Plot type | Count rate plots | Images |
|---|---|---|
| Comparison with Poisson distribution Blue bars denote a histogram of data divided into 1 sec bins. Red curve is a Poisson curve with rate = median count rate of data. |
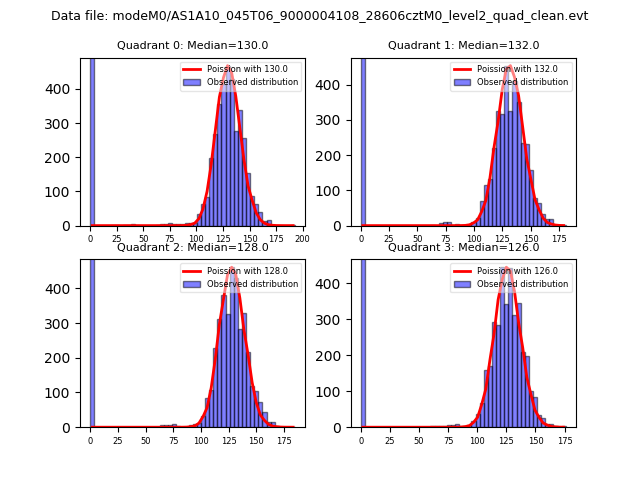 |
 |
| Quadrant-wise count rates Data is divided into 100 sec bins |
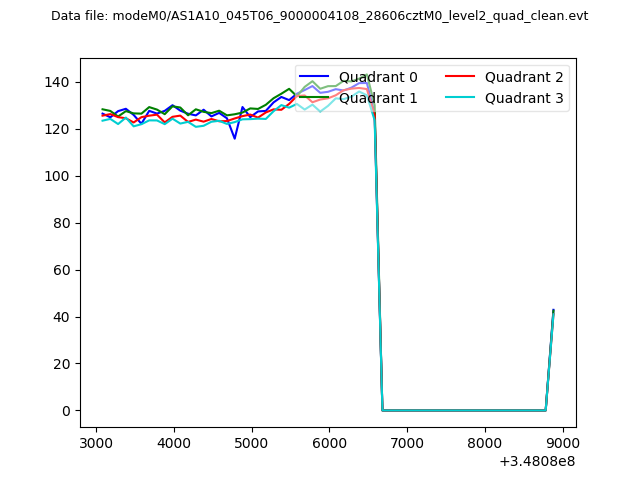 |
|
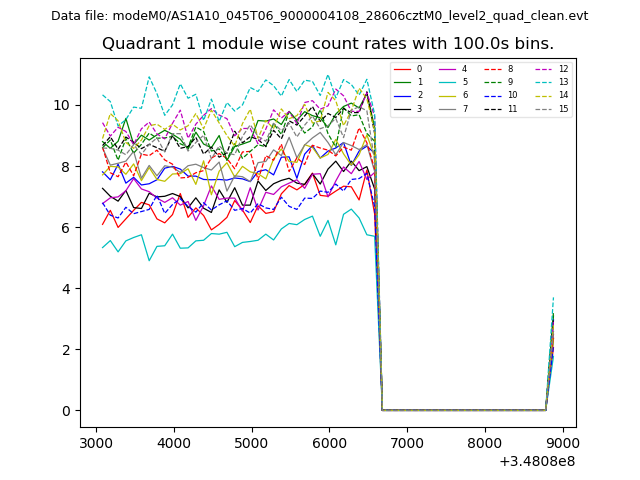
| Module-wise count rates for Quadrant A Data is divided into 100 sec bins |
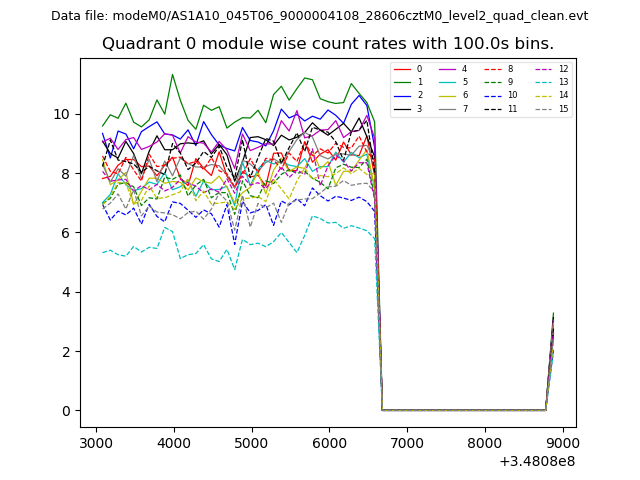 |
 |
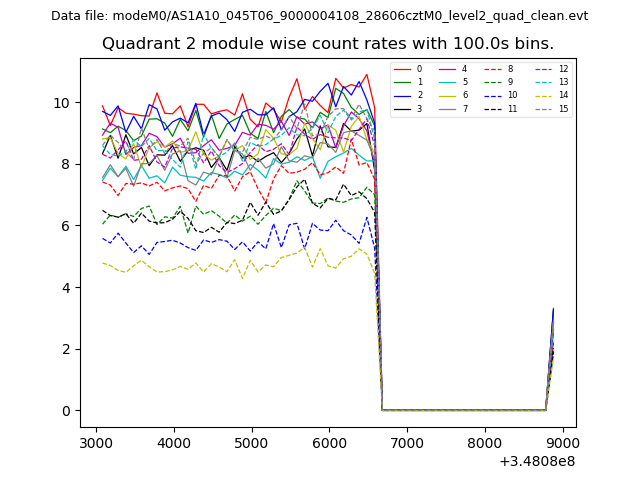
| Module-wise count rates for Quadrant B Data is divided into 100 sec bins |
 |
 |
| Module-wise count rates for Quadrant C Data is divided into 100 sec bins |
 |
 |
| Module-wise count rates for Quadrant D Data is divided into 100 sec bins |
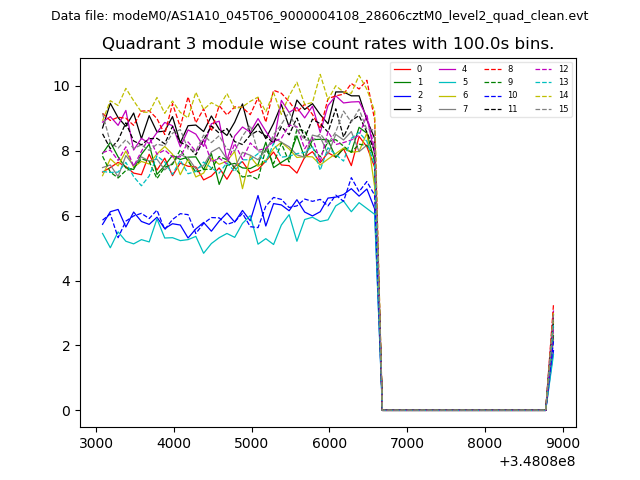 |
 |
| Parameter | Plot |
|---|---|
| CZT HV Monitor | 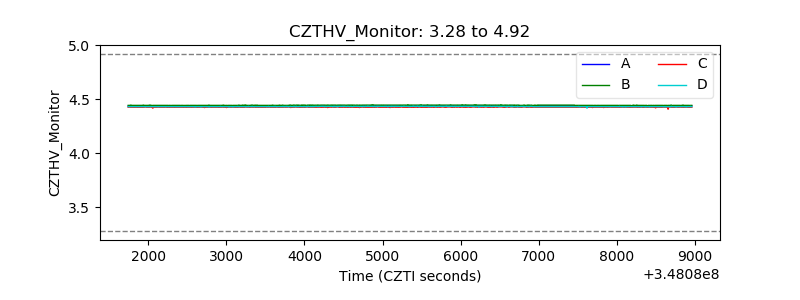 |
| D_VDD | 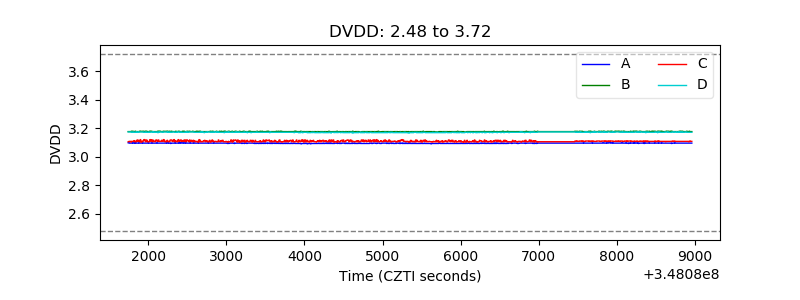 |
| Temperature 1 | 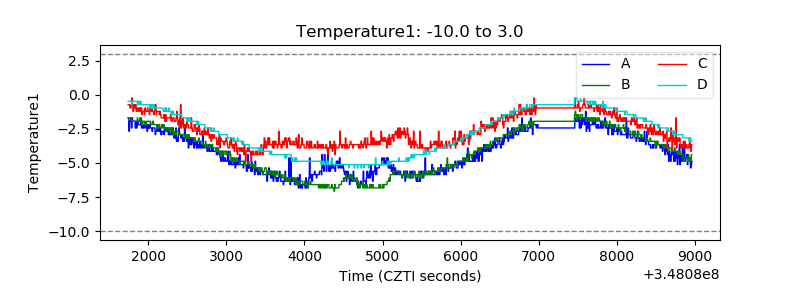 |
| Veto HV Monitor | 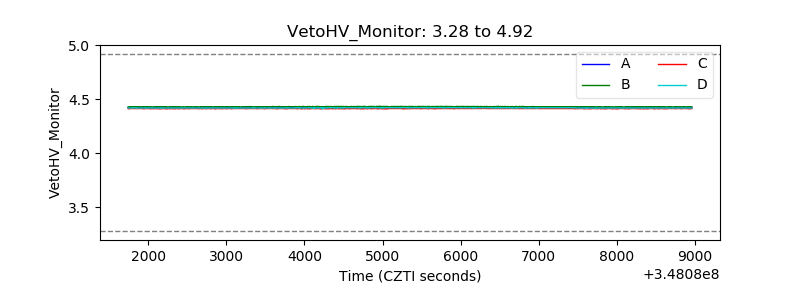 |
| Veto LLD | 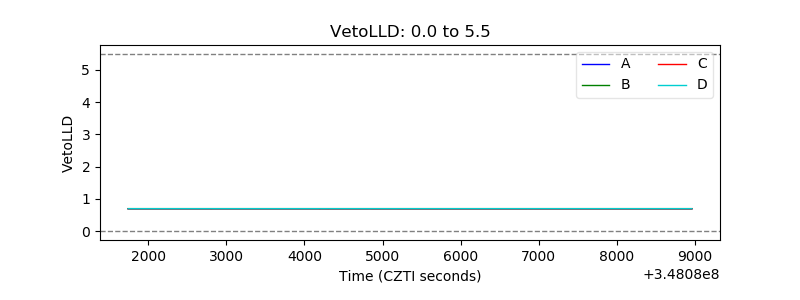 |
| Alpha Counter | 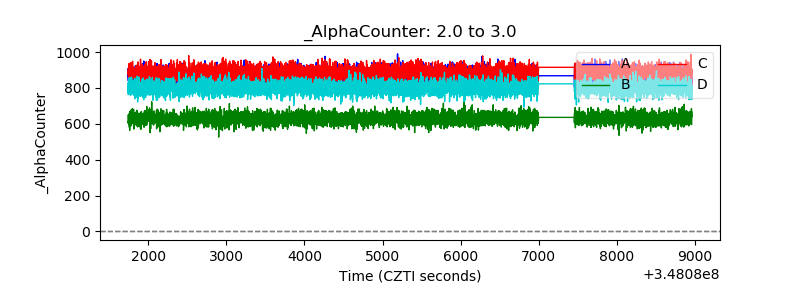 |
| _CPM_Rate | 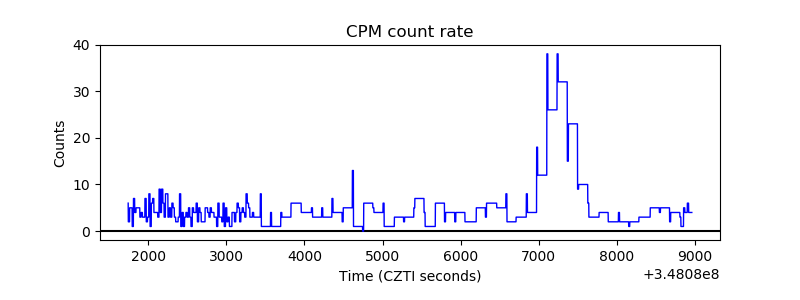 |
| CZT Counter | 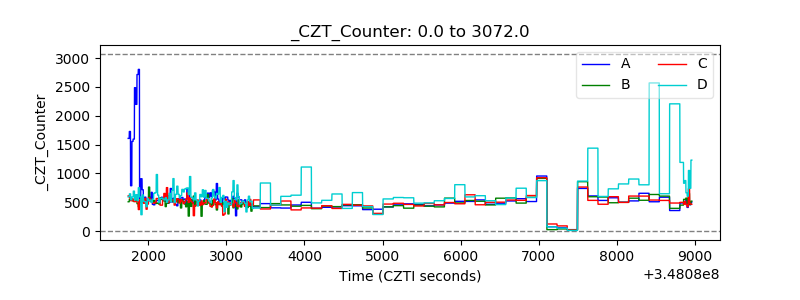 |
| +2.5 Volts monitor |  |
| +5 Volts monitor | 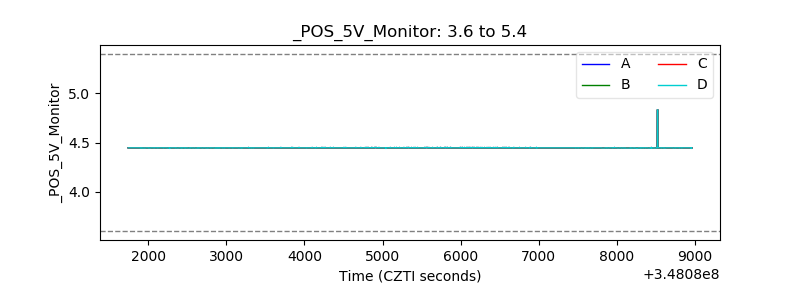 |
| _ROLL_ROT | 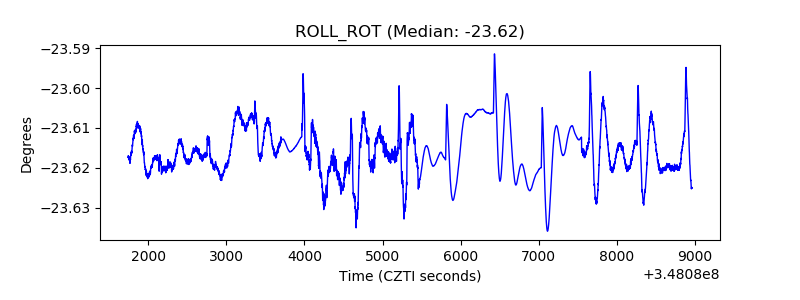 |
| _Roll_DEC | 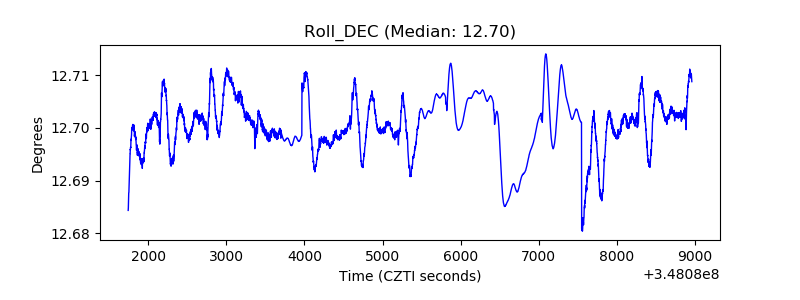 |
| _Roll_RA | 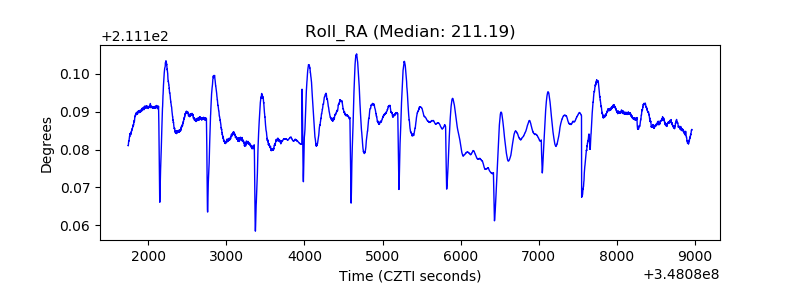 |
| Veto Counter | 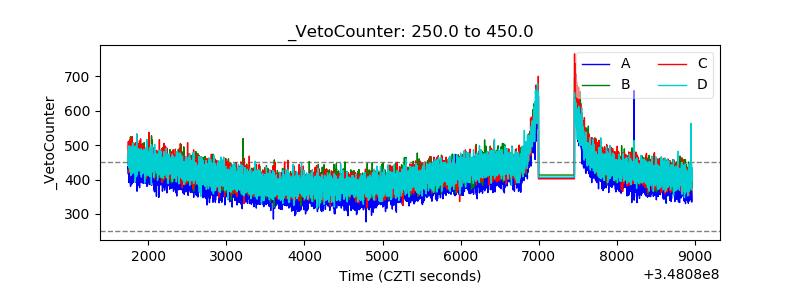 |