| Param | Original file | Final file |
|---|---|---|
| Filename | modeM0/AS1A10_045T06_9000004108_28607cztM0_level2.evt | modeM0/AS1A10_045T06_9000004108_28607cztM0_level2_quad_clean.evt |
| Size (bytes) | 648,400,320 | 83,802,240 |
| Size | 618.4 MB | 79.9 MB |
| Events in quadrant A | 3,882,502 | 509,511 |
| Events in quadrant B | 3,868,929 | 513,960 |
| Events in quadrant C | 3,910,847 | 498,891 |
| Events in quadrant D | 7,455,095 | 481,535 |
| Mode M9 | |||
|---|---|---|---|
| Quadrant | BADHDUFLAG | Total packets | Discarded packets |
| A | 0 | 6 | 0 |
| B | 0 | 6 | 0 |
| C | 0 | 6 | 0 |
| D | 0 | 6 | 0 |
| Mode M0 | |||
|---|---|---|---|
| Quadrant | BADHDUFLAG | Total packets | Discarded packets |
| A | 0 | 16542 | 3 |
| B | 0 | 16335 | 3 |
| C | 0 | 16354 | 3 |
| D | 0 | 27538 | 3 |
| Mode SS | |||
|---|---|---|---|
| Quadrant | BADHDUFLAG | Total packets | Discarded packets |
| A | 0 | 160 | 0 |
| B | 0 | 160 | 0 |
| C | 0 | 160 | 0 |
| D | 0 | 160 | 0 |
| Quadrant | Total seconds | Saturated seconds | Saturation percentage |
|---|---|---|---|
| A | 7663 | 124 | 1.618165% |
| B | 7663 | 149 | 1.944408% |
| C | 7664 | 203 | 2.648747% |
| D | 7663 | 780 | 10.178781% |
Noise dominated data is calculated using 1-second bins in cleaned event files. If a bin has >2000 counts, and if more than 50% of those come from <1% of pixels, then it is considered to be noise-dominated and hence unusable.
| Quadrant | # 1 sec bins | Bins with >0 counts | Bins with >2000 counts | High rate bins dominated by noise | Noise dominated (total time) | Noise dominated (detector-on time) | Marked lightcurve |
|---|---|---|---|---|---|---|---|
| A | 8373 | 7666 | 16 | 16 | 0.19% | 0.21% | 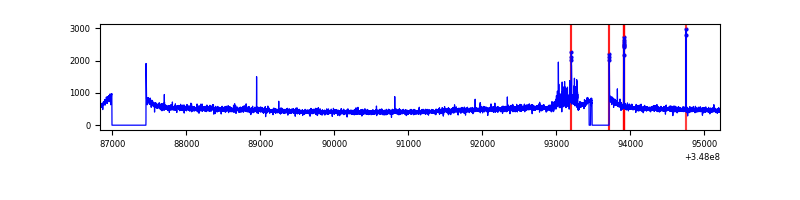 |
| B | 8373 | 7664 | 0 | 0 | 0.00% | 0.00% | 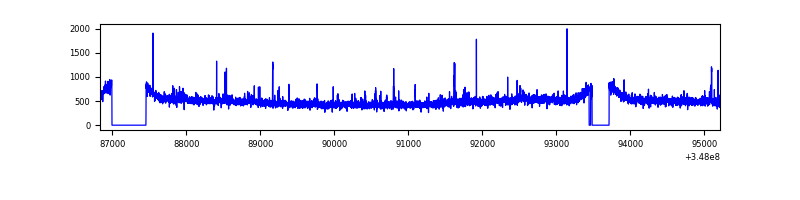 |
| C | 8374 | 7666 | 2 | 2 | 0.02% | 0.03% | 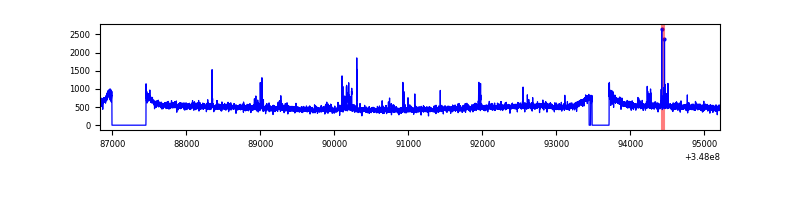 |
| D | 8373 | 7665 | 515 | 515 | 6.15% | 6.72% | 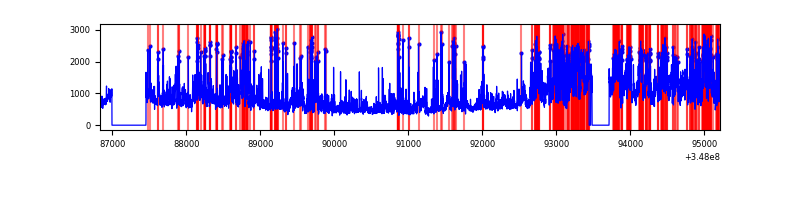 |
Top three noisy pixels from each quadrant. If the there are fewer than three noisy pixels in the level2.evt file, extra rows are filled as -1
| Pixel properties | Quadrant properties | ||||||
|---|---|---|---|---|---|---|---|
| Quadrant | DetID | PixID | Counts | Sigma | Mean | Median | Sigma |
| A | 15 | 47 | 118870 | 597.55 | 970 | 948 | 197.3 |
| A | 13 | 254 | 14667 | 69.52 | 970 | 948 | 197.3 |
| A | 8 | 192 | 13977 | 66.02 | 970 | 948 | 197.3 |
| B | 0 | 230 | 31725 | 164.9 | 960 | 934 | 186.7 |
| B | 10 | 245 | 28979 | 150.19 | 960 | 934 | 186.7 |
| B | 12 | 111 | 22902 | 117.65 | 960 | 934 | 186.7 |
| C | 14 | 238 | 150882 | 687.95 | 931 | 936 | 218.0 |
| C | 7 | 247 | 67510 | 305.44 | 931 | 936 | 218.0 |
| C | 3 | 233 | 31033 | 138.08 | 931 | 936 | 218.0 |
| D | 1 | 52 | 2126552 | 9543.73 | 915 | 889 | 222.7 |
| D | 8 | 195 | 1379223 | 6188.4 | 915 | 889 | 222.7 |
| D | 13 | 104 | 154262 | 688.61 | 915 | 889 | 222.7 |
Histogram calculated using DETX and DETY for each event in the final _common_clean file
| Quadrant A |  |
 |
Quadrant B |
|---|---|---|---|
| Quadrant D |  |
 |
Quadrant C |
| Plot type | Count rate plots | Images |
|---|---|---|
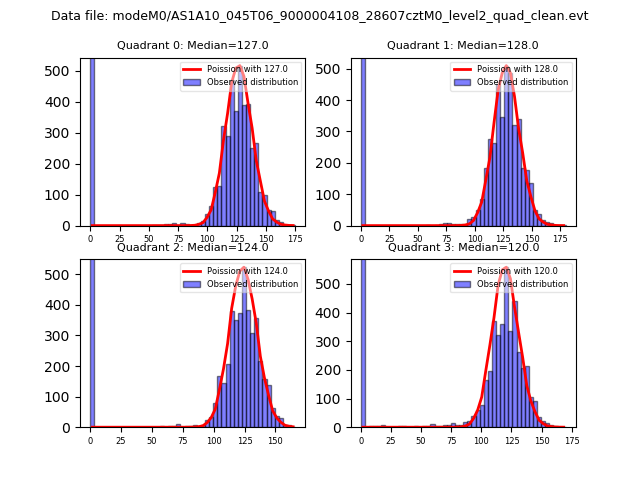
| Comparison with Poisson distribution Blue bars denote a histogram of data divided into 1 sec bins. Red curve is a Poisson curve with rate = median count rate of data. |
 |
 |
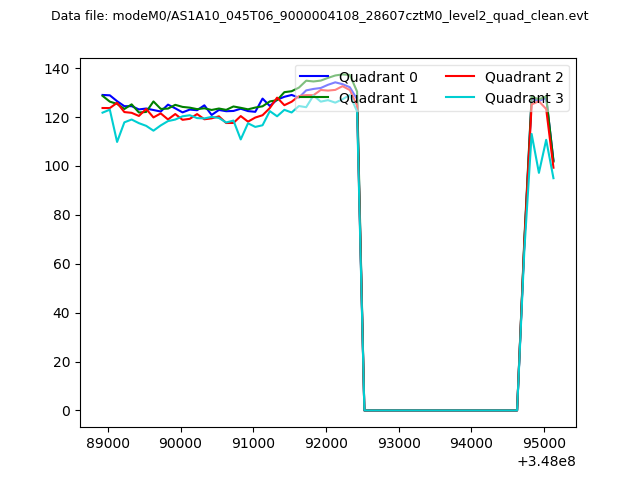
| Quadrant-wise count rates Data is divided into 100 sec bins |
 |
|
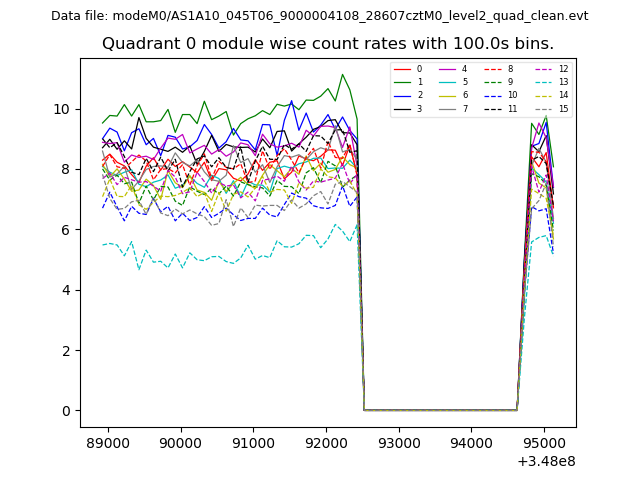
| Module-wise count rates for Quadrant A Data is divided into 100 sec bins |
 |
 |
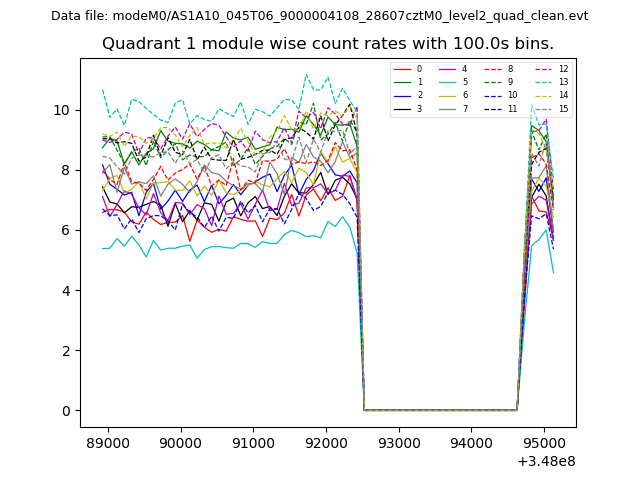
| Module-wise count rates for Quadrant B Data is divided into 100 sec bins |
 |
 |
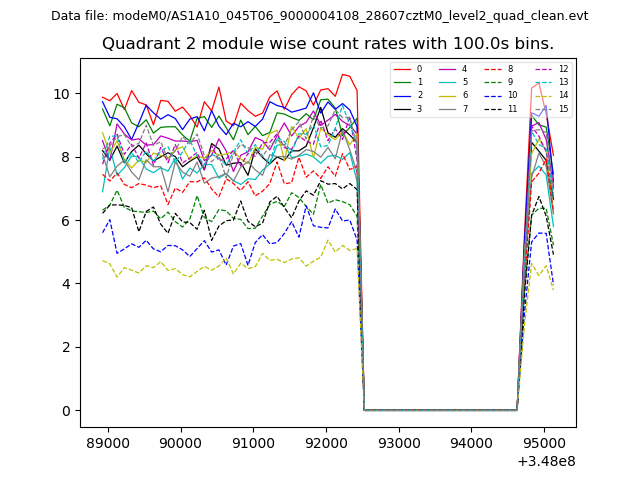
| Module-wise count rates for Quadrant C Data is divided into 100 sec bins |
 |
 |
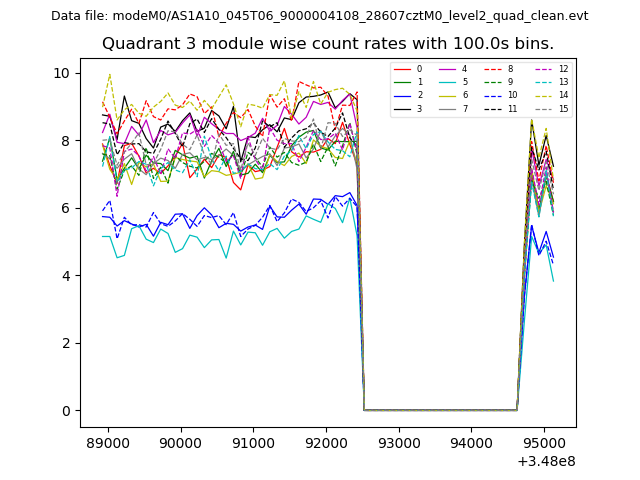
| Module-wise count rates for Quadrant D Data is divided into 100 sec bins |
 |
 |
| Parameter | Plot |
|---|---|
| CZT HV Monitor | 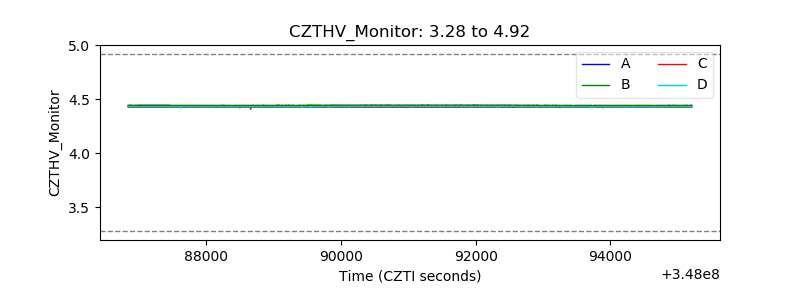 |
| D_VDD | 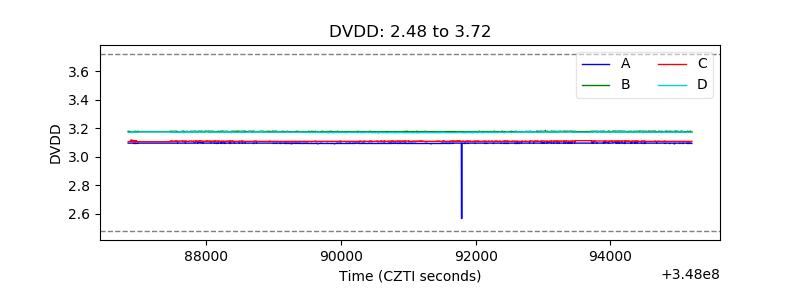 |
| Temperature 1 | 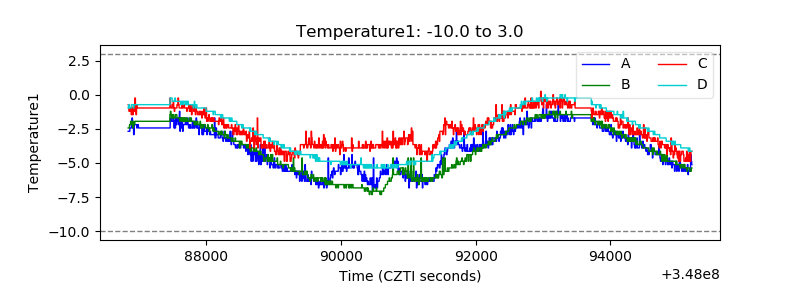 |
| Veto HV Monitor | 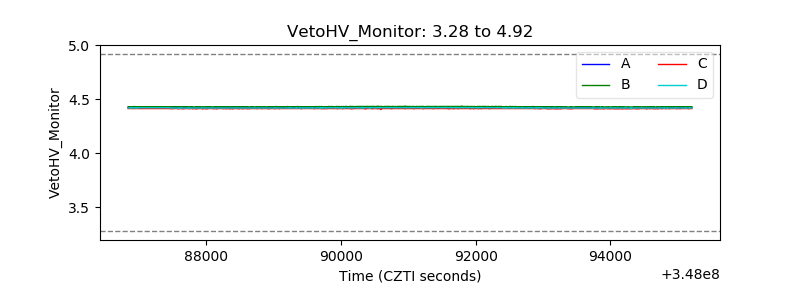 |
| Veto LLD | 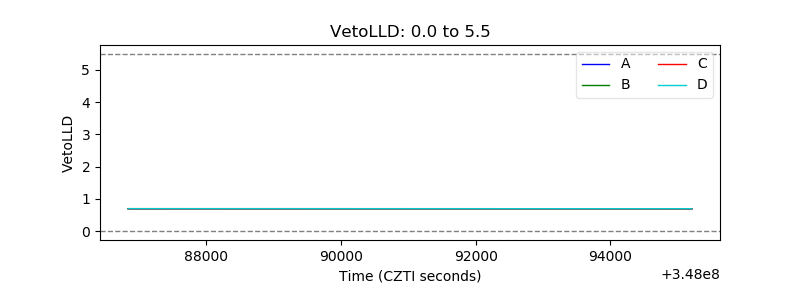 |
| Alpha Counter | 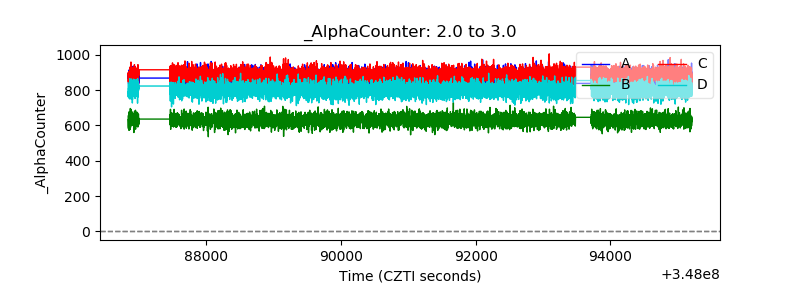 |
| _CPM_Rate | 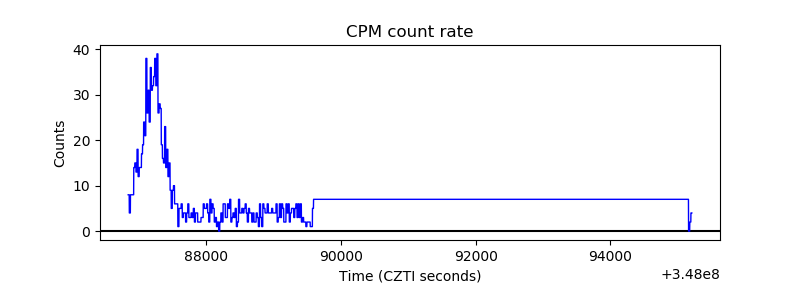 |
| CZT Counter |  |
| +2.5 Volts monitor |  |
| +5 Volts monitor |  |
| _ROLL_ROT | 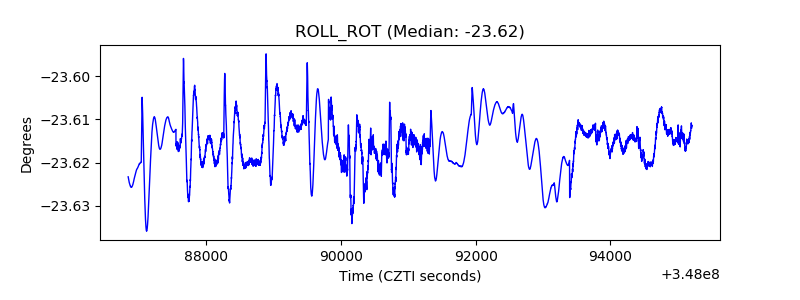 |
| _Roll_DEC | 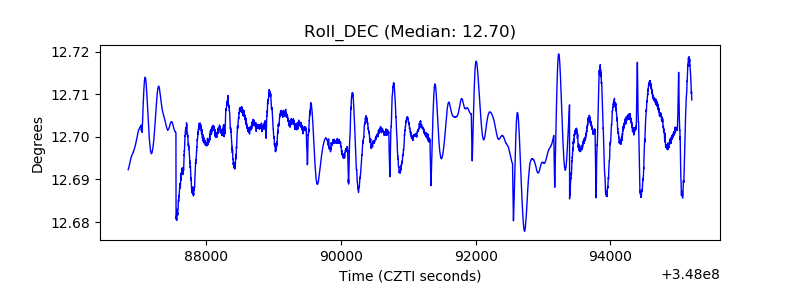 |
| _Roll_RA |  |
| Veto Counter | 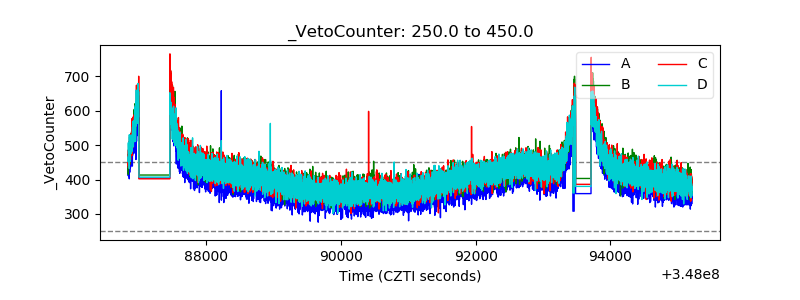 |