| Param | Original file | Final file |
|---|---|---|
| Filename | modeM0/AS1A10_045T06_9000004108_28612cztM0_level2.evt | modeM0/AS1A10_045T06_9000004108_28612cztM0_level2_quad_clean.evt |
| Size (bytes) | 1,366,228,800 | 179,971,200 |
| Size | 1.3 GB | 171.6 MB |
| Events in quadrant A | 9,277,022 | 1,115,579 |
| Events in quadrant B | 7,993,258 | 1,144,833 |
| Events in quadrant C | 7,576,279 | 1,095,609 |
| Events in quadrant D | 15,505,608 | 1,045,945 |
| Mode M9 | |||
|---|---|---|---|
| Quadrant | BADHDUFLAG | Total packets | Discarded packets |
| A | 0 | 25 | 0 |
| B | 0 | 25 | 0 |
| C | 0 | 25 | 0 |
| D | 0 | 25 | 0 |
| Mode M0 | |||
|---|---|---|---|
| Quadrant | BADHDUFLAG | Total packets | Discarded packets |
| A | 0 | 37531 | 3 |
| B | 0 | 33663 | 3 |
| C | 0 | 32114 | 3 |
| D | 0 | 56712 | 4 |
| Mode SS | |||
|---|---|---|---|
| Quadrant | BADHDUFLAG | Total packets | Discarded packets |
| A | 0 | 310 | 0 |
| B | 0 | 310 | 0 |
| C | 0 | 310 | 0 |
| D | 0 | 310 | 0 |
| Quadrant | Total seconds | Saturated seconds | Saturation percentage |
|---|---|---|---|
| A | 15194 | 226 | 1.487429% |
| B | 15196 | 279 | 1.836009% |
| C | 15196 | 498 | 3.277178% |
| D | 15195 | 1599 | 10.523198% |
Noise dominated data is calculated using 1-second bins in cleaned event files. If a bin has >2000 counts, and if more than 50% of those come from <1% of pixels, then it is considered to be noise-dominated and hence unusable.
| Quadrant | # 1 sec bins | Bins with >0 counts | Bins with >2000 counts | High rate bins dominated by noise | Noise dominated (total time) | Noise dominated (detector-on time) | Marked lightcurve |
|---|---|---|---|---|---|---|---|
| A | 17755 | 15197 | 48 | 48 | 0.27% | 0.32% | 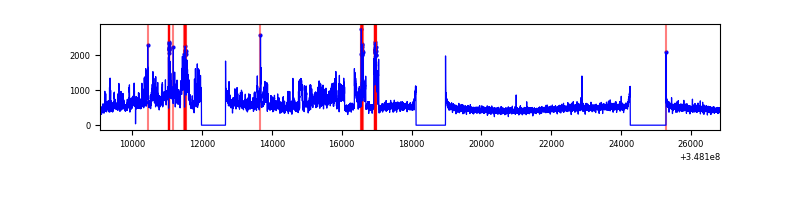 |
| B | 17756 | 15196 | 114 | 114 | 0.64% | 0.75% | 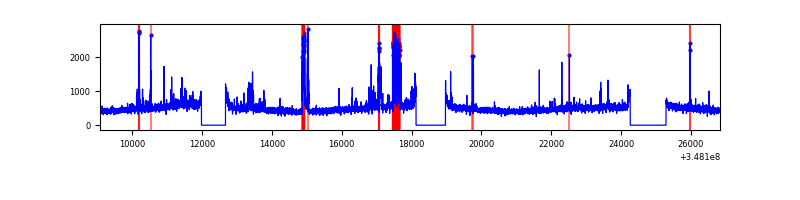 |
| C | 17756 | 15196 | 2 | 2 | 0.01% | 0.01% | 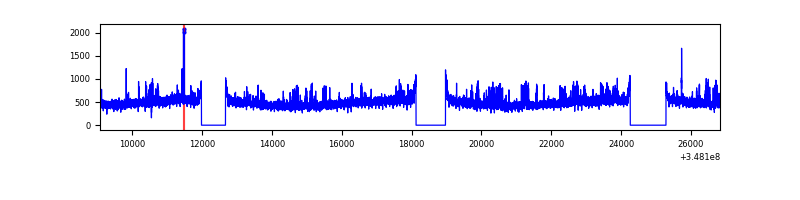 |
| D | 17756 | 15198 | 1426 | 1426 | 8.03% | 9.38% | 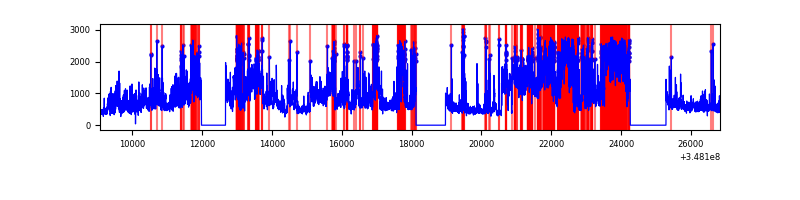 |
Top three noisy pixels from each quadrant. If the there are fewer than three noisy pixels in the level2.evt file, extra rows are filled as -1
| Pixel properties | Quadrant properties | ||||||
|---|---|---|---|---|---|---|---|
| Quadrant | DetID | PixID | Counts | Sigma | Mean | Median | Sigma |
| A | 15 | 47 | 2121468 | 5717.64 | 1849 | 1809 | 370.7 |
| A | 13 | 254 | 26622 | 66.93 | 1849 | 1809 | 370.7 |
| A | 3 | 137 | 18417 | 44.8 | 1849 | 1809 | 370.7 |
| B | 10 | 245 | 675966 | 1929.74 | 1831 | 1780 | 349.4 |
| B | 5 | 255 | 47023 | 129.5 | 1831 | 1780 | 349.4 |
| B | 12 | 111 | 44343 | 121.83 | 1831 | 1780 | 349.4 |
| C | 14 | 238 | 415396 | 1003.07 | 1766 | 1777 | 412.4 |
| C | 14 | 254 | 186336 | 447.58 | 1766 | 1777 | 412.4 |
| C | 7 | 247 | 57067 | 134.08 | 1766 | 1777 | 412.4 |
| D | 1 | 52 | 7407937 | 18082.97 | 1733 | 1690 | 409.6 |
| D | 8 | 195 | 1254471 | 3058.77 | 1733 | 1690 | 409.6 |
| D | 2 | 250 | 134728 | 324.82 | 1733 | 1690 | 409.6 |
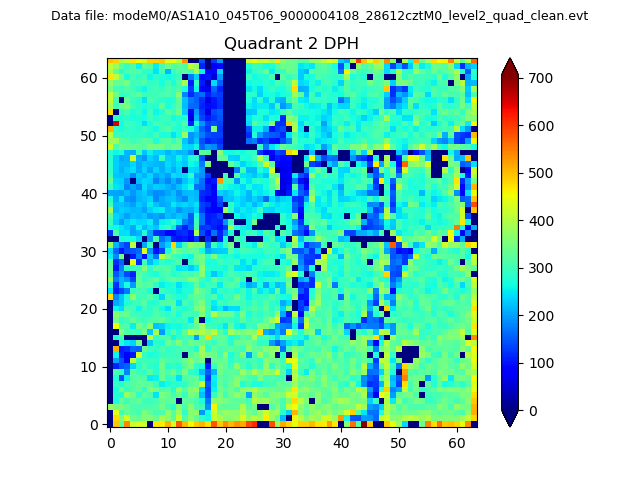
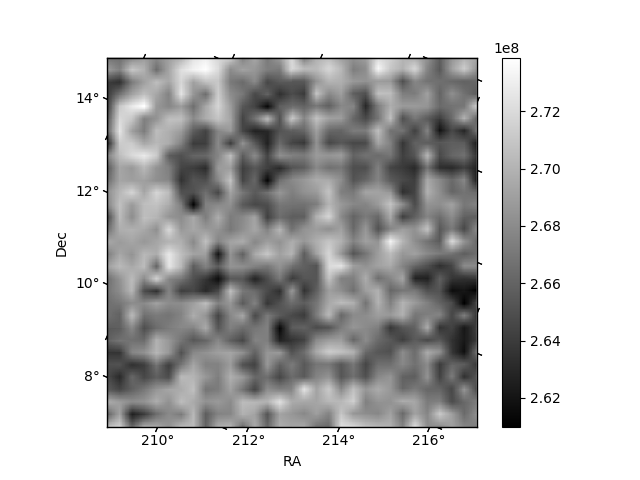
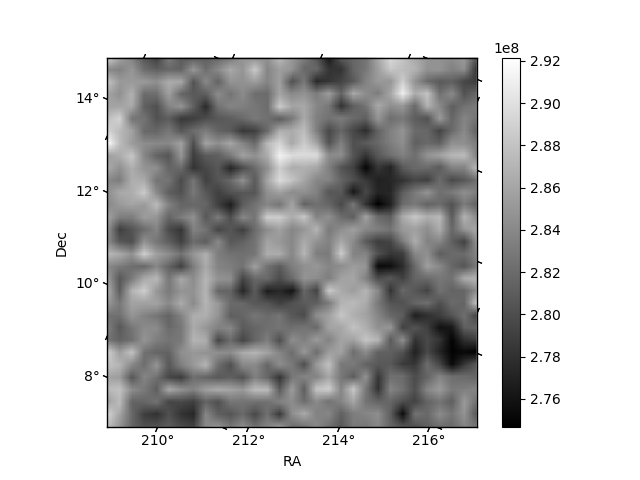
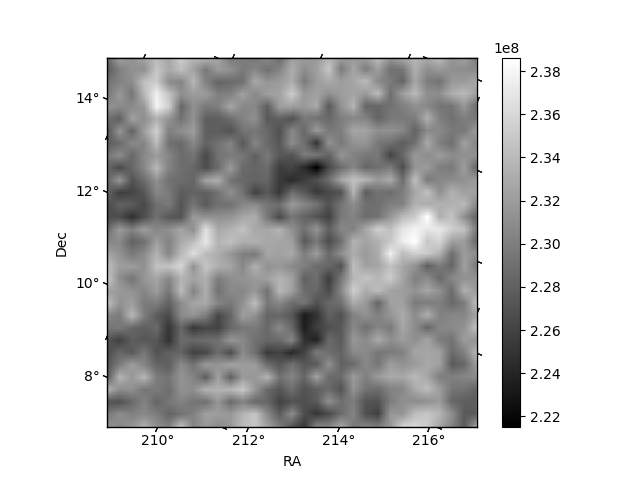
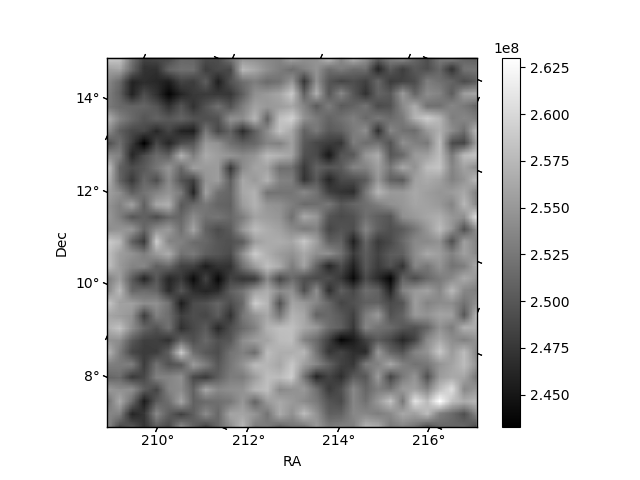
Histogram calculated using DETX and DETY for each event in the final _common_clean file
| Quadrant A | 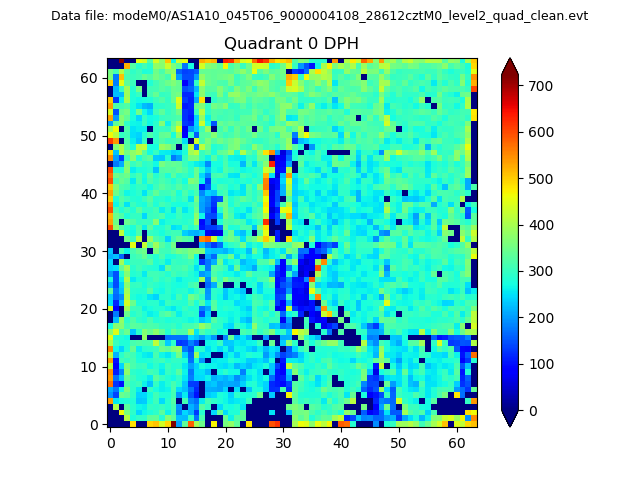 |
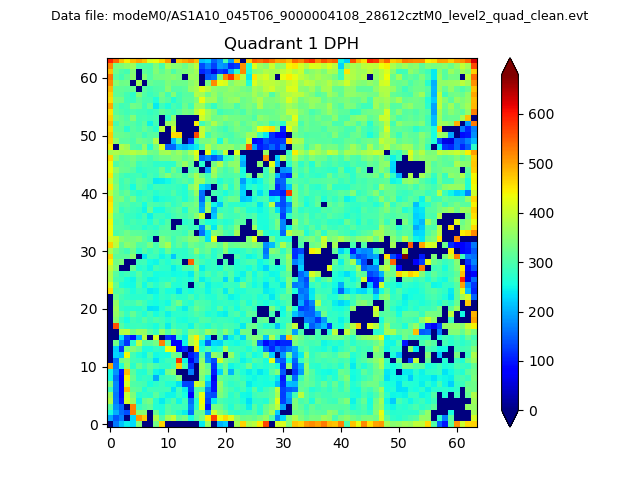 |
Quadrant B |
|---|---|---|---|
| Quadrant D | 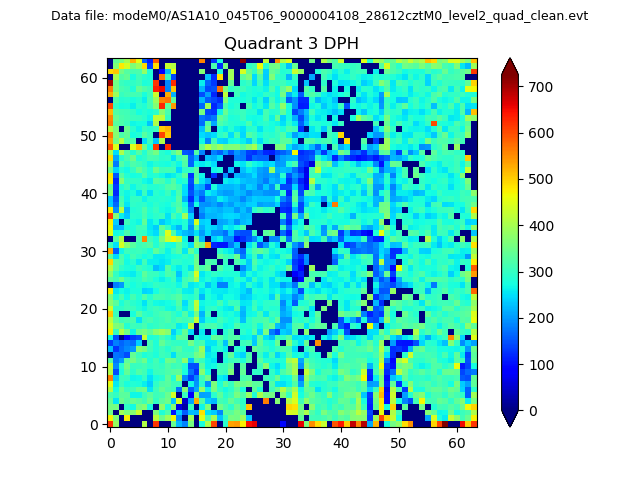 |
 |
Quadrant C |
| Plot type | Count rate plots | Images |
|---|---|---|
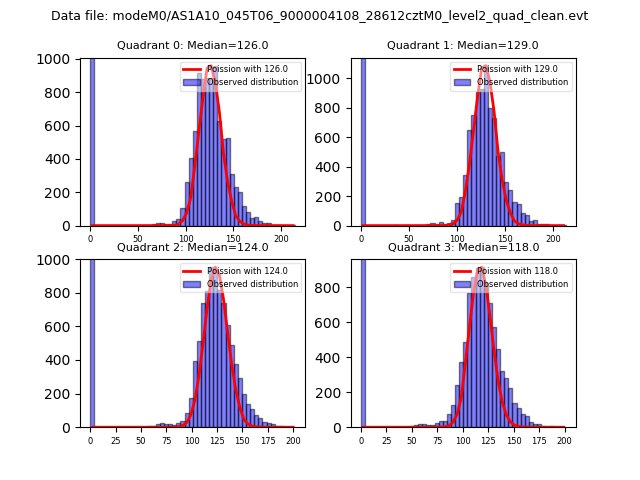
| Comparison with Poisson distribution Blue bars denote a histogram of data divided into 1 sec bins. Red curve is a Poisson curve with rate = median count rate of data. |
 |
 |
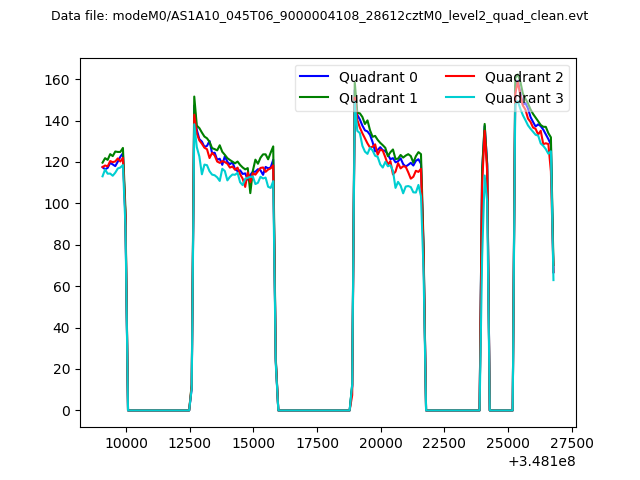
| Quadrant-wise count rates Data is divided into 100 sec bins |
 |
|
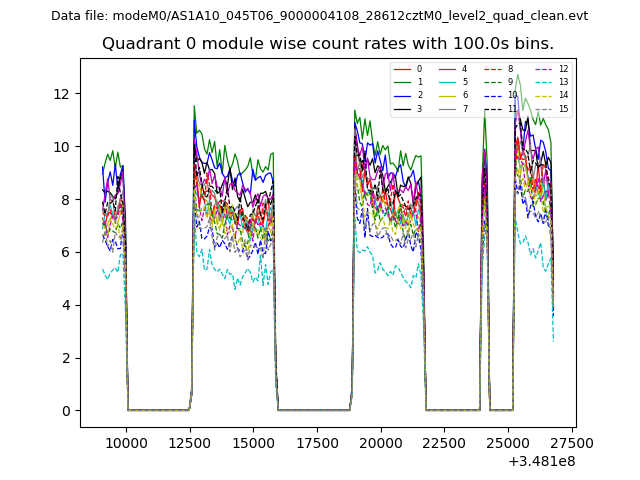
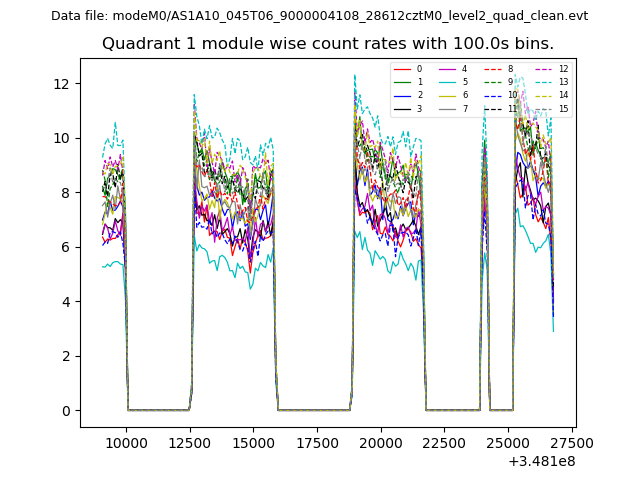
| Module-wise count rates for Quadrant A Data is divided into 100 sec bins |
 |
 |
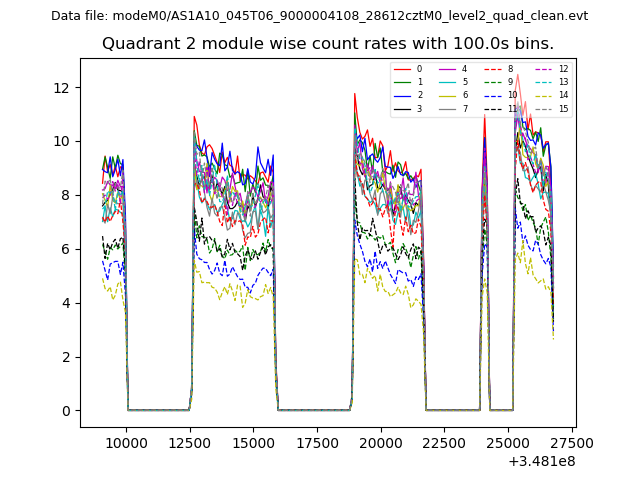
| Module-wise count rates for Quadrant B Data is divided into 100 sec bins |
 |
 |
| Module-wise count rates for Quadrant C Data is divided into 100 sec bins |
 |
 |
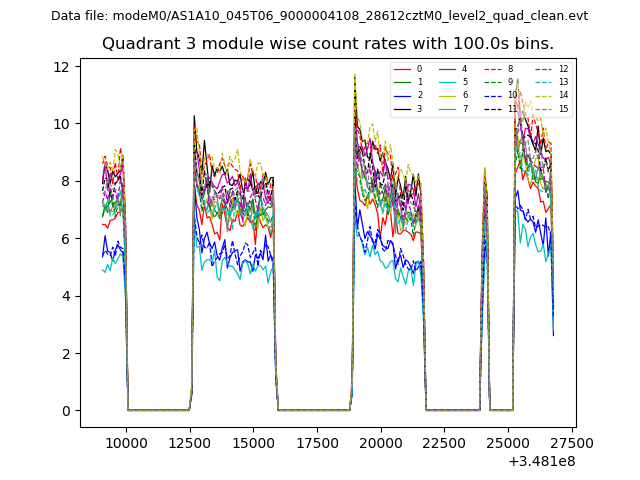
| Module-wise count rates for Quadrant D Data is divided into 100 sec bins |
 |
 |
| Parameter | Plot |
|---|---|
| CZT HV Monitor | 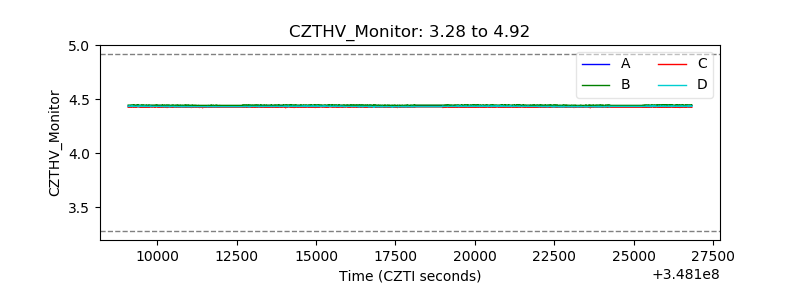 |
| D_VDD | 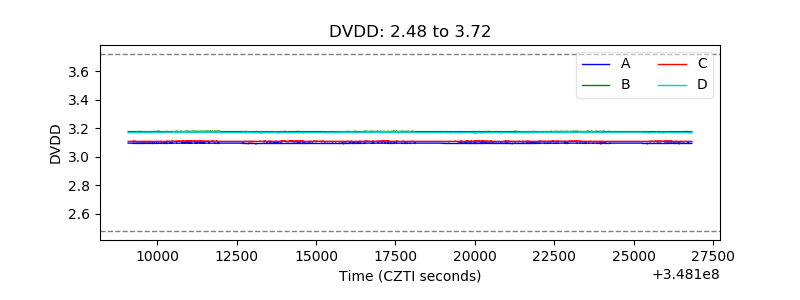 |
| Temperature 1 |  |
| Veto HV Monitor | 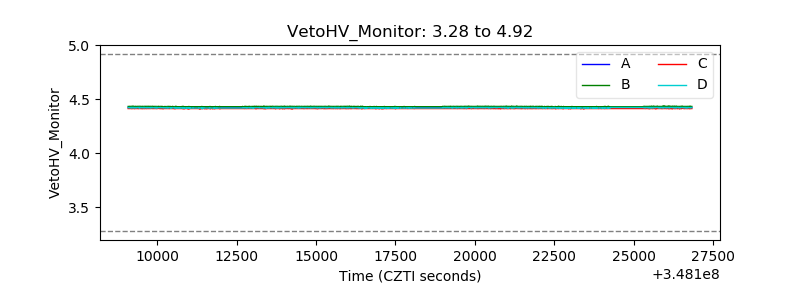 |
| Veto LLD |  |
| Alpha Counter | 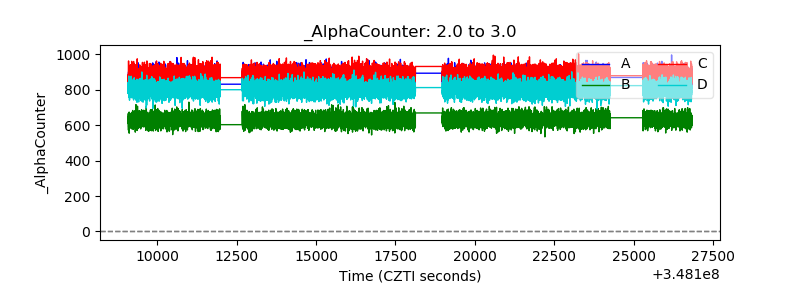 |
| _CPM_Rate | 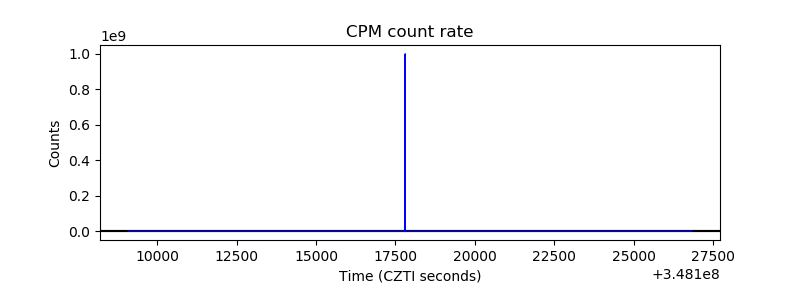 |
| CZT Counter | 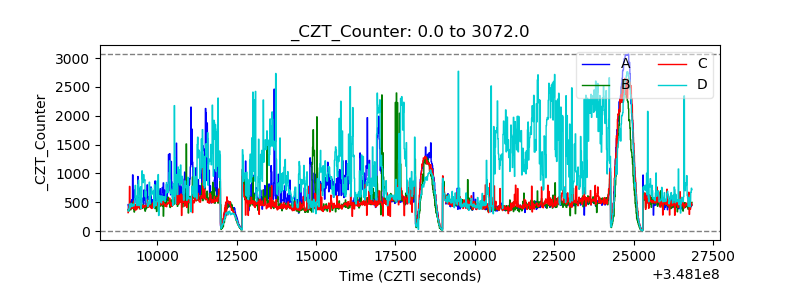 |
| +2.5 Volts monitor |  |
| +5 Volts monitor |  |
| _ROLL_ROT | 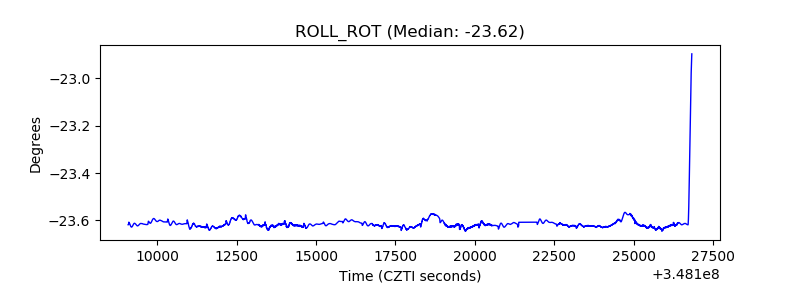 |
| _Roll_DEC | 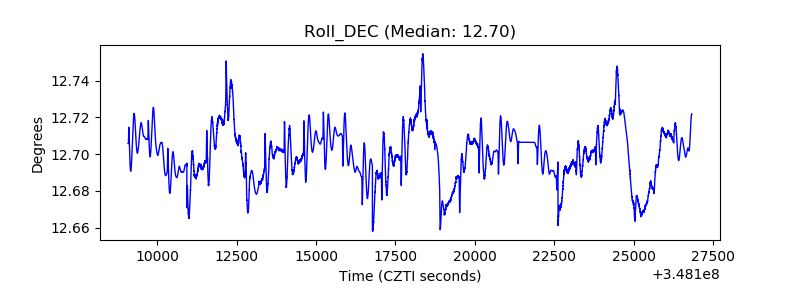 |
| _Roll_RA | 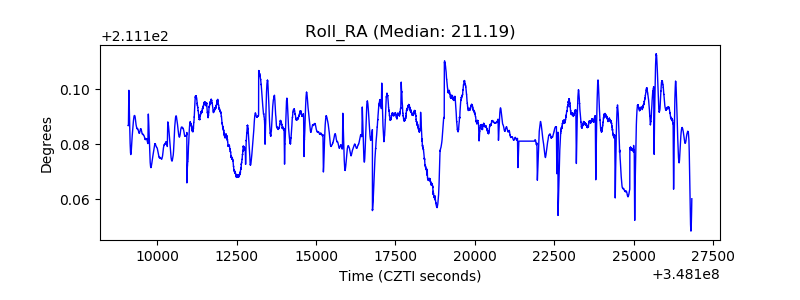 |
| Veto Counter | 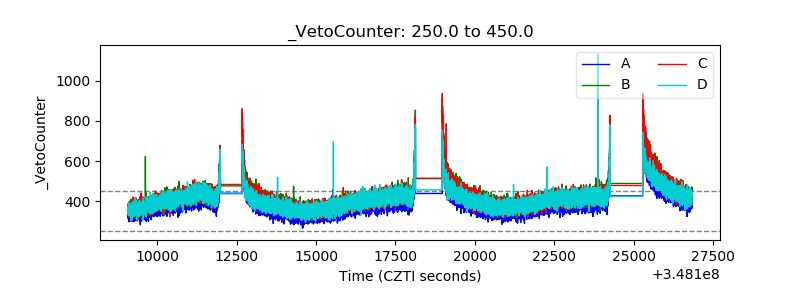 |