| Param | Original file | Final file |
|---|---|---|
| Filename | modeM0/AS1A10_045T06_9000004108_28615cztM0_level2.evt | modeM0/AS1A10_045T06_9000004108_28615cztM0_level2_quad_clean.evt |
| Size (bytes) | 1,321,462,080 | 196,848,000 |
| Size | 1.2 GB | 187.7 MB |
| Events in quadrant A | 7,605,289 | 1,249,291 |
| Events in quadrant B | 7,928,058 | 1,274,060 |
| Events in quadrant C | 8,013,470 | 1,215,309 |
| Events in quadrant D | 15,436,955 | 1,162,203 |
| Mode M9 | |||
|---|---|---|---|
| Quadrant | BADHDUFLAG | Total packets | Discarded packets |
| A | 0 | 34 | 0 |
| B | 0 | 34 | 0 |
| C | 0 | 34 | 0 |
| D | 0 | 34 | 0 |
| Mode M0 | |||
|---|---|---|---|
| Quadrant | BADHDUFLAG | Total packets | Discarded packets |
| A | 0 | 31886 | 3 |
| B | 0 | 32805 | 3 |
| C | 0 | 33096 | 3 |
| D | 0 | 56746 | 3 |
| Mode SS | |||
|---|---|---|---|
| Quadrant | BADHDUFLAG | Total packets | Discarded packets |
| A | 0 | 314 | 0 |
| B | 0 | 314 | 0 |
| C | 0 | 314 | 0 |
| D | 0 | 314 | 0 |
| Quadrant | Total seconds | Saturated seconds | Saturation percentage |
|---|---|---|---|
| A | 15373 | 93 | 0.604957% |
| B | 15374 | 146 | 0.949655% |
| C | 15374 | 550 | 3.577468% |
| D | 15373 | 1434 | 9.328043% |
Noise dominated data is calculated using 1-second bins in cleaned event files. If a bin has >2000 counts, and if more than 50% of those come from <1% of pixels, then it is considered to be noise-dominated and hence unusable.
| Quadrant | # 1 sec bins | Bins with >0 counts | Bins with >2000 counts | High rate bins dominated by noise | Noise dominated (total time) | Noise dominated (detector-on time) | Marked lightcurve |
|---|---|---|---|---|---|---|---|
| A | 18753 | 15373 | 1 | 1 | 0.01% | 0.01% | 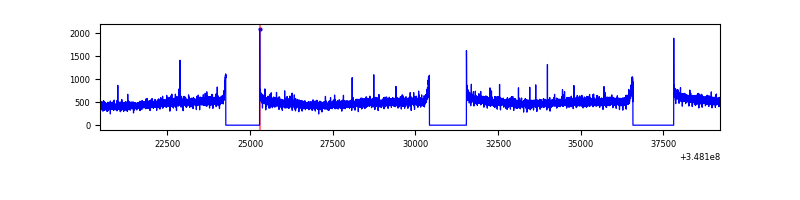 |
| B | 18754 | 15374 | 39 | 39 | 0.21% | 0.25% | 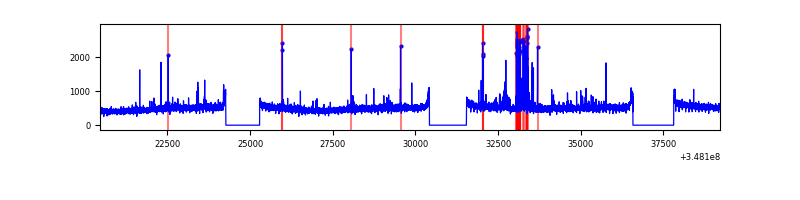 |
| C | 18754 | 15374 | 0 | 0 | 0.00% | 0.00% | 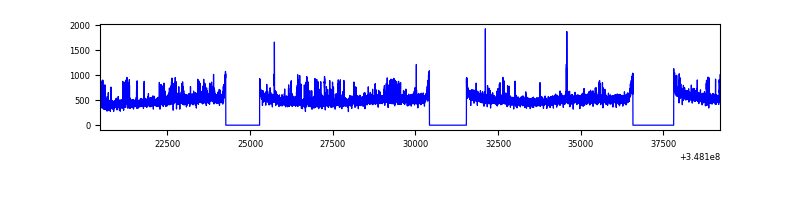 |
| D | 18753 | 15374 | 1289 | 1289 | 6.87% | 8.38% |  |
Top three noisy pixels from each quadrant. If the there are fewer than three noisy pixels in the level2.evt file, extra rows are filled as -1
| Pixel properties | Quadrant properties | ||||||
|---|---|---|---|---|---|---|---|
| Quadrant | DetID | PixID | Counts | Sigma | Mean | Median | Sigma |
| A | 13 | 254 | 24880 | 59.0 | 1963 | 1925 | 389.1 |
| A | 15 | 47 | 22267 | 52.28 | 1963 | 1925 | 389.1 |
| A | 3 | 137 | 18806 | 43.39 | 1963 | 1925 | 389.1 |
| B | 10 | 245 | 285914 | 786.52 | 1930 | 1883 | 361.1 |
| B | 12 | 111 | 44550 | 118.15 | 1930 | 1883 | 361.1 |
| B | 11 | 111 | 40967 | 108.23 | 1930 | 1883 | 361.1 |
| C | 14 | 238 | 444589 | 1026.3 | 1865 | 1883 | 431.4 |
| C | 14 | 254 | 208274 | 478.46 | 1865 | 1883 | 431.4 |
| C | 7 | 247 | 73955 | 167.08 | 1865 | 1883 | 431.4 |
| D | 1 | 52 | 5588086 | 12926.25 | 1841 | 1796 | 432.2 |
| D | 8 | 195 | 2645401 | 6117.1 | 1841 | 1796 | 432.2 |
| D | 2 | 250 | 128630 | 293.48 | 1841 | 1796 | 432.2 |
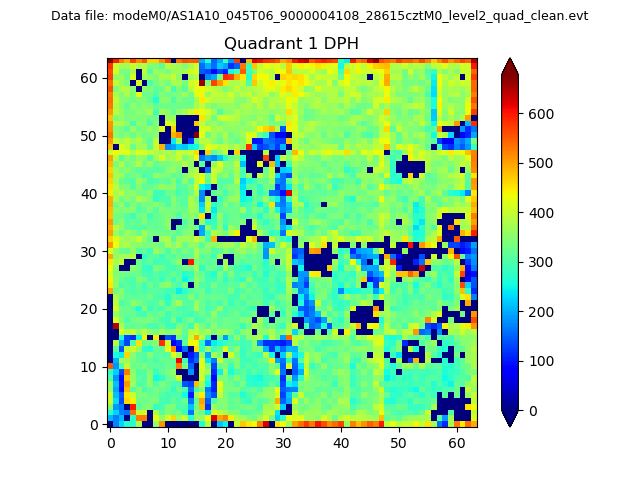
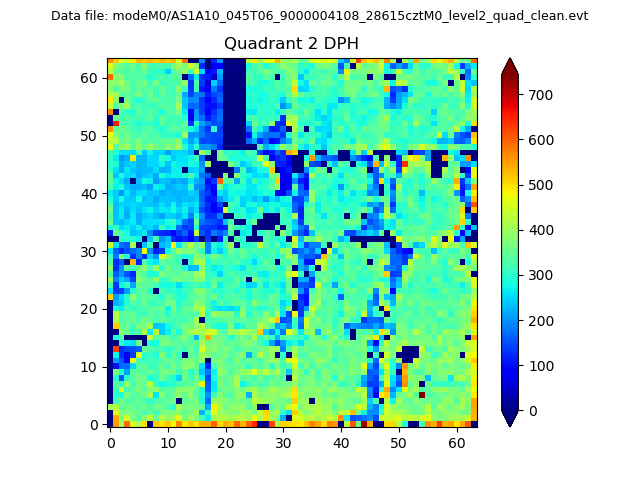
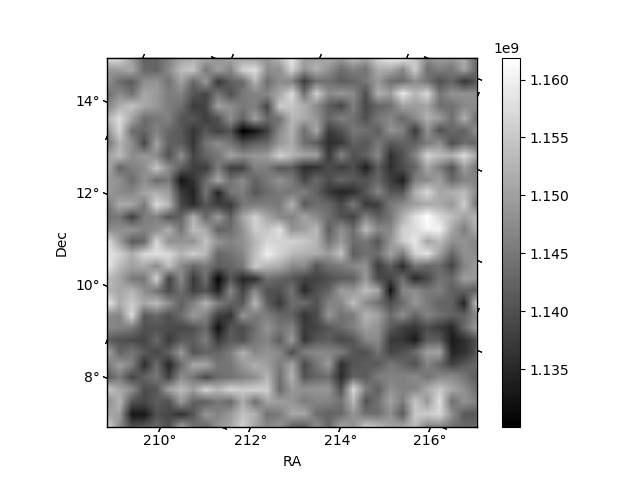
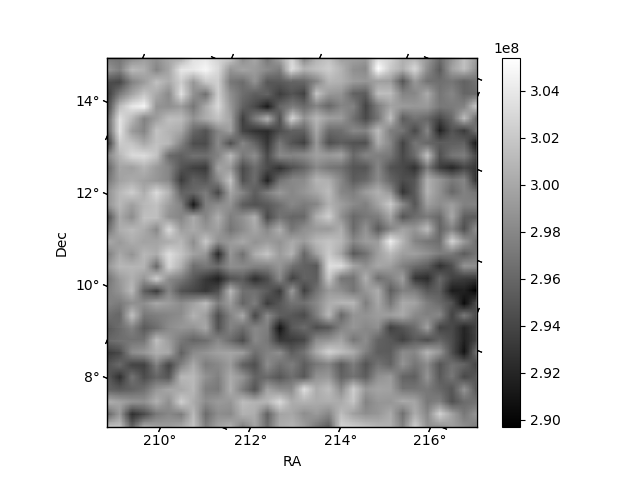
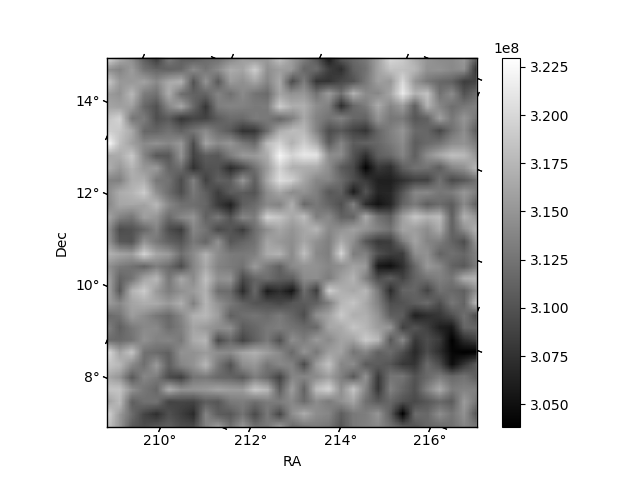
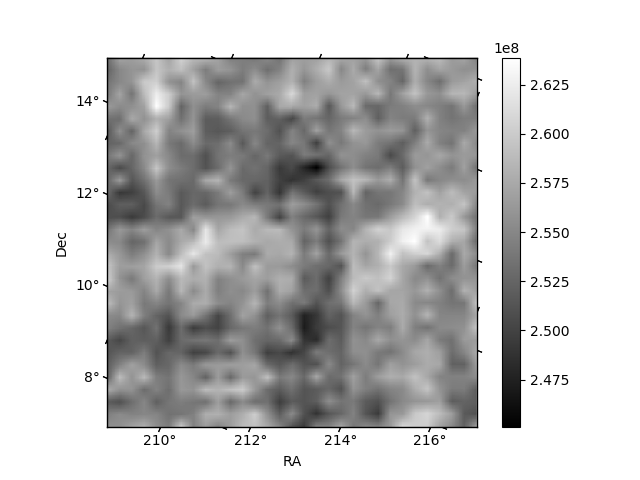
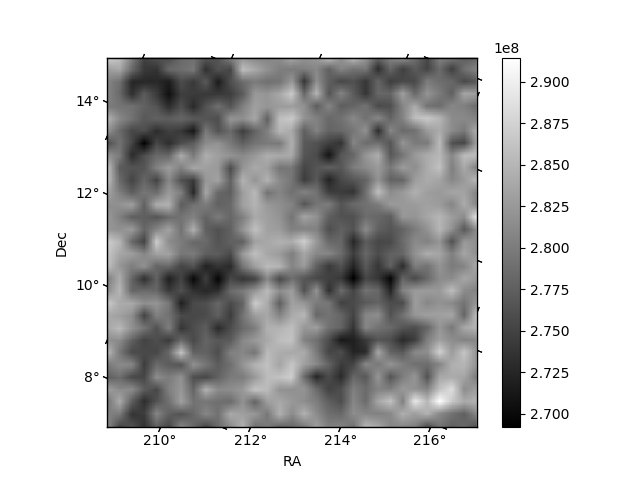
Histogram calculated using DETX and DETY for each event in the final _common_clean file
| Quadrant A | 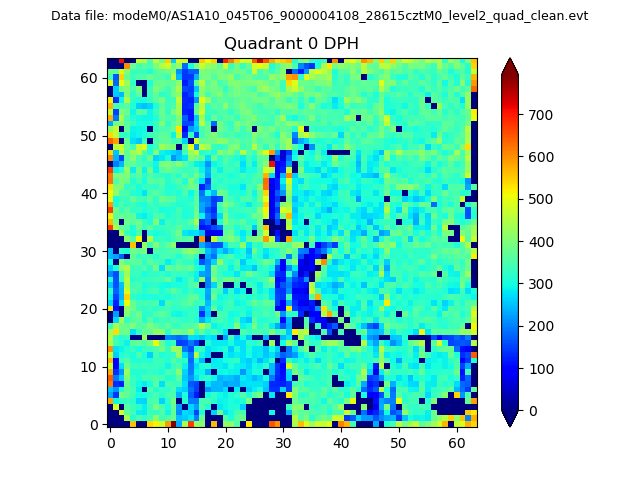 |
 |
Quadrant B |
|---|---|---|---|
| Quadrant D | 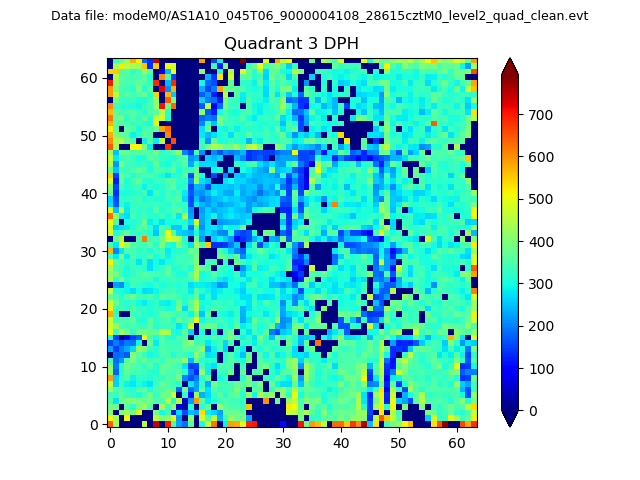 |
 |
Quadrant C |
| Plot type | Count rate plots | Images |
|---|---|---|
| Comparison with Poisson distribution Blue bars denote a histogram of data divided into 1 sec bins. Red curve is a Poisson curve with rate = median count rate of data. |
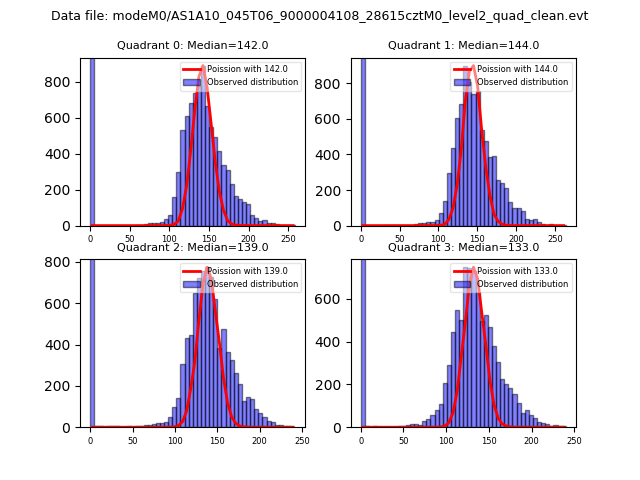 |
 |
| Quadrant-wise count rates Data is divided into 100 sec bins |
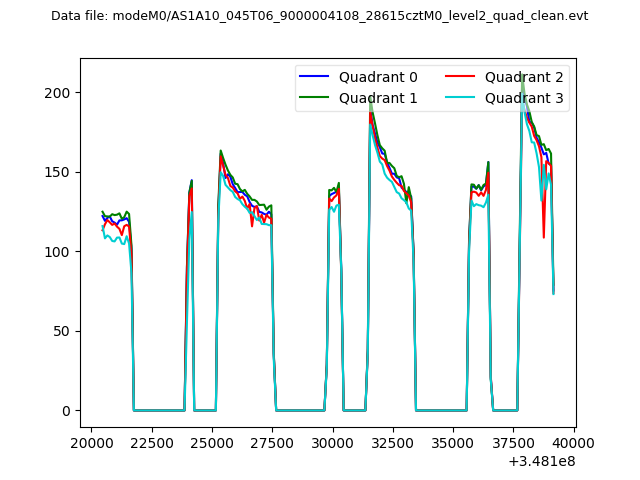 |
|
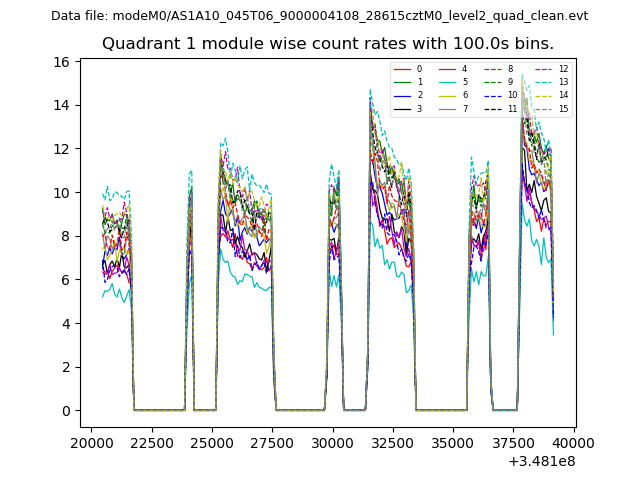
| Module-wise count rates for Quadrant A Data is divided into 100 sec bins |
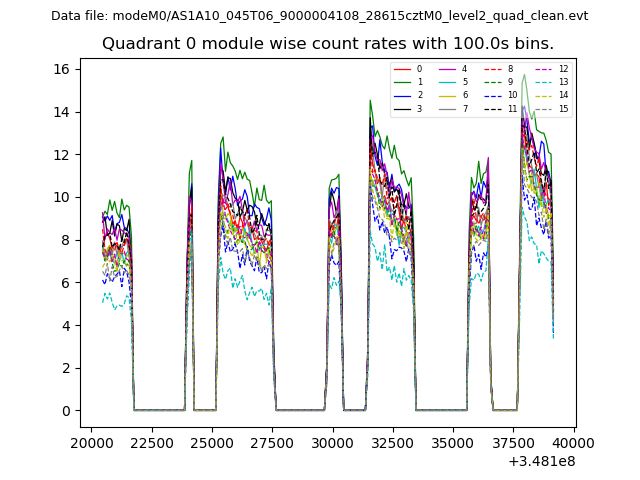 |
 |
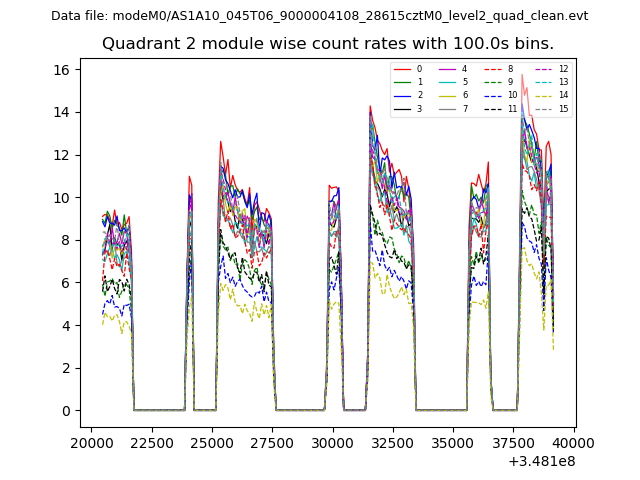
| Module-wise count rates for Quadrant B Data is divided into 100 sec bins |
 |
 |
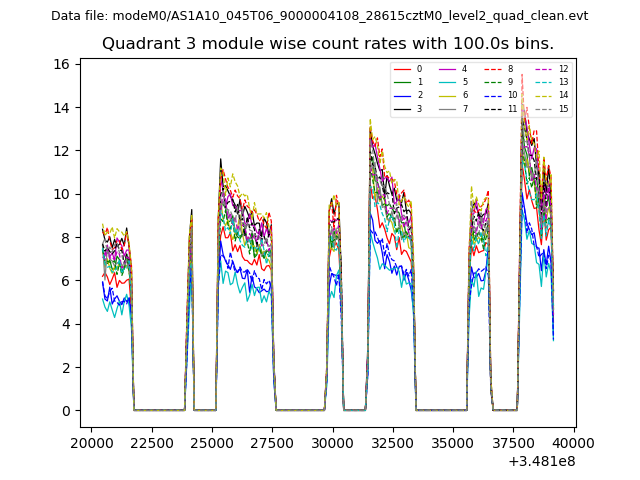
| Module-wise count rates for Quadrant C Data is divided into 100 sec bins |
 |
 |
| Module-wise count rates for Quadrant D Data is divided into 100 sec bins |
 |
 |
| Parameter | Plot |
|---|---|
| CZT HV Monitor | 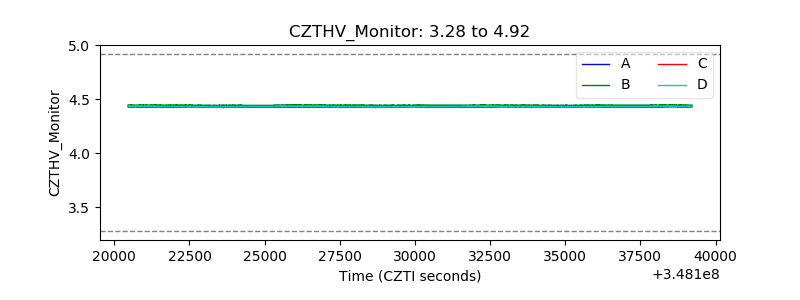 |
| D_VDD | 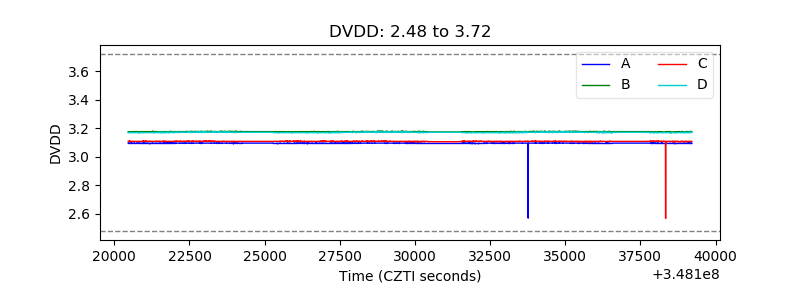 |
| Temperature 1 | 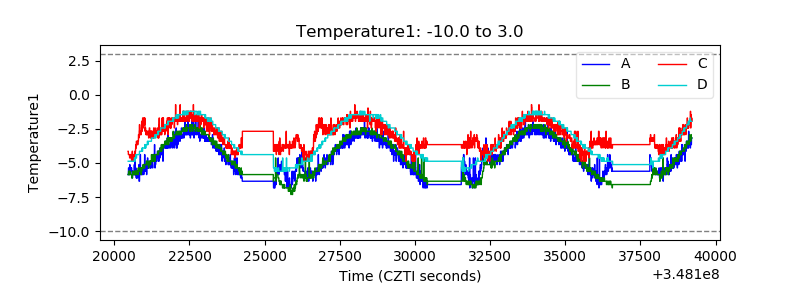 |
| Veto HV Monitor | 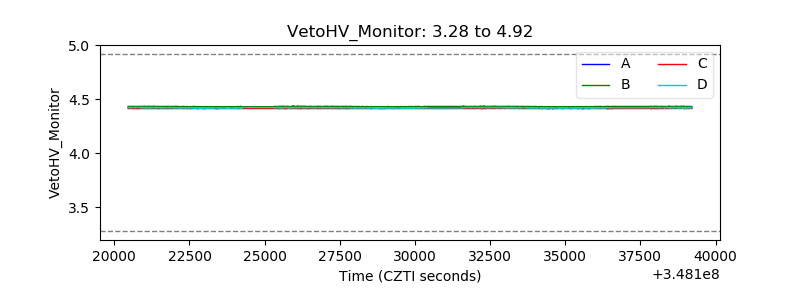 |
| Veto LLD | 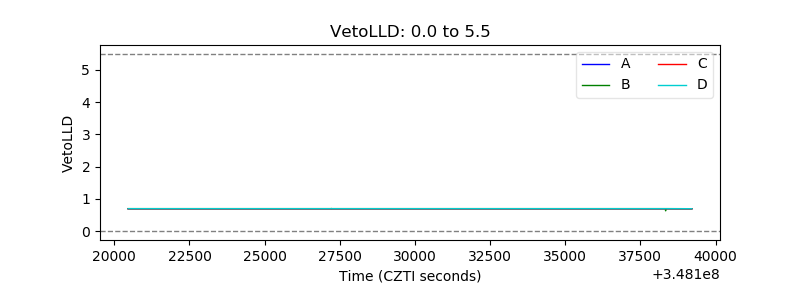 |
| Alpha Counter | 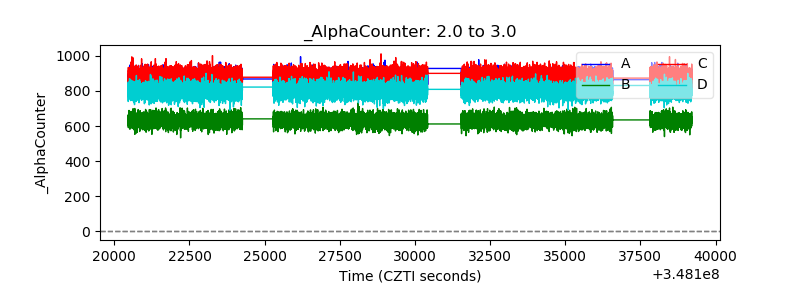 |
| _CPM_Rate | 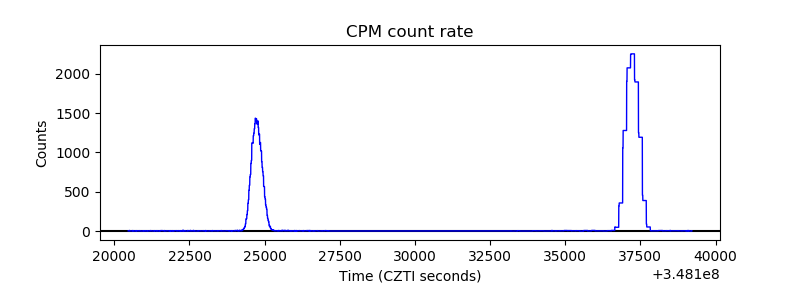 |
| CZT Counter | 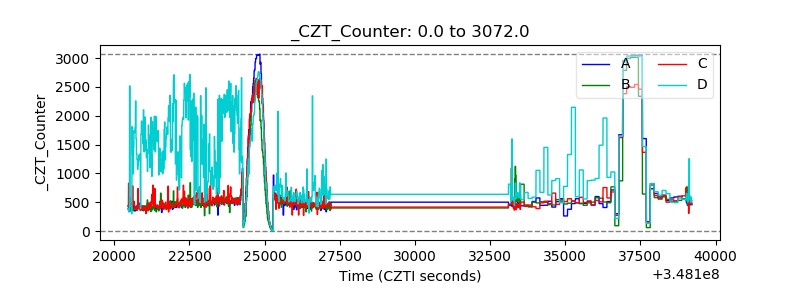 |
| +2.5 Volts monitor |  |
| +5 Volts monitor |  |
| _ROLL_ROT | 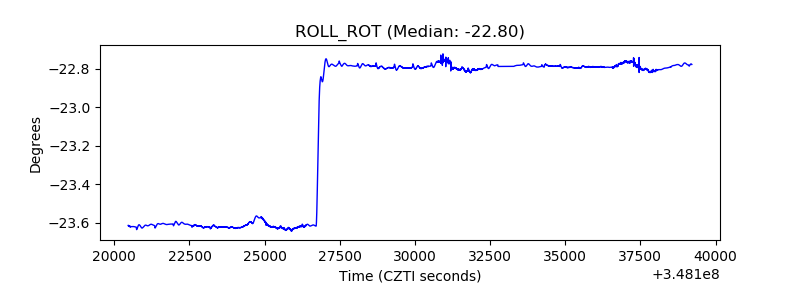 |
| _Roll_DEC | 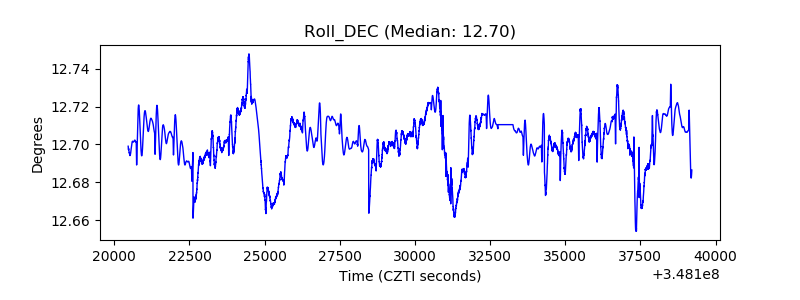 |
| _Roll_RA | 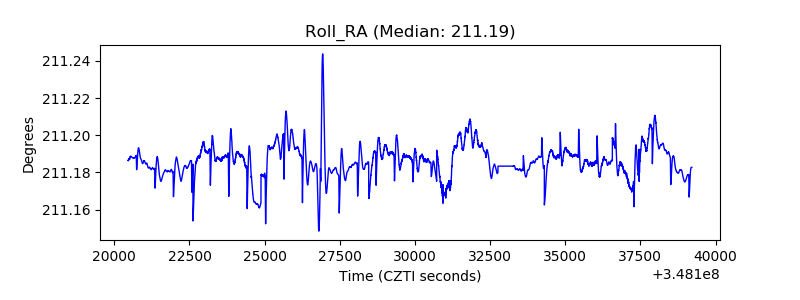 |
| Veto Counter | 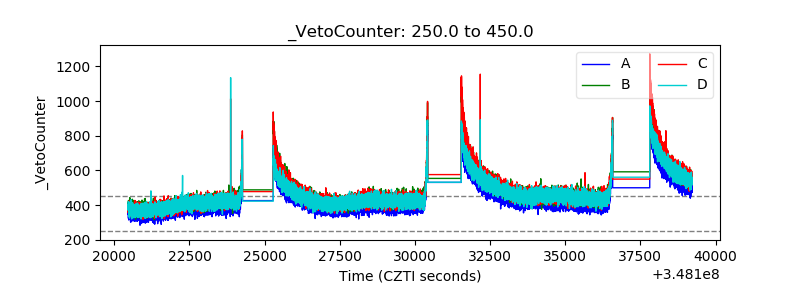 |