| Param | Original file | Final file |
|---|---|---|
| Filename | modeM0/AS1A10_045T06_9000004108_28616cztM0_level2.evt | modeM0/AS1A10_045T06_9000004108_28616cztM0_level2_quad_clean.evt |
| Size (bytes) | 473,996,160 | 82,895,040 |
| Size | 452.0 MB | 79.1 MB |
| Events in quadrant A | 3,092,328 | 537,623 |
| Events in quadrant B | 3,149,190 | 543,211 |
| Events in quadrant C | 3,178,744 | 521,517 |
| Events in quadrant D | 4,543,153 | 504,325 |
| Mode M9 | |||
|---|---|---|---|
| Quadrant | BADHDUFLAG | Total packets | Discarded packets |
| A | 0 | 13 | 0 |
| B | 0 | 13 | 0 |
| C | 0 | 13 | 0 |
| D | 0 | 13 | 0 |
| Mode M0 | |||
|---|---|---|---|
| Quadrant | BADHDUFLAG | Total packets | Discarded packets |
| A | 0 | 12410 | 1 |
| B | 0 | 12600 | 1 |
| C | 0 | 12716 | 2 |
| D | 0 | 17732 | 1 |
| Mode SS | |||
|---|---|---|---|
| Quadrant | BADHDUFLAG | Total packets | Discarded packets |
| A | 0 | 118 | 0 |
| B | 0 | 118 | 0 |
| C | 0 | 118 | 0 |
| D | 0 | 118 | 0 |
| Quadrant | Total seconds | Saturated seconds | Saturation percentage |
|---|---|---|---|
| A | 5771 | 51 | 0.883729% |
| B | 5772 | 53 | 0.918226% |
| C | 5771 | 136 | 2.356611% |
| D | 5771 | 185 | 3.205684% |
Noise dominated data is calculated using 1-second bins in cleaned event files. If a bin has >2000 counts, and if more than 50% of those come from <1% of pixels, then it is considered to be noise-dominated and hence unusable.
| Quadrant | # 1 sec bins | Bins with >0 counts | Bins with >2000 counts | High rate bins dominated by noise | Noise dominated (total time) | Noise dominated (detector-on time) | Marked lightcurve |
|---|---|---|---|---|---|---|---|
| A | 7061 | 5771 | 0 | 0 | 0.00% | 0.00% | 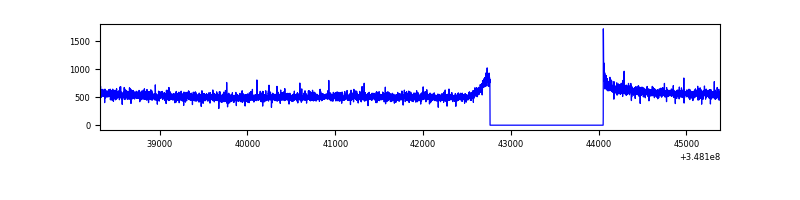 |
| B | 7062 | 5772 | 3 | 3 | 0.04% | 0.05% | 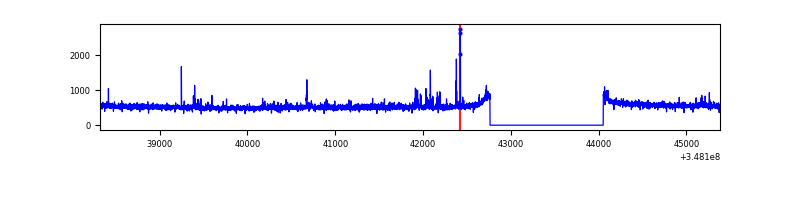 |
| C | 7061 | 5771 | 0 | 0 | 0.00% | 0.00% | 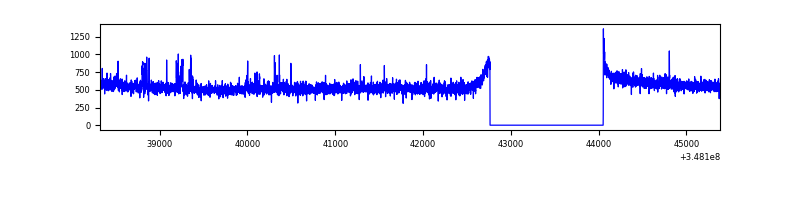 |
| D | 7061 | 5771 | 115 | 115 | 1.63% | 1.99% | 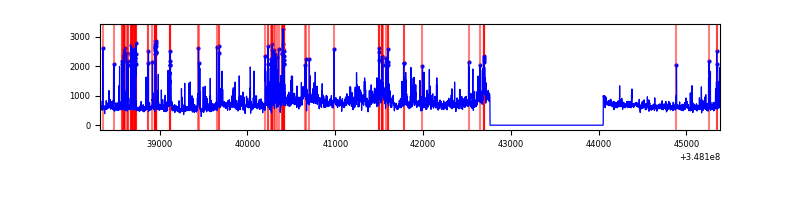 |
Top three noisy pixels from each quadrant. If the there are fewer than three noisy pixels in the level2.evt file, extra rows are filled as -1
| Pixel properties | Quadrant properties | ||||||
|---|---|---|---|---|---|---|---|
| Quadrant | DetID | PixID | Counts | Sigma | Mean | Median | Sigma |
| A | 13 | 254 | 9293 | 53.2 | 800 | 785 | 159.9 |
| A | 15 | 47 | 7230 | 40.3 | 800 | 785 | 159.9 |
| A | 3 | 137 | 7110 | 39.55 | 800 | 785 | 159.9 |
| B | 10 | 245 | 44016 | 295.56 | 779 | 761 | 146.3 |
| B | 15 | 33 | 20197 | 132.81 | 779 | 761 | 146.3 |
| B | 12 | 111 | 17241 | 112.61 | 779 | 761 | 146.3 |
| C | 14 | 238 | 146647 | 831.98 | 761 | 768 | 175.3 |
| C | 14 | 254 | 37247 | 208.05 | 761 | 768 | 175.3 |
| C | 7 | 247 | 22911 | 126.29 | 761 | 768 | 175.3 |
| D | 1 | 52 | 807886 | 4435.49 | 771 | 754 | 182.0 |
| D | 8 | 195 | 756881 | 4155.2 | 771 | 754 | 182.0 |
| D | 2 | 250 | 40127 | 216.37 | 771 | 754 | 182.0 |
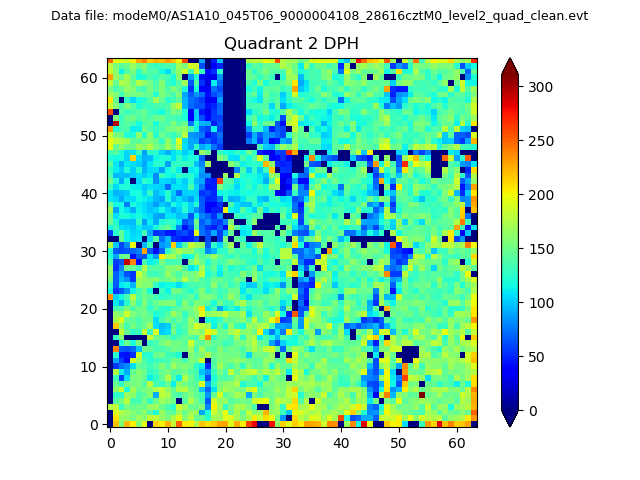
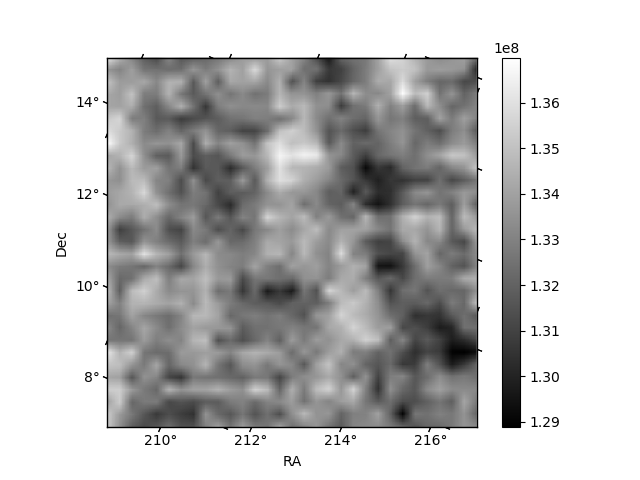
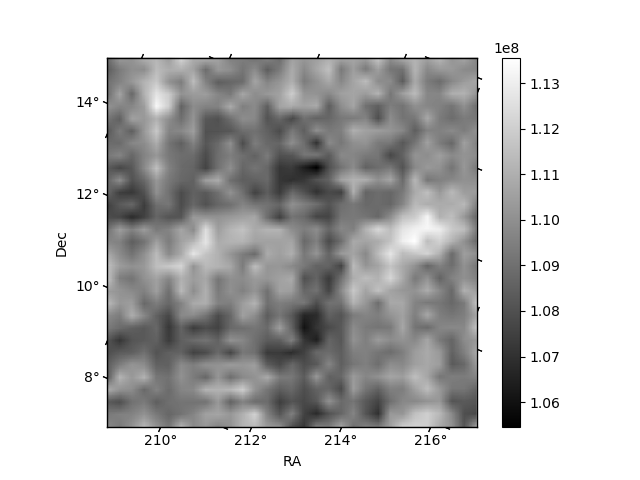
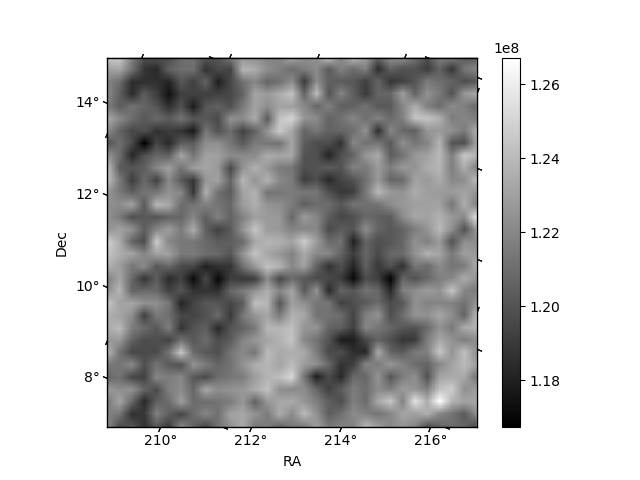
Histogram calculated using DETX and DETY for each event in the final _common_clean file
| Quadrant A | 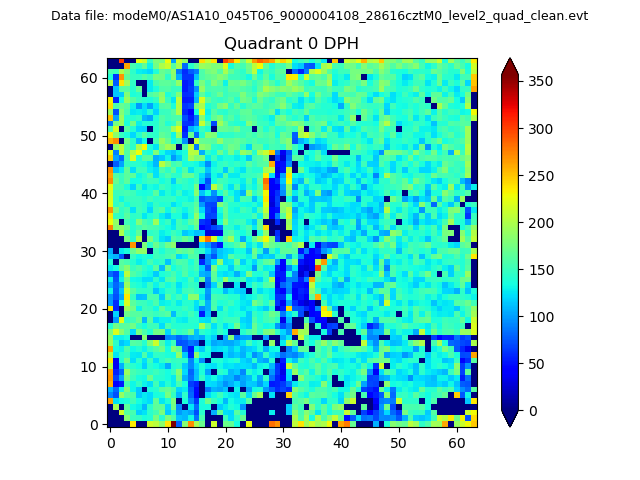 |
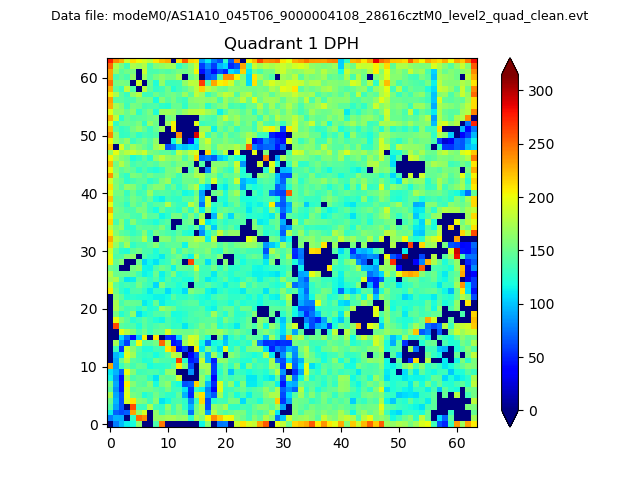 |
Quadrant B |
|---|---|---|---|
| Quadrant D | 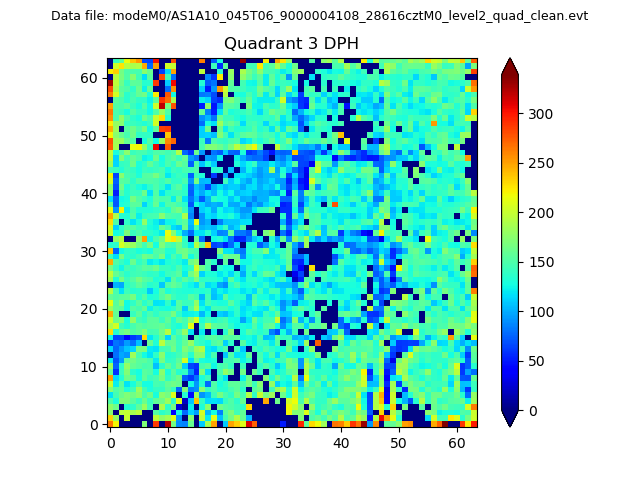 |
 |
Quadrant C |
| Plot type | Count rate plots | Images |
|---|---|---|
| Comparison with Poisson distribution Blue bars denote a histogram of data divided into 1 sec bins. Red curve is a Poisson curve with rate = median count rate of data. |
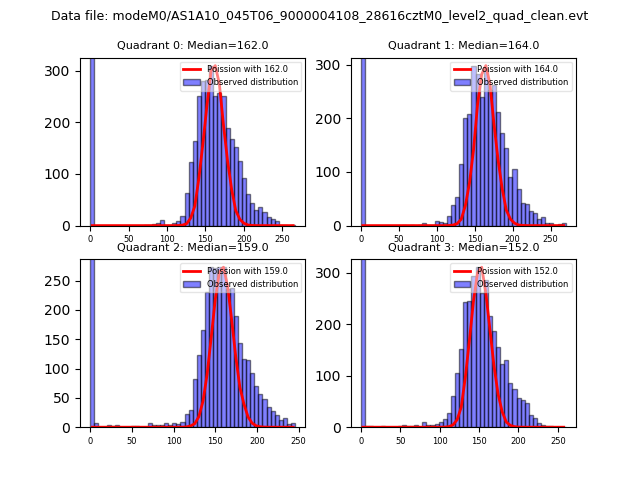 |
 |
| Quadrant-wise count rates Data is divided into 100 sec bins |
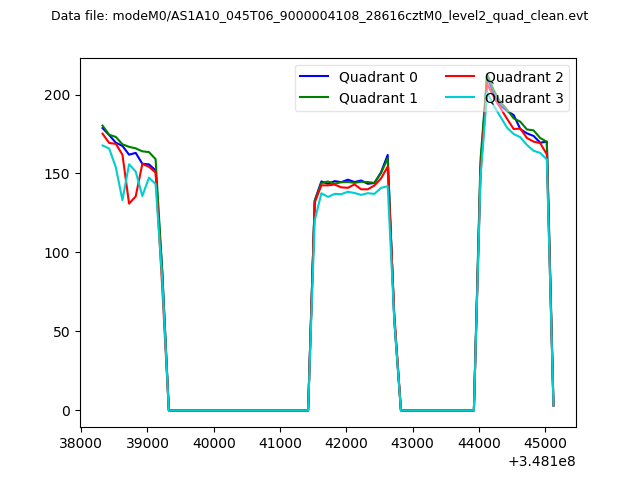 |
|
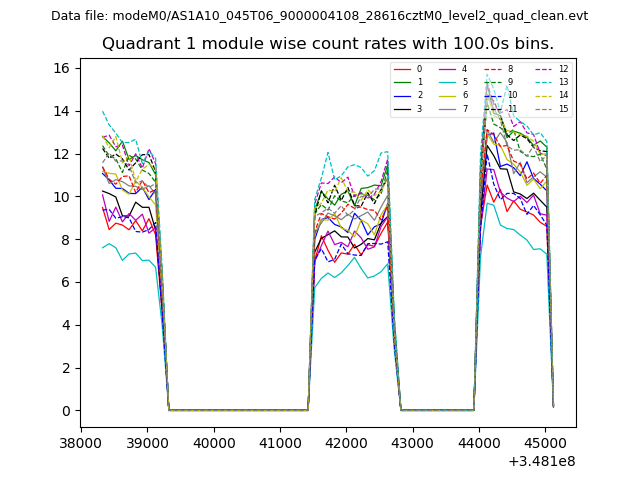
| Module-wise count rates for Quadrant A Data is divided into 100 sec bins |
 |
 |
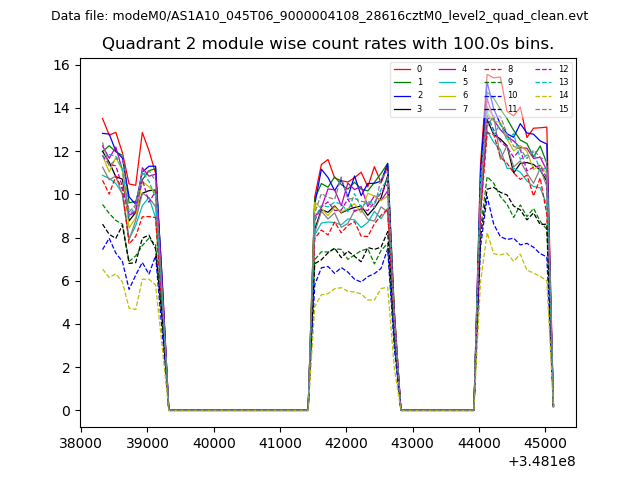
| Module-wise count rates for Quadrant B Data is divided into 100 sec bins |
 |
 |
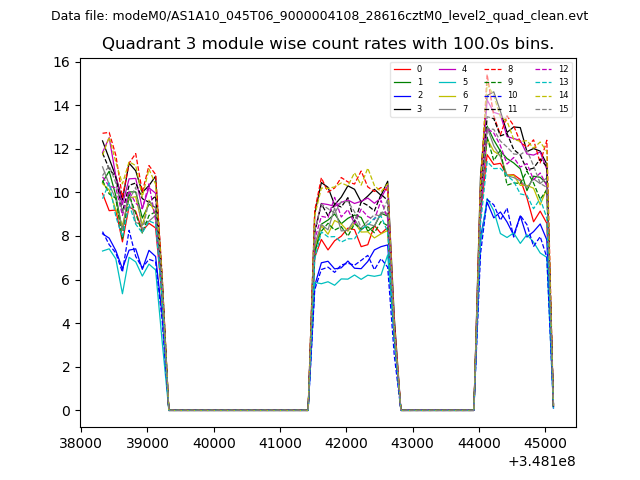
| Module-wise count rates for Quadrant C Data is divided into 100 sec bins |
 |
 |
| Module-wise count rates for Quadrant D Data is divided into 100 sec bins |
 |
 |
| Parameter | Plot |
|---|---|
| CZT HV Monitor | 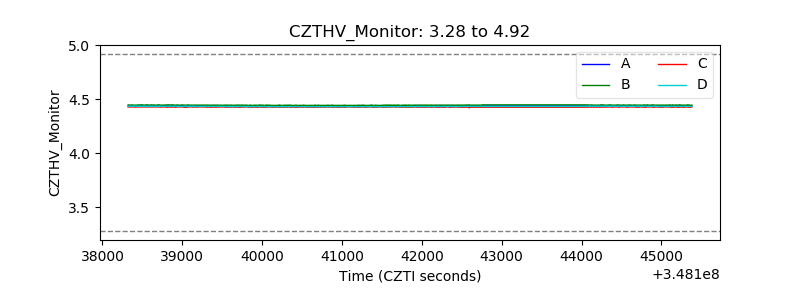 |
| D_VDD | 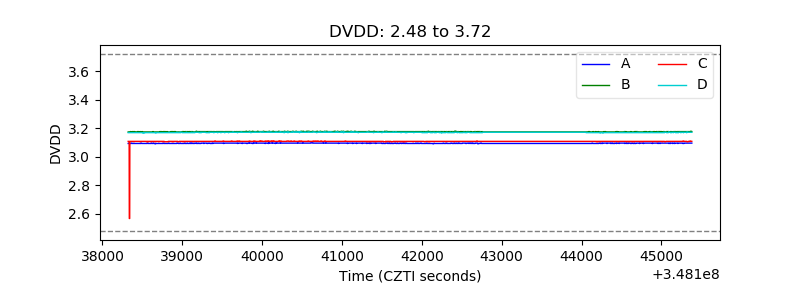 |
| Temperature 1 | 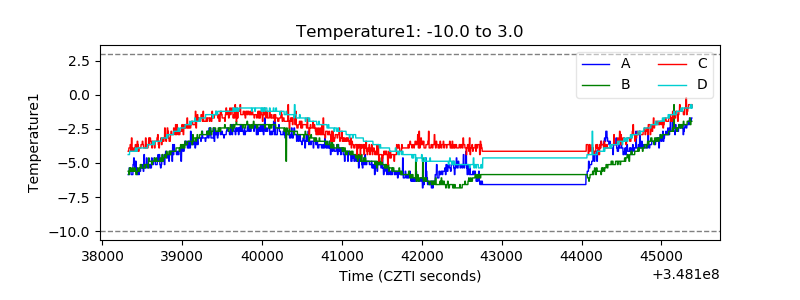 |
| Veto HV Monitor | 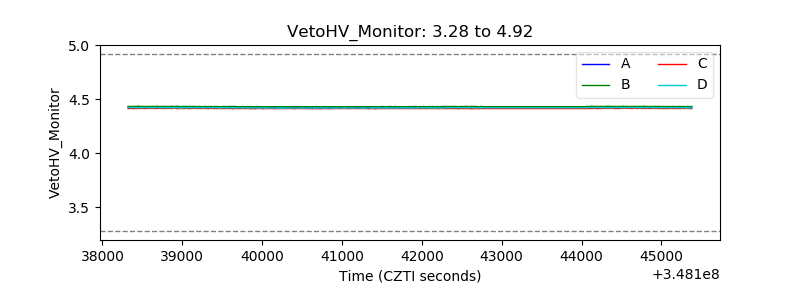 |
| Veto LLD | 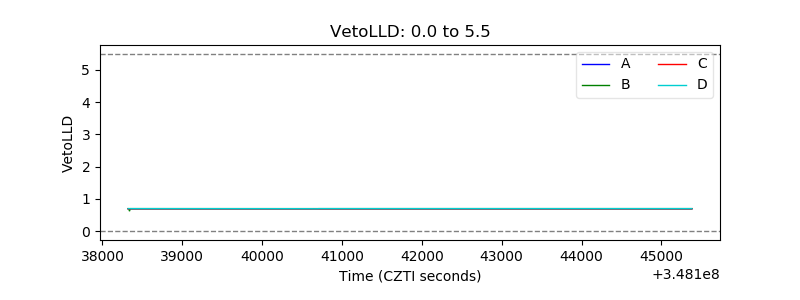 |
| Alpha Counter | 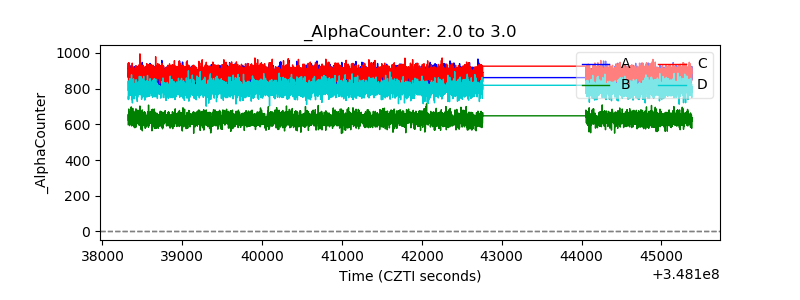 |
| _CPM_Rate | 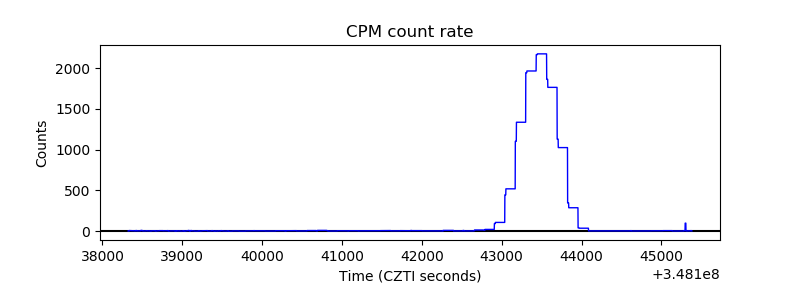 |
| CZT Counter | 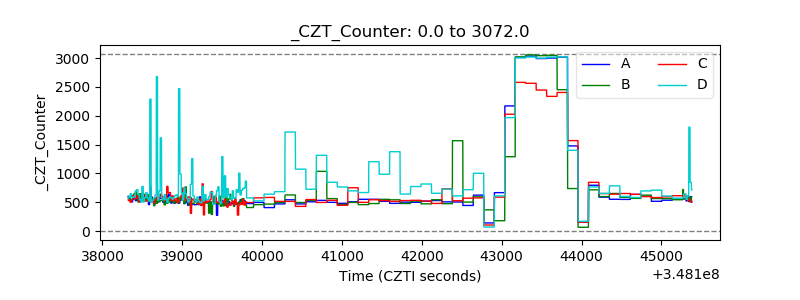 |
| +2.5 Volts monitor |  |
| +5 Volts monitor |  |
| _ROLL_ROT | 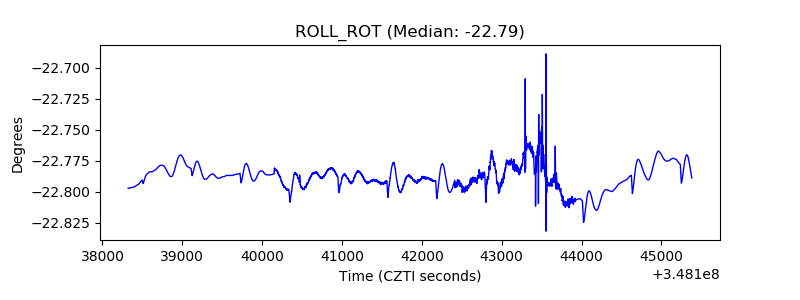 |
| _Roll_DEC | 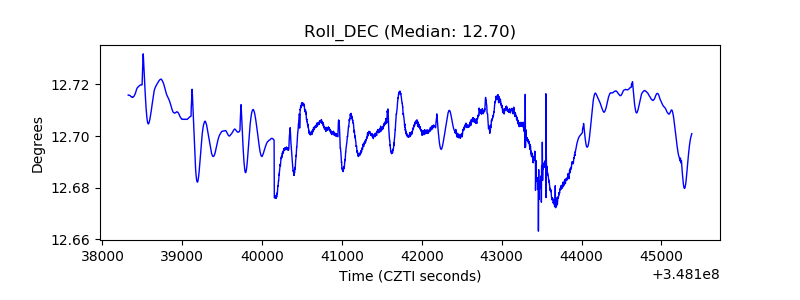 |
| _Roll_RA | 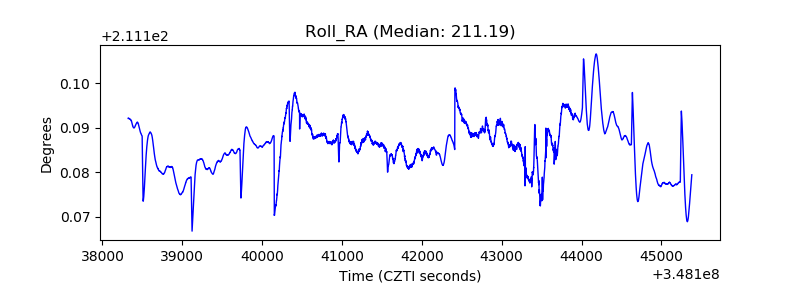 |
| Veto Counter | 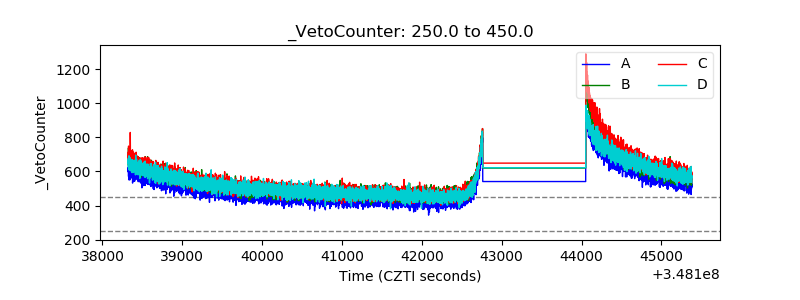 |