| Param | Original file | Final file |
|---|---|---|
| Filename | modeM0/AS1A10_045T06_9000004108_28617cztM0_level2.evt | modeM0/AS1A10_045T06_9000004108_28617cztM0_level2_quad_clean.evt |
| Size (bytes) | 502,934,400 | 76,504,320 |
| Size | 479.6 MB | 73.0 MB |
| Events in quadrant A | 3,209,222 | 484,288 |
| Events in quadrant B | 3,343,004 | 488,070 |
| Events in quadrant C | 3,270,557 | 475,352 |
| Events in quadrant D | 5,011,397 | 459,377 |
| Mode M9 | |||
|---|---|---|---|
| Quadrant | BADHDUFLAG | Total packets | Discarded packets |
| A | 0 | 13 | 0 |
| B | 0 | 13 | 0 |
| C | 0 | 13 | 0 |
| D | 0 | 13 | 0 |
| Mode M0 | |||
|---|---|---|---|
| Quadrant | BADHDUFLAG | Total packets | Discarded packets |
| A | 0 | 12867 | 1 |
| B | 0 | 13315 | 1 |
| C | 0 | 13060 | 1 |
| D | 0 | 19291 | 1 |
| Mode SS | |||
|---|---|---|---|
| Quadrant | BADHDUFLAG | Total packets | Discarded packets |
| A | 0 | 120 | 0 |
| B | 0 | 120 | 0 |
| C | 0 | 120 | 0 |
| D | 0 | 120 | 0 |
| Quadrant | Total seconds | Saturated seconds | Saturation percentage |
|---|---|---|---|
| A | 5857 | 93 | 1.587844% |
| B | 5858 | 114 | 1.946057% |
| C | 5858 | 129 | 2.202117% |
| D | 5858 | 294 | 5.018778% |
Noise dominated data is calculated using 1-second bins in cleaned event files. If a bin has >2000 counts, and if more than 50% of those come from <1% of pixels, then it is considered to be noise-dominated and hence unusable.
| Quadrant | # 1 sec bins | Bins with >0 counts | Bins with >2000 counts | High rate bins dominated by noise | Noise dominated (total time) | Noise dominated (detector-on time) | Marked lightcurve |
|---|---|---|---|---|---|---|---|
| A | 7147 | 5857 | 1 | 1 | 0.01% | 0.02% | 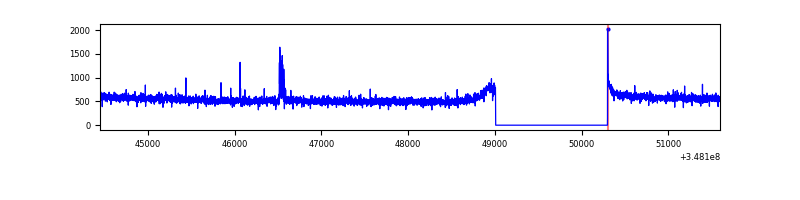 |
| B | 7148 | 5858 | 22 | 22 | 0.31% | 0.38% | 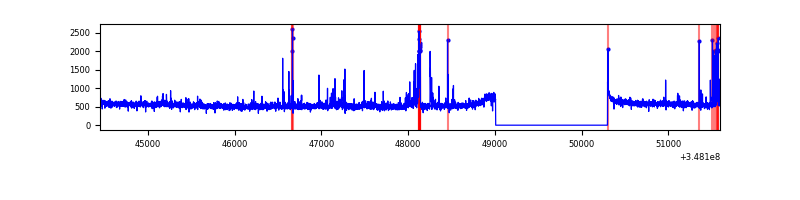 |
| C | 7148 | 5858 | 5 | 5 | 0.07% | 0.09% | 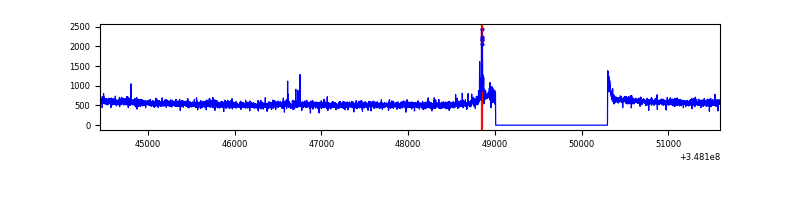 |
| D | 7148 | 5858 | 217 | 217 | 3.04% | 3.70% | 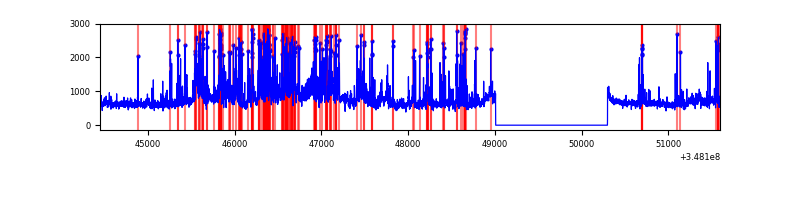 |
Top three noisy pixels from each quadrant. If the there are fewer than three noisy pixels in the level2.evt file, extra rows are filled as -1
| Pixel properties | Quadrant properties | ||||||
|---|---|---|---|---|---|---|---|
| Quadrant | DetID | PixID | Counts | Sigma | Mean | Median | Sigma |
| A | 4 | 208 | 28498 | 169.66 | 822 | 808 | 163.2 |
| A | 13 | 254 | 9973 | 56.16 | 822 | 808 | 163.2 |
| A | 15 | 47 | 8715 | 48.45 | 822 | 808 | 163.2 |
| B | 10 | 245 | 120767 | 804.37 | 802 | 786 | 149.2 |
| B | 10 | 246 | 42977 | 282.86 | 802 | 786 | 149.2 |
| B | 12 | 111 | 17790 | 114.0 | 802 | 786 | 149.2 |
| C | 14 | 238 | 129905 | 706.47 | 789 | 796 | 182.8 |
| C | 7 | 247 | 51394 | 276.87 | 789 | 796 | 182.8 |
| C | 3 | 233 | 13129 | 67.48 | 789 | 796 | 182.8 |
| D | 1 | 52 | 1120272 | 5959.26 | 792 | 775 | 187.9 |
| D | 8 | 195 | 704350 | 3745.24 | 792 | 775 | 187.9 |
| D | 2 | 250 | 89402 | 471.78 | 792 | 775 | 187.9 |
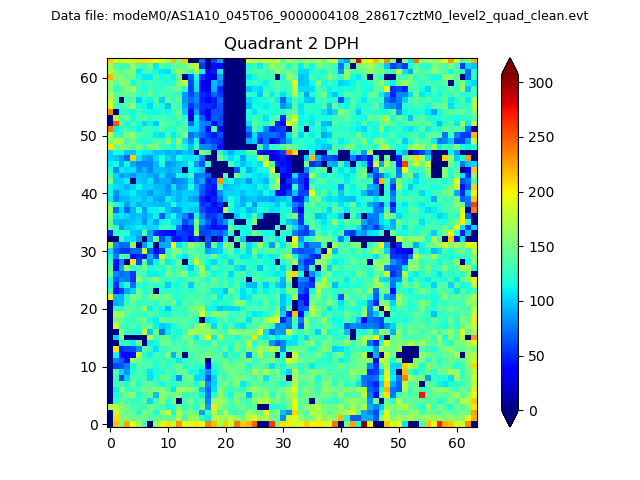
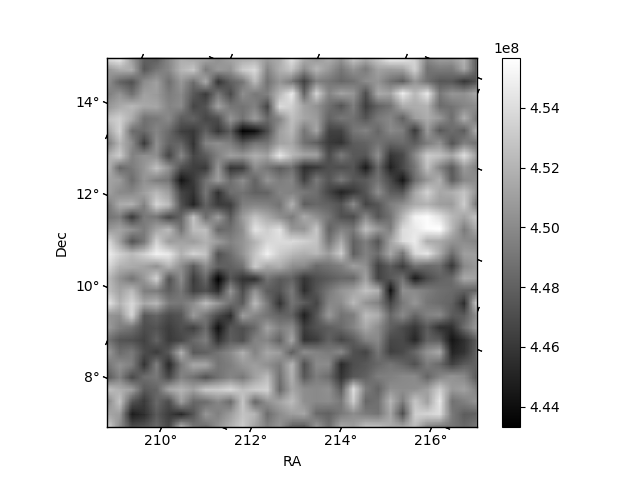
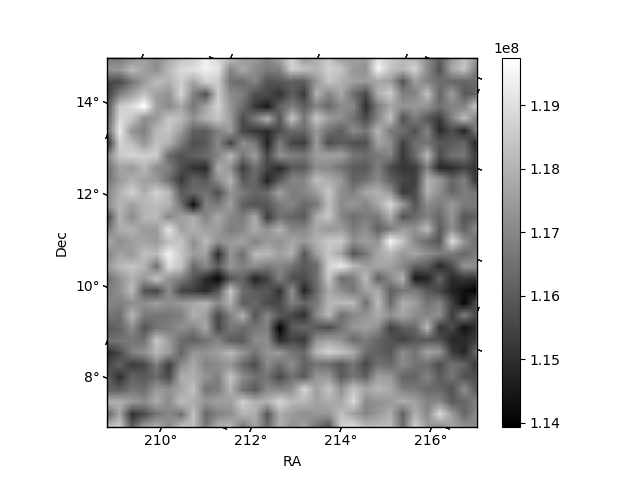
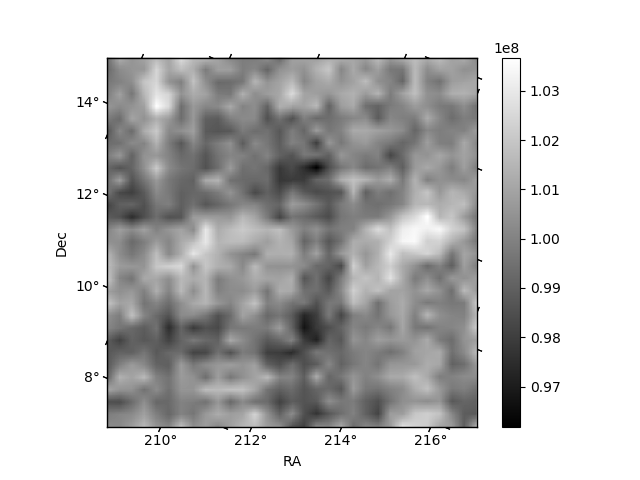
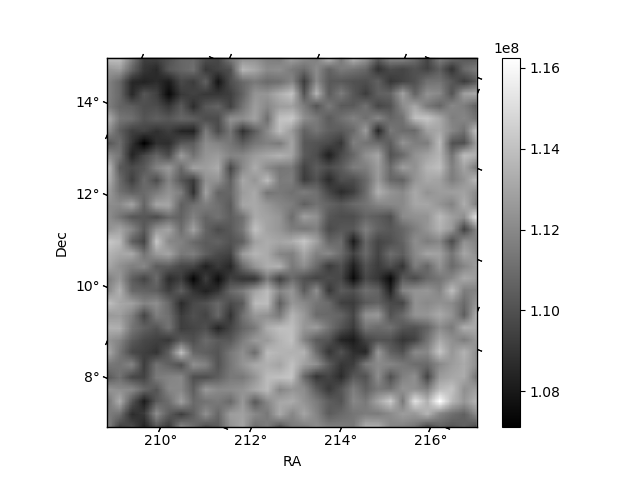
Histogram calculated using DETX and DETY for each event in the final _common_clean file
| Quadrant A | 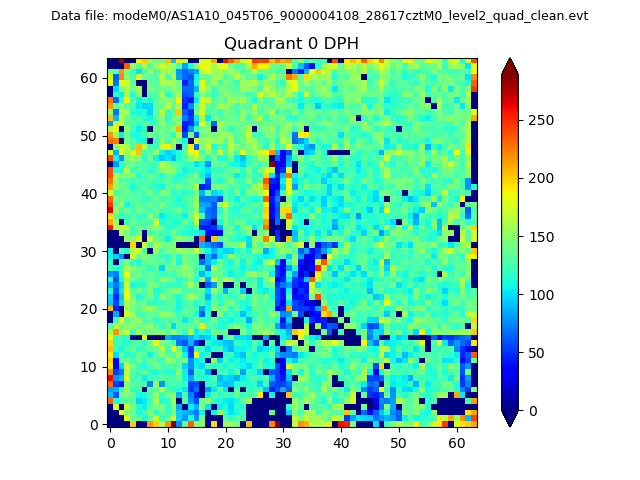 |
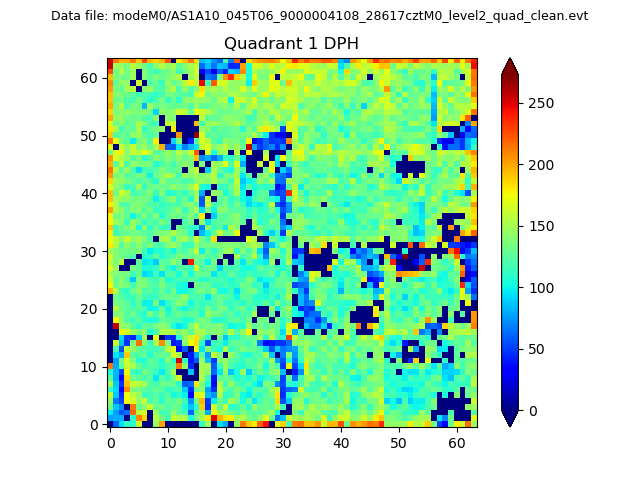 |
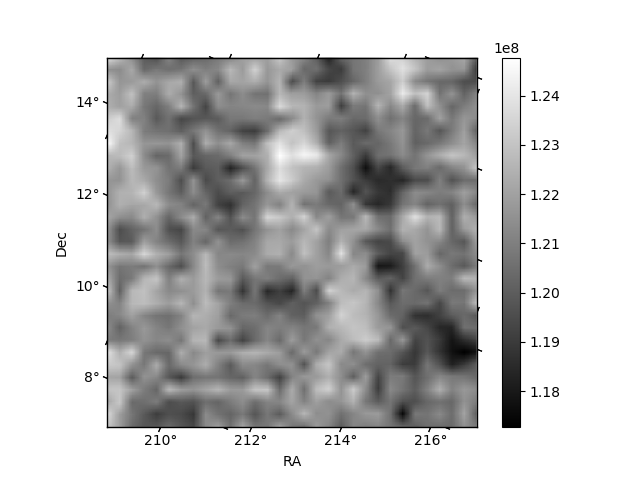
Quadrant B |
|---|---|---|---|
| Quadrant D | 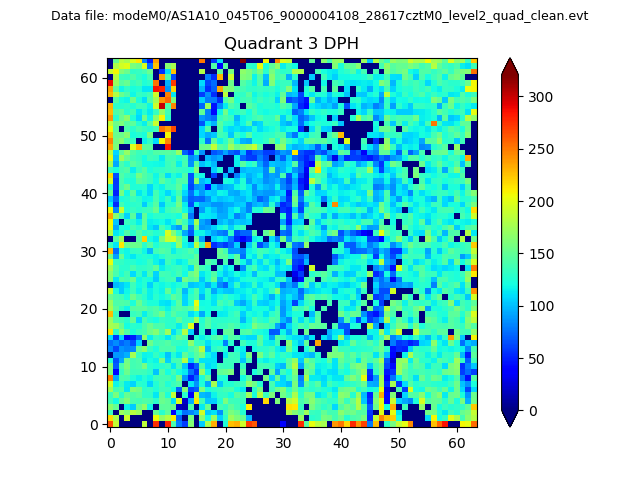 |
 |
Quadrant C |
| Plot type | Count rate plots | Images |
|---|---|---|
| Comparison with Poisson distribution Blue bars denote a histogram of data divided into 1 sec bins. Red curve is a Poisson curve with rate = median count rate of data. |
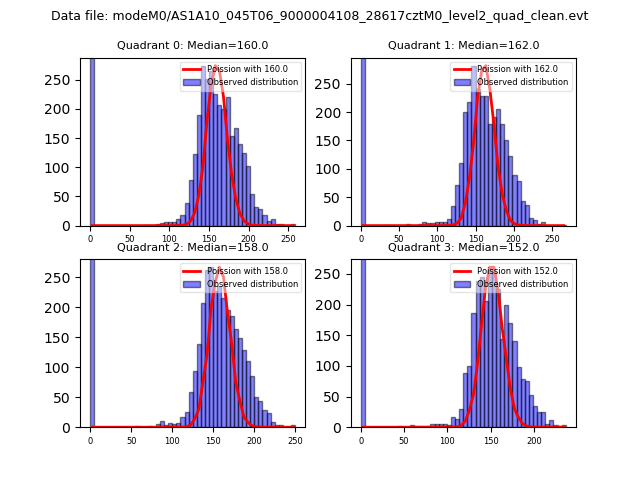 |
 |
| Quadrant-wise count rates Data is divided into 100 sec bins |
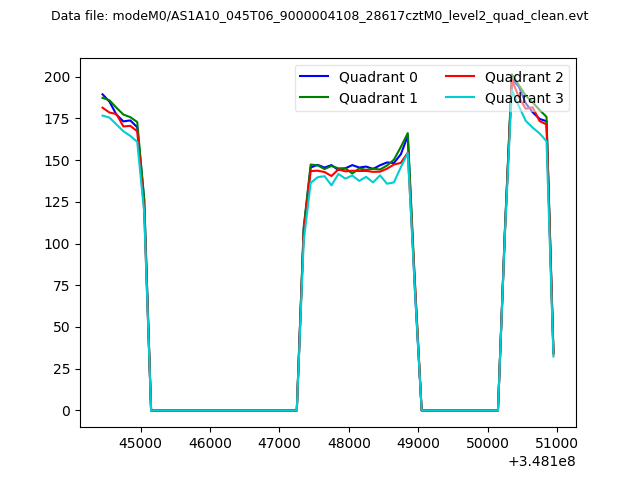 |
|
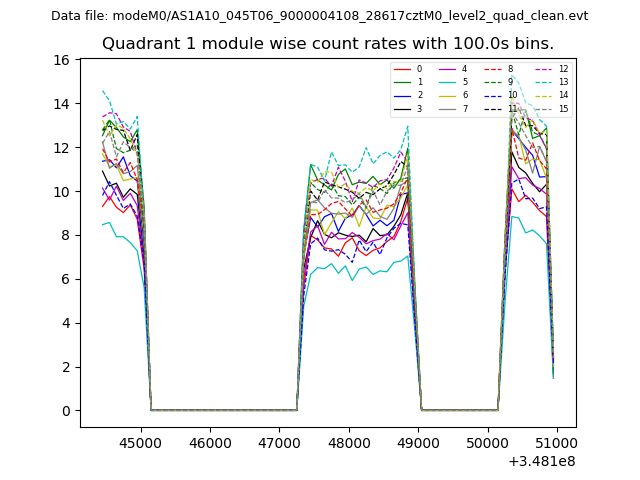
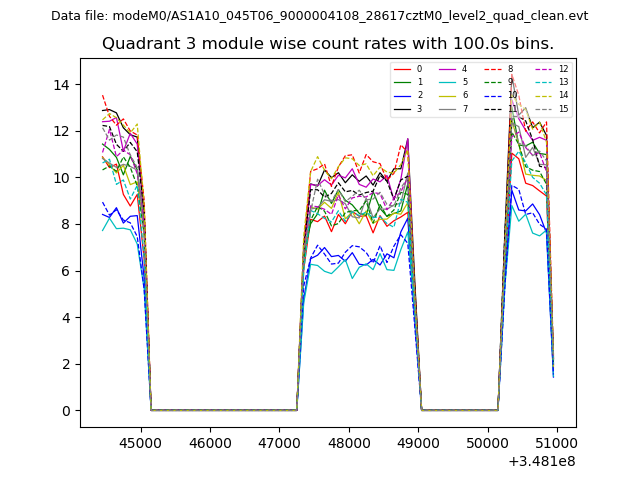
| Module-wise count rates for Quadrant A Data is divided into 100 sec bins |
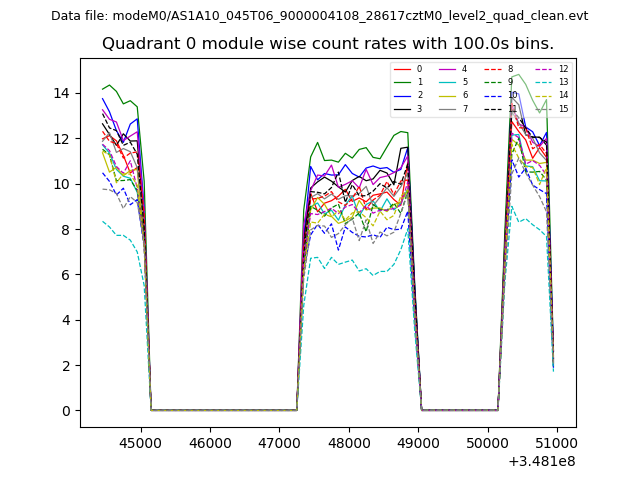 |
 |
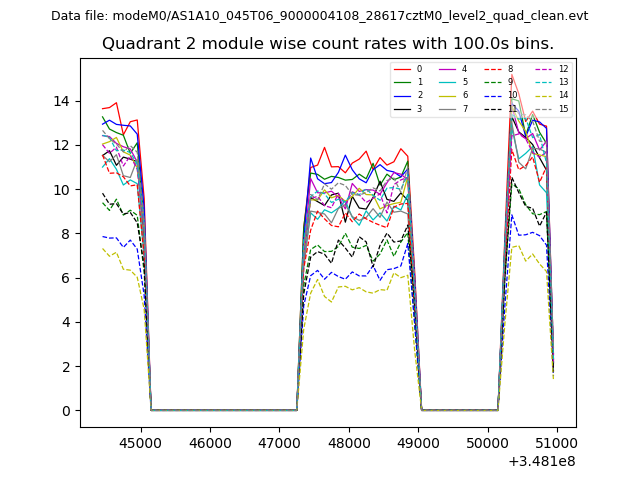
| Module-wise count rates for Quadrant B Data is divided into 100 sec bins |
 |
 |
| Module-wise count rates for Quadrant C Data is divided into 100 sec bins |
 |
 |
| Module-wise count rates for Quadrant D Data is divided into 100 sec bins |
 |
 |
| Parameter | Plot |
|---|---|
| CZT HV Monitor | 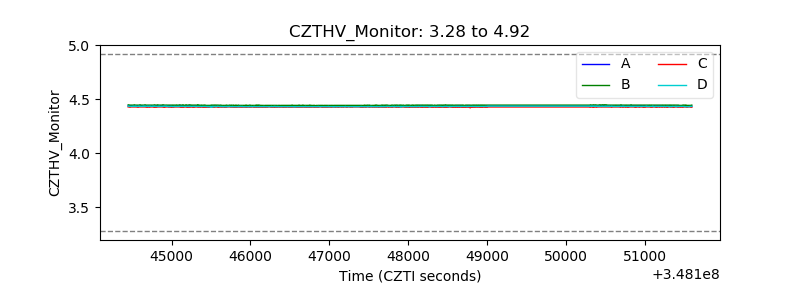 |
| D_VDD | 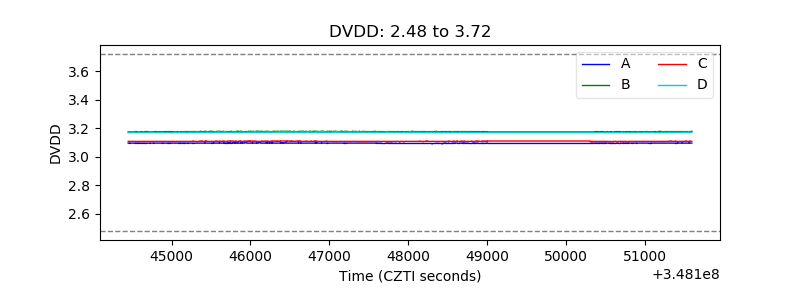 |
| Temperature 1 | 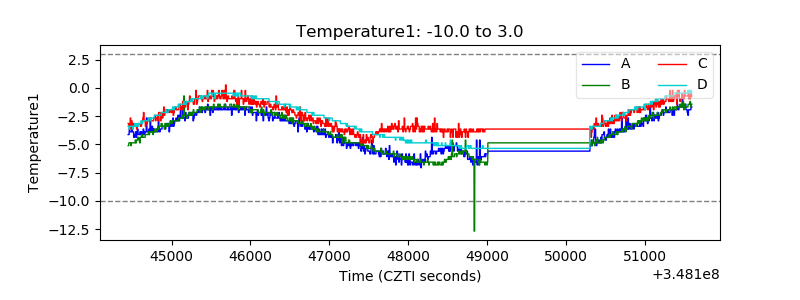 |
| Veto HV Monitor | 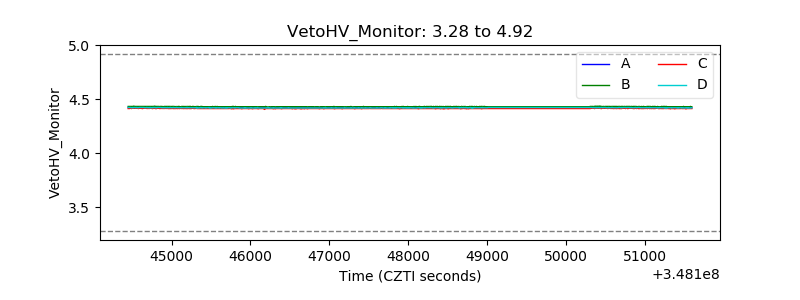 |
| Veto LLD | 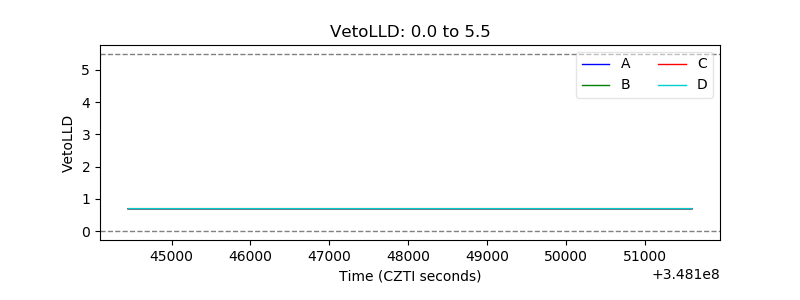 |
| Alpha Counter | 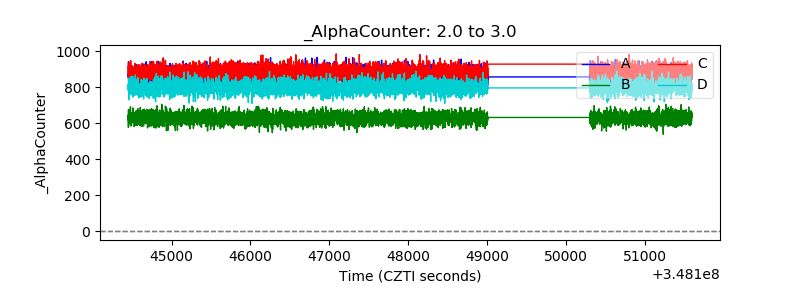 |
| _CPM_Rate | 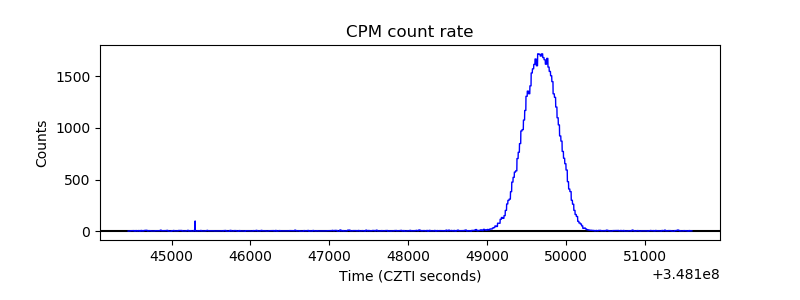 |
| CZT Counter |  |
| +2.5 Volts monitor |  |
| +5 Volts monitor |  |
| _ROLL_ROT | 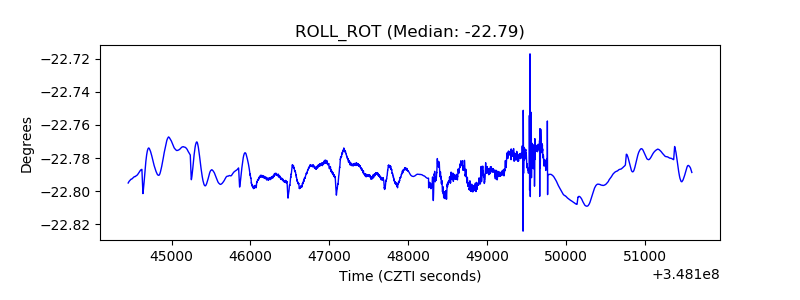 |
| _Roll_DEC | 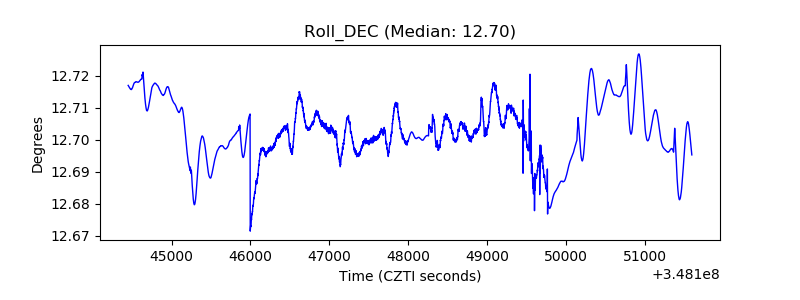 |
| _Roll_RA | 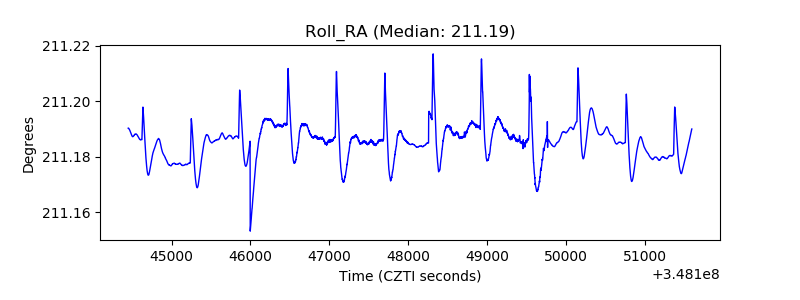 |
| Veto Counter | 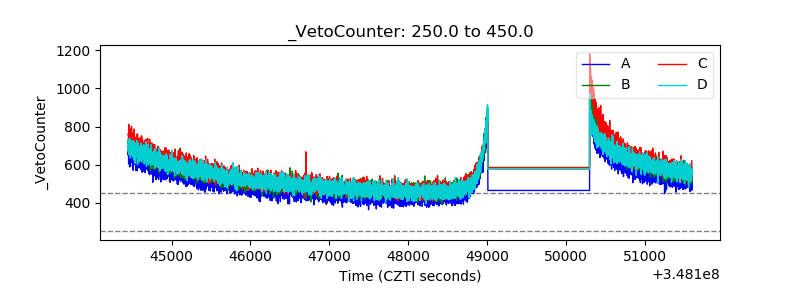 |