| Param | Original file | Final file |
|---|---|---|
| Filename | modeM0/AS1A10_045T06_9000004108_28618cztM0_level2.evt | modeM0/AS1A10_045T06_9000004108_28618cztM0_level2_quad_clean.evt |
| Size (bytes) | 549,155,520 | 76,921,920 |
| Size | 523.7 MB | 73.4 MB |
| Events in quadrant A | 3,432,995 | 478,598 |
| Events in quadrant B | 3,774,103 | 484,404 |
| Events in quadrant C | 3,533,362 | 470,820 |
| Events in quadrant D | 5,460,045 | 451,758 |
| Mode M9 | |||
|---|---|---|---|
| Quadrant | BADHDUFLAG | Total packets | Discarded packets |
| A | 0 | 13 | 0 |
| B | 0 | 14 | 0 |
| C | 0 | 14 | 0 |
| D | 0 | 14 | 0 |
| Mode M0 | |||
|---|---|---|---|
| Quadrant | BADHDUFLAG | Total packets | Discarded packets |
| A | 0 | 13888 | 2 |
| B | 0 | 14957 | 2 |
| C | 0 | 14166 | 2 |
| D | 0 | 21101 | 2 |
| Mode SS | |||
|---|---|---|---|
| Quadrant | BADHDUFLAG | Total packets | Discarded packets |
| A | 0 | 128 | 0 |
| B | 0 | 128 | 0 |
| C | 0 | 128 | 0 |
| D | 0 | 128 | 0 |
| Quadrant | Total seconds | Saturated seconds | Saturation percentage |
|---|---|---|---|
| A | 6361 | 112 | 1.760729% |
| B | 6361 | 201 | 3.159881% |
| C | 6361 | 137 | 2.153749% |
| D | 6361 | 319 | 5.014935% |
Noise dominated data is calculated using 1-second bins in cleaned event files. If a bin has >2000 counts, and if more than 50% of those come from <1% of pixels, then it is considered to be noise-dominated and hence unusable.
| Quadrant | # 1 sec bins | Bins with >0 counts | Bins with >2000 counts | High rate bins dominated by noise | Noise dominated (total time) | Noise dominated (detector-on time) | Marked lightcurve |
|---|---|---|---|---|---|---|---|
| A | 7566 | 6361 | 1 | 1 | 0.01% | 0.02% |  |
| B | 7566 | 6361 | 54 | 54 | 0.71% | 0.85% |  |
| C | 7566 | 6361 | 0 | 0 | 0.00% | 0.00% | 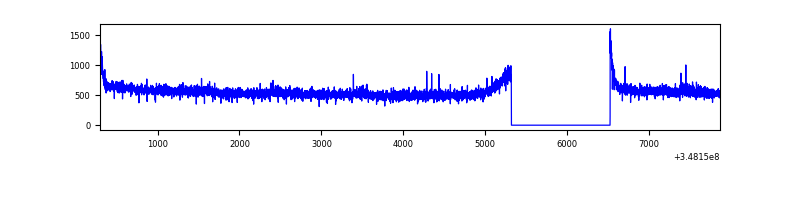 |
| D | 7566 | 6361 | 240 | 240 | 3.17% | 3.77% |  |
Top three noisy pixels from each quadrant. If the there are fewer than three noisy pixels in the level2.evt file, extra rows are filled as -1
| Pixel properties | Quadrant properties | ||||||
|---|---|---|---|---|---|---|---|
| Quadrant | DetID | PixID | Counts | Sigma | Mean | Median | Sigma |
| A | 13 | 254 | 11531 | 60.57 | 885 | 870 | 176.0 |
| A | 8 | 192 | 8649 | 44.2 | 885 | 870 | 176.0 |
| A | 3 | 137 | 8004 | 40.53 | 885 | 870 | 176.0 |
| B | 10 | 245 | 328643 | 2018.38 | 863 | 845 | 162.4 |
| B | 12 | 111 | 19365 | 114.03 | 863 | 845 | 162.4 |
| B | 11 | 111 | 17852 | 104.72 | 863 | 845 | 162.4 |
| C | 14 | 238 | 138680 | 699.88 | 850 | 858 | 196.9 |
| C | 3 | 233 | 64525 | 323.31 | 850 | 858 | 196.9 |
| C | 7 | 247 | 11636 | 54.73 | 850 | 858 | 196.9 |
| D | 8 | 195 | 897253 | 4516.55 | 853 | 833 | 198.5 |
| D | 1 | 52 | 859793 | 4327.81 | 853 | 833 | 198.5 |
| D | 2 | 250 | 196003 | 983.35 | 853 | 833 | 198.5 |
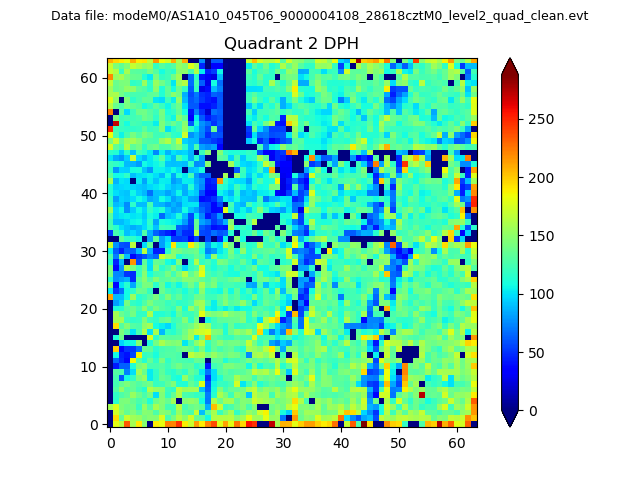
Histogram calculated using DETX and DETY for each event in the final _common_clean file
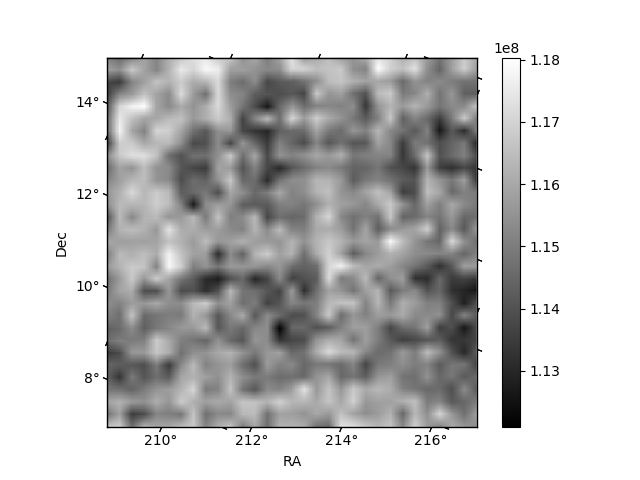
| Quadrant A | 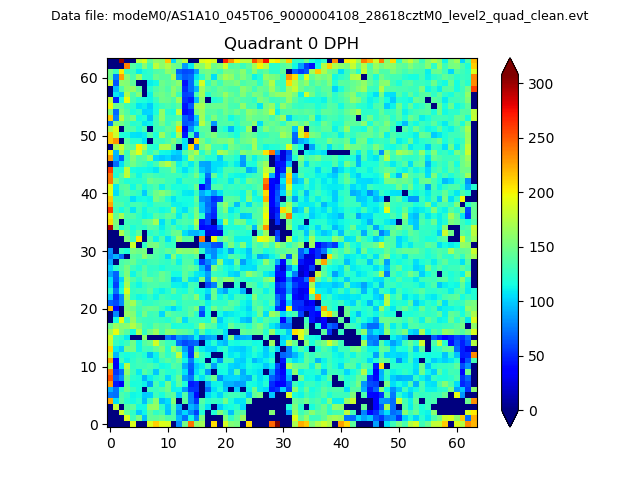 |
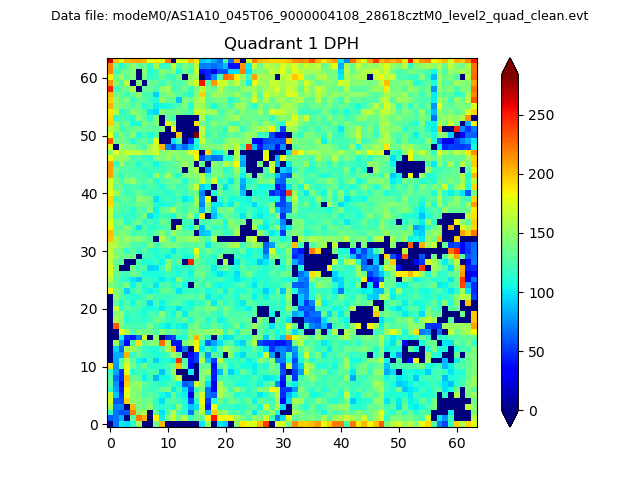 |
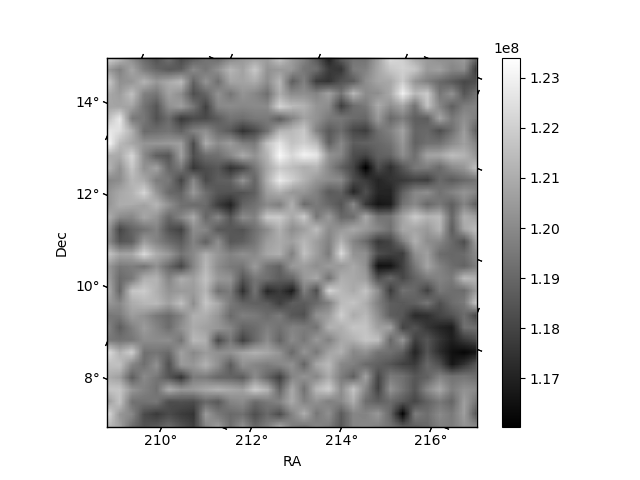
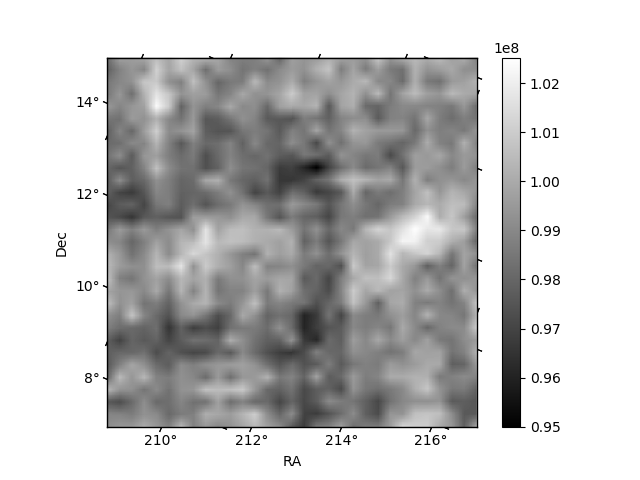
Quadrant B |
|---|---|---|---|
| Quadrant D | 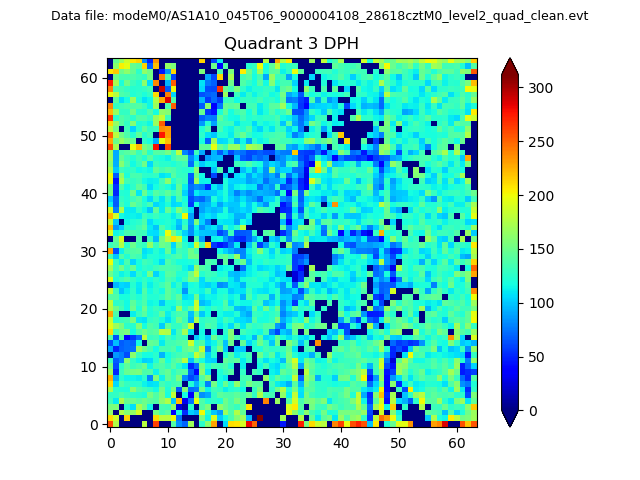 |
 |
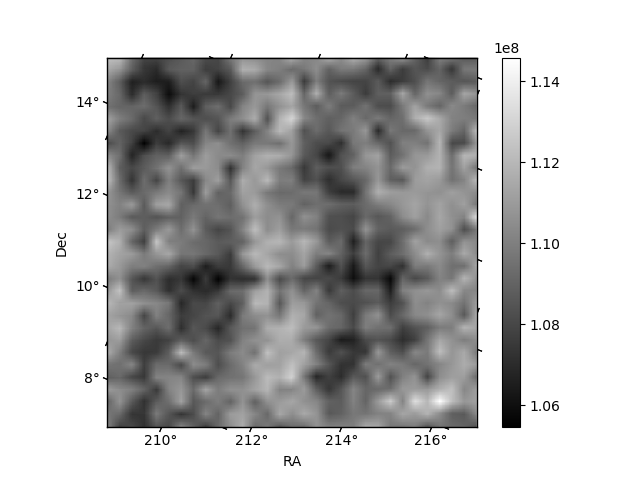
Quadrant C |
| Plot type | Count rate plots | Images |
|---|---|---|
| Comparison with Poisson distribution Blue bars denote a histogram of data divided into 1 sec bins. Red curve is a Poisson curve with rate = median count rate of data. |
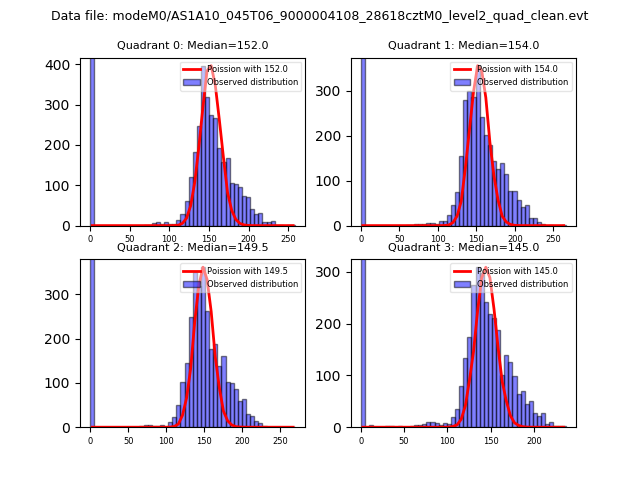 |
 |
| Quadrant-wise count rates Data is divided into 100 sec bins |
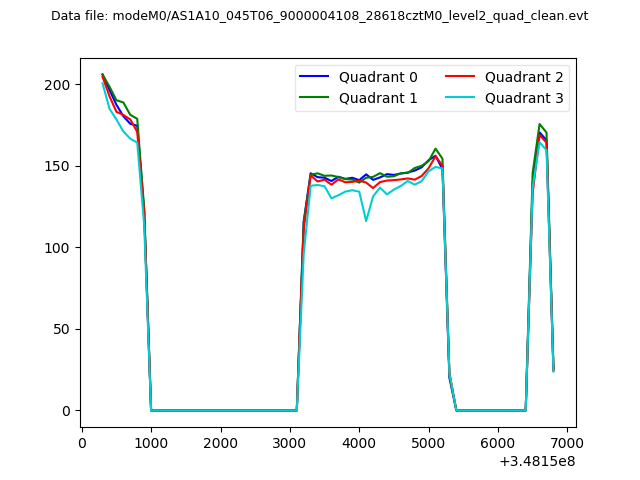 |
|
| Module-wise count rates for Quadrant A Data is divided into 100 sec bins |
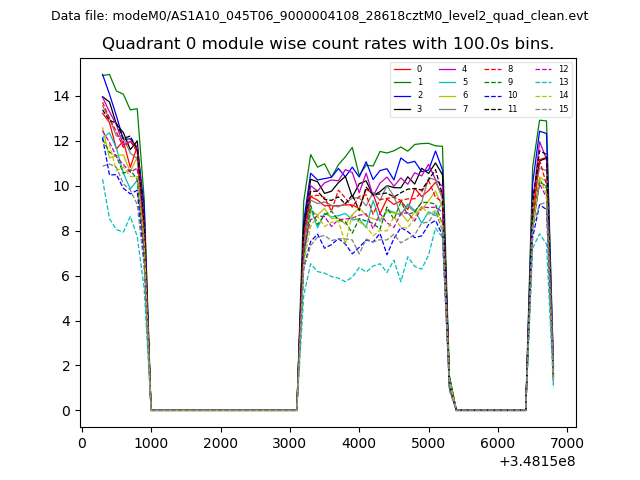 |
 |
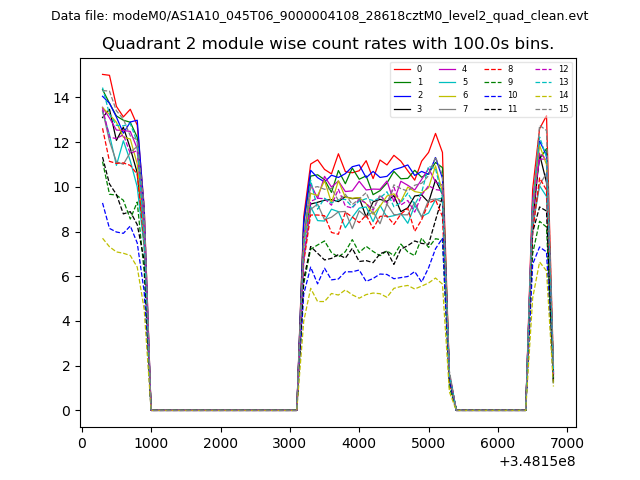
| Module-wise count rates for Quadrant B Data is divided into 100 sec bins |
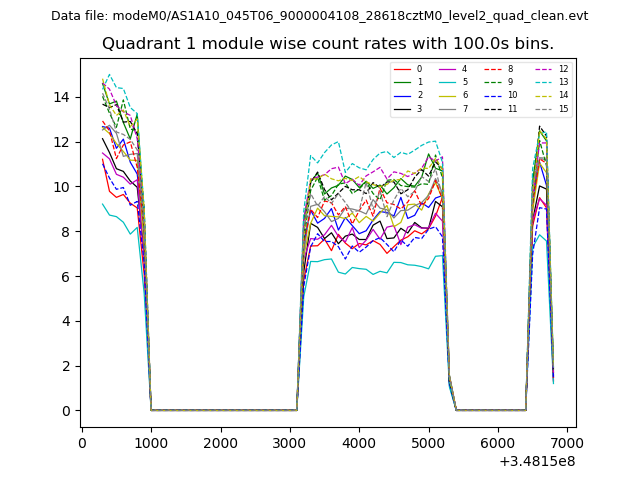 |
 |
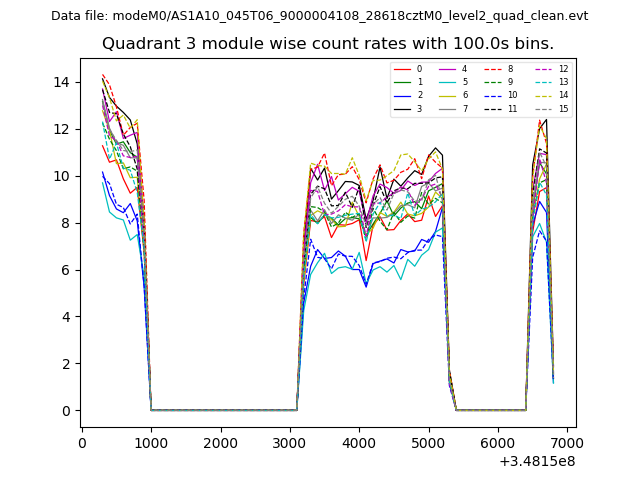
| Module-wise count rates for Quadrant C Data is divided into 100 sec bins |
 |
 |
| Module-wise count rates for Quadrant D Data is divided into 100 sec bins |
 |
 |
| Parameter | Plot |
|---|---|
| CZT HV Monitor | 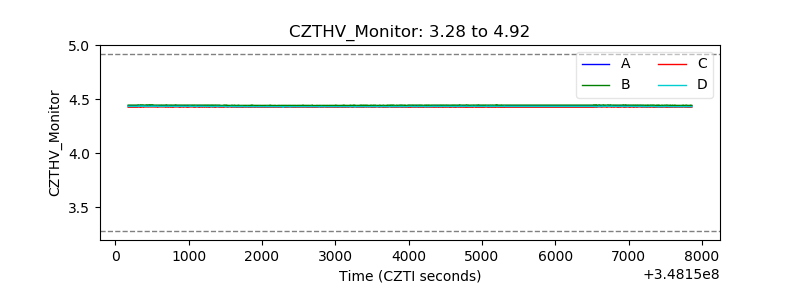 |
| D_VDD | 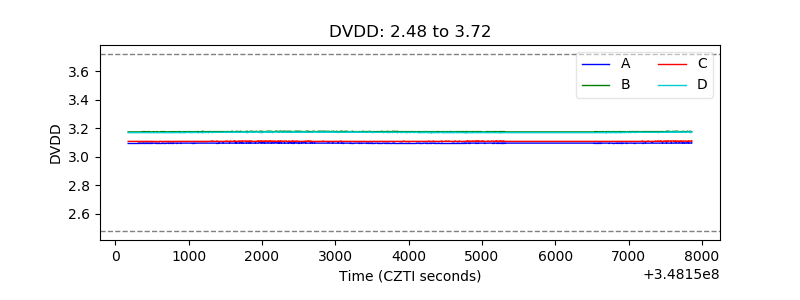 |
| Temperature 1 | 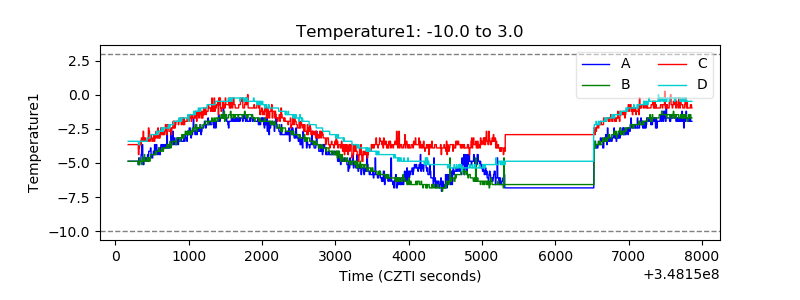 |
| Veto HV Monitor | 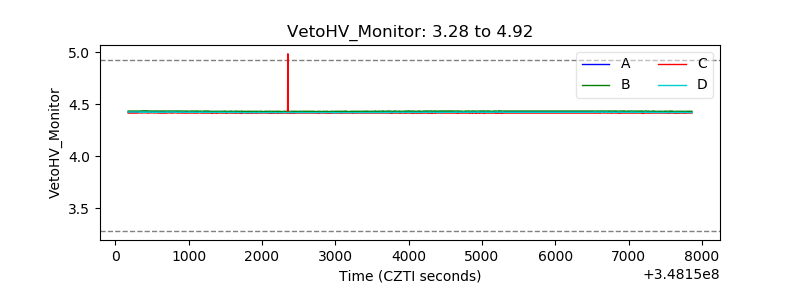 |
| Veto LLD | 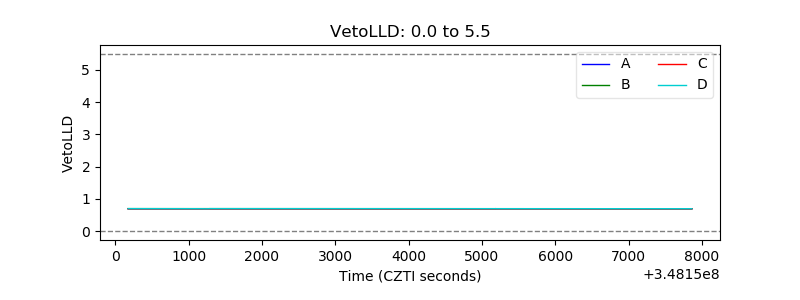 |
| Alpha Counter | 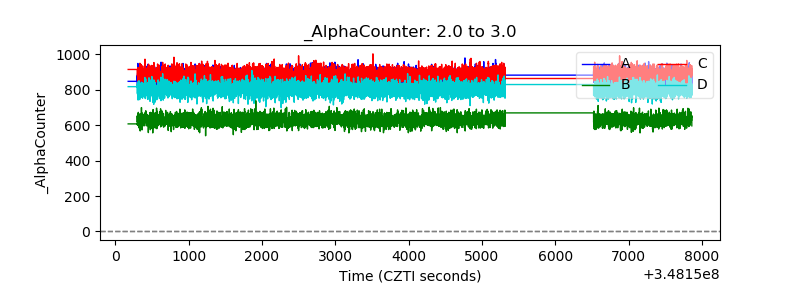 |
| _CPM_Rate | 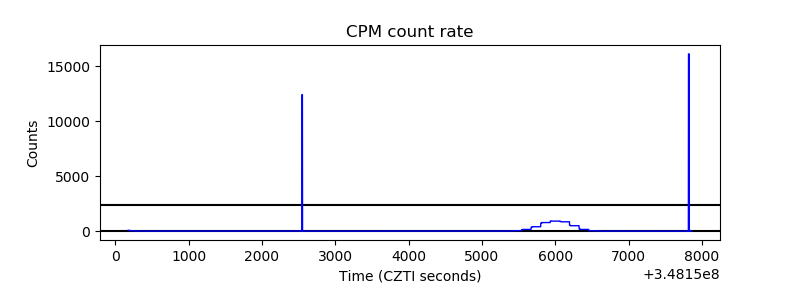 |
| CZT Counter | 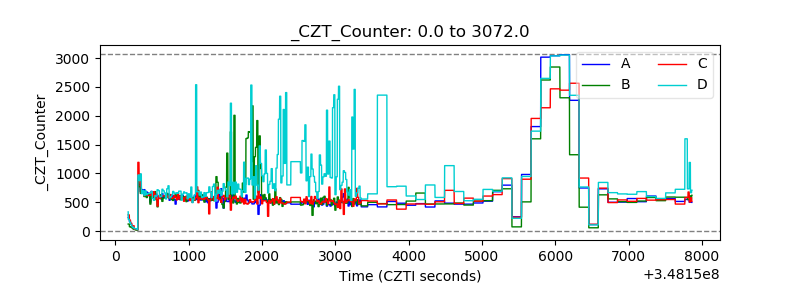 |
| +2.5 Volts monitor |  |
| +5 Volts monitor | 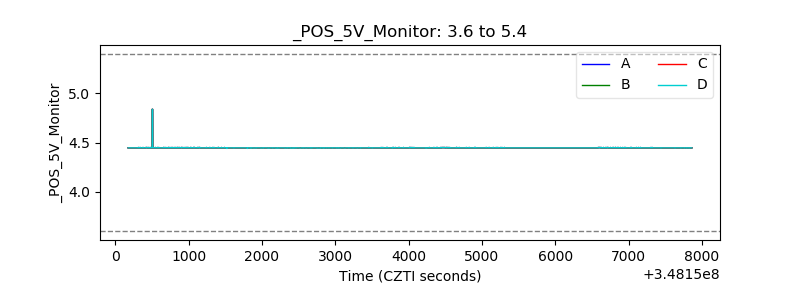 |
| _ROLL_ROT | 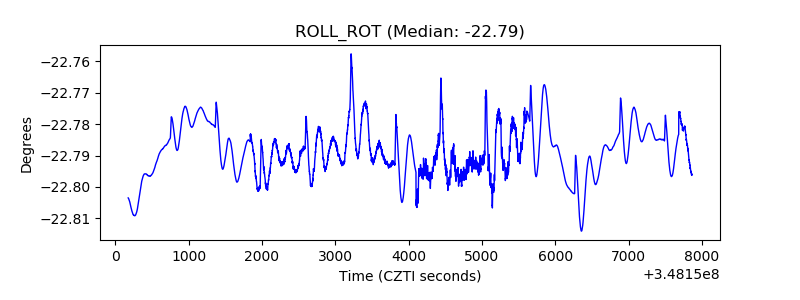 |
| _Roll_DEC | 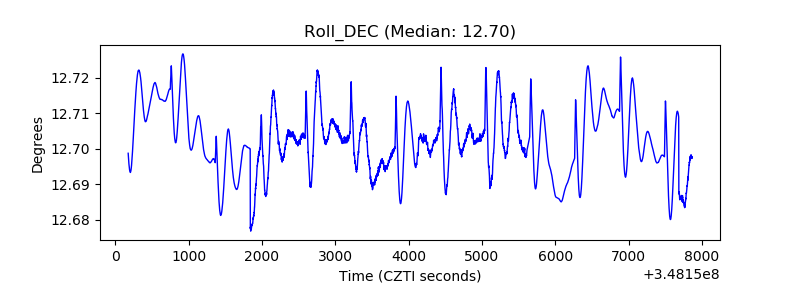 |
| _Roll_RA | 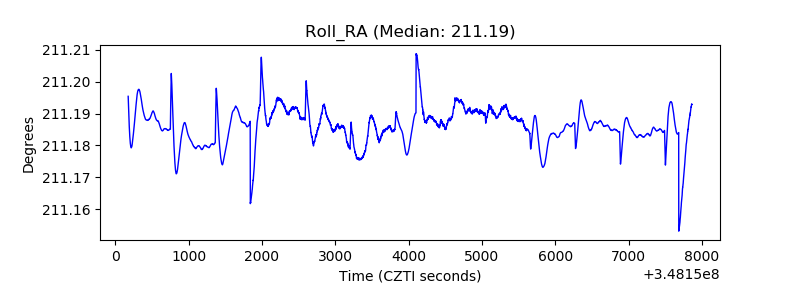 |
| Veto Counter | 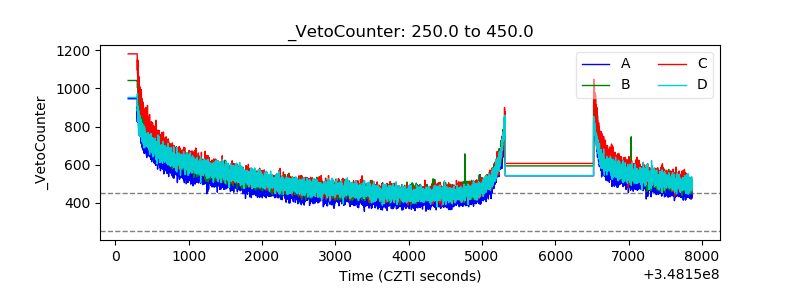 |