| Param | Original file | Final file |
|---|---|---|
| Filename | modeM0/AS1A10_045T06_9000004108_28619cztM0_level2.evt | modeM0/AS1A10_045T06_9000004108_28619cztM0_level2_quad_clean.evt |
| Size (bytes) | 570,484,800 | 71,536,320 |
| Size | 544.1 MB | 68.2 MB |
| Events in quadrant A | 3,550,293 | 428,649 |
| Events in quadrant B | 3,809,368 | 432,308 |
| Events in quadrant C | 3,734,153 | 421,955 |
| Events in quadrant D | 5,718,471 | 404,918 |
| Mode M9 | |||
|---|---|---|---|
| Quadrant | BADHDUFLAG | Total packets | Discarded packets |
| A | 0 | 14 | 0 |
| B | 0 | 15 | 0 |
| C | 0 | 15 | 0 |
| D | 0 | 15 | 0 |
| Mode M0 | |||
|---|---|---|---|
| Quadrant | BADHDUFLAG | Total packets | Discarded packets |
| A | 0 | 14555 | 2 |
| B | 0 | 15318 | 2 |
| C | 0 | 15101 | 4 |
| D | 0 | 21845 | 2 |
| Mode SS | |||
|---|---|---|---|
| Quadrant | BADHDUFLAG | Total packets | Discarded packets |
| A | 0 | 140 | 0 |
| B | 0 | 140 | 0 |
| C | 0 | 140 | 0 |
| D | 0 | 140 | 0 |
| Quadrant | Total seconds | Saturated seconds | Saturation percentage |
|---|---|---|---|
| A | 6860 | 112 | 1.632653% |
| B | 6860 | 158 | 2.303207% |
| C | 6859 | 169 | 2.463916% |
| D | 6859 | 340 | 4.956991% |
Noise dominated data is calculated using 1-second bins in cleaned event files. If a bin has >2000 counts, and if more than 50% of those come from <1% of pixels, then it is considered to be noise-dominated and hence unusable.
| Quadrant | # 1 sec bins | Bins with >0 counts | Bins with >2000 counts | High rate bins dominated by noise | Noise dominated (total time) | Noise dominated (detector-on time) | Marked lightcurve |
|---|---|---|---|---|---|---|---|
| A | 7840 | 6860 | 0 | 0 | 0.00% | 0.00% | 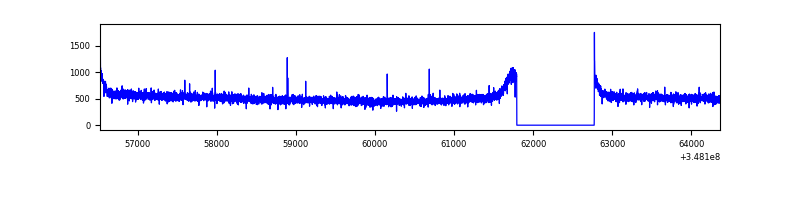 |
| B | 7840 | 6860 | 24 | 24 | 0.31% | 0.35% | 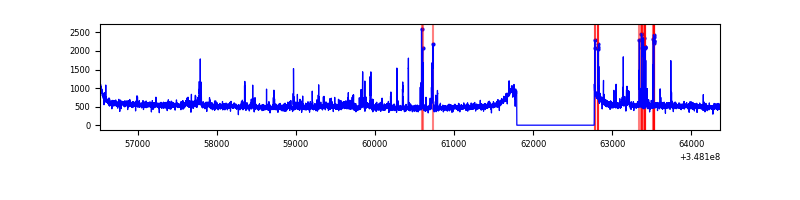 |
| C | 7839 | 6859 | 1 | 1 | 0.01% | 0.01% | 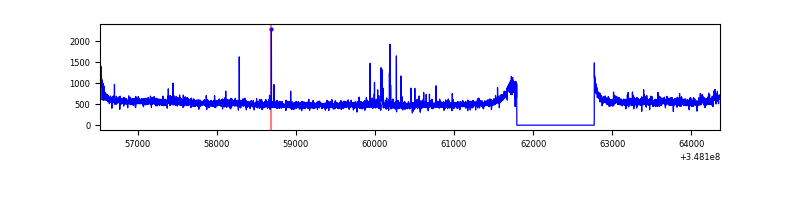 |
| D | 7839 | 6859 | 198 | 198 | 2.53% | 2.89% | 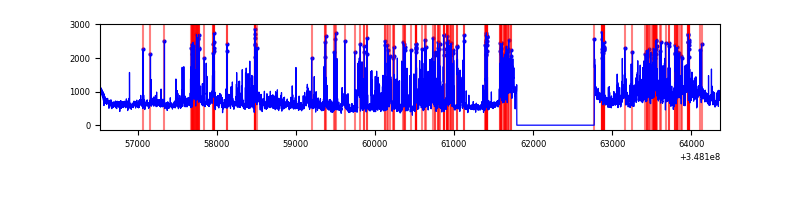 |
Top three noisy pixels from each quadrant. If the there are fewer than three noisy pixels in the level2.evt file, extra rows are filled as -1
| Pixel properties | Quadrant properties | ||||||
|---|---|---|---|---|---|---|---|
| Quadrant | DetID | PixID | Counts | Sigma | Mean | Median | Sigma |
| A | 13 | 254 | 12788 | 64.33 | 915 | 895 | 184.9 |
| A | 15 | 47 | 12660 | 63.63 | 915 | 895 | 184.9 |
| A | 3 | 137 | 8505 | 41.16 | 915 | 895 | 184.9 |
| B | 10 | 245 | 103990 | 607.29 | 897 | 878 | 169.8 |
| B | 10 | 246 | 86057 | 501.67 | 897 | 878 | 169.8 |
| B | 4 | 171 | 53430 | 309.51 | 897 | 878 | 169.8 |
| C | 14 | 238 | 141882 | 687.56 | 878 | 888 | 205.1 |
| C | 3 | 233 | 95259 | 460.2 | 878 | 888 | 205.1 |
| C | 7 | 247 | 58133 | 279.16 | 878 | 888 | 205.1 |
| D | 1 | 52 | 1214877 | 5866.61 | 876 | 856 | 206.9 |
| D | 8 | 195 | 828750 | 4000.7 | 876 | 856 | 206.9 |
| D | 2 | 250 | 224092 | 1078.76 | 876 | 856 | 206.9 |
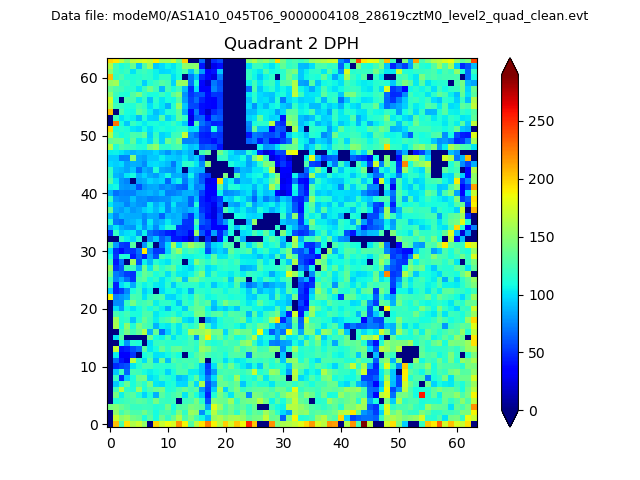
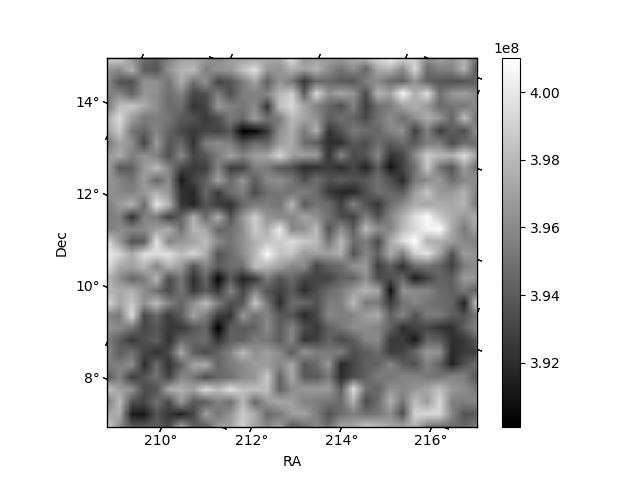
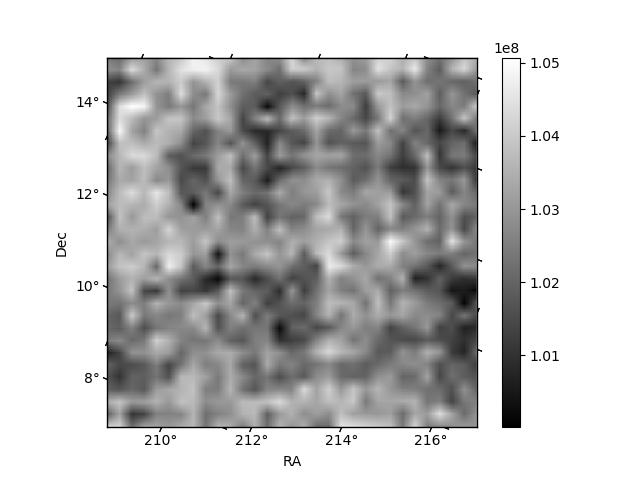
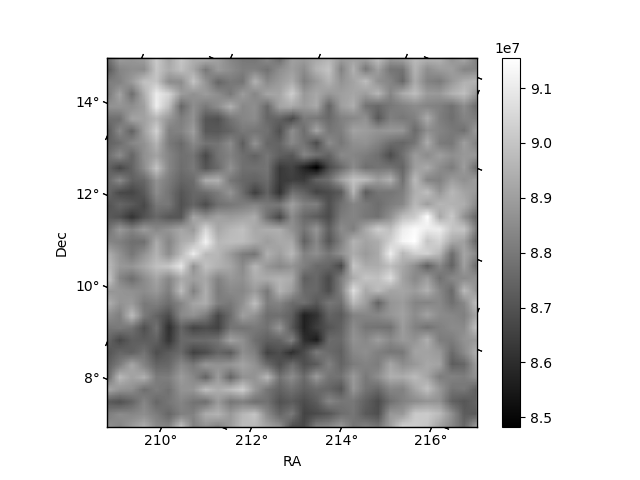
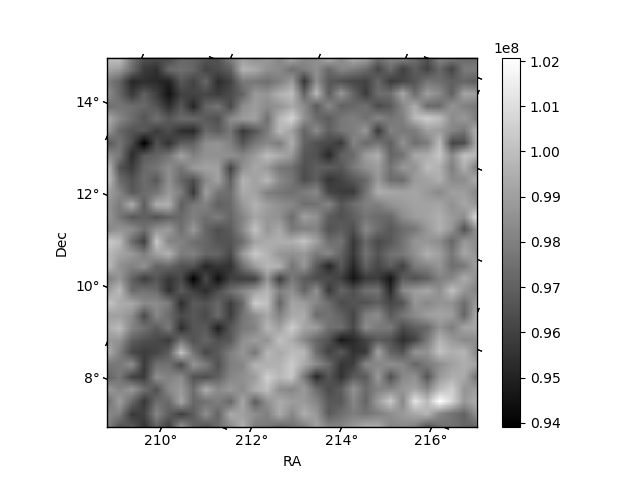
Histogram calculated using DETX and DETY for each event in the final _common_clean file
| Quadrant A | 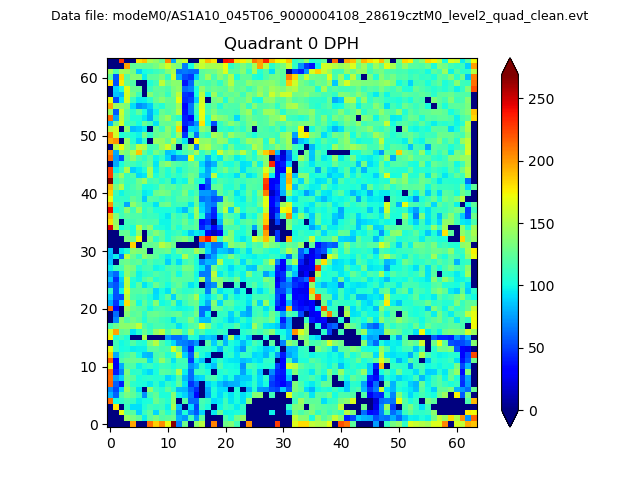 |
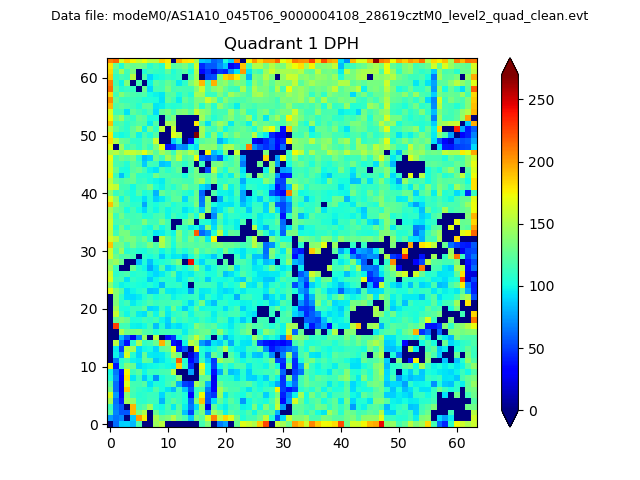 |
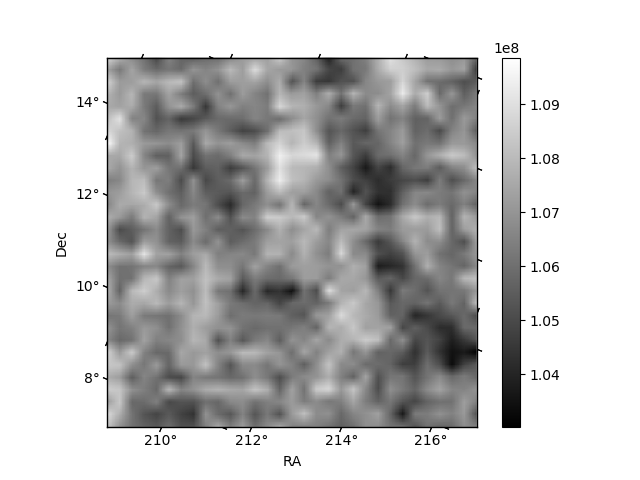
Quadrant B |
|---|---|---|---|
| Quadrant D | 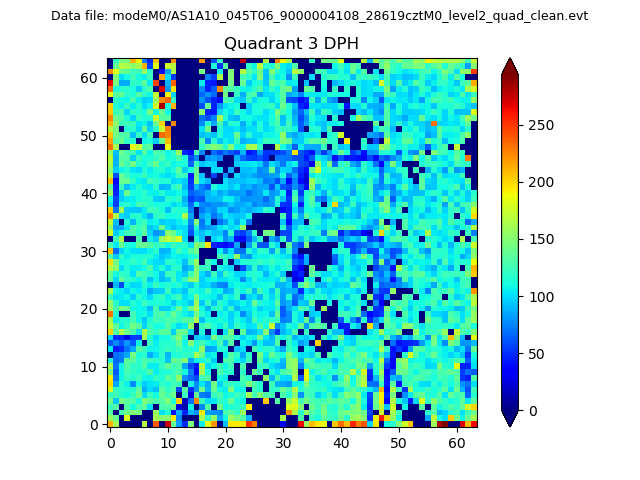 |
 |
Quadrant C |
| Plot type | Count rate plots | Images |
|---|---|---|
| Comparison with Poisson distribution Blue bars denote a histogram of data divided into 1 sec bins. Red curve is a Poisson curve with rate = median count rate of data. |
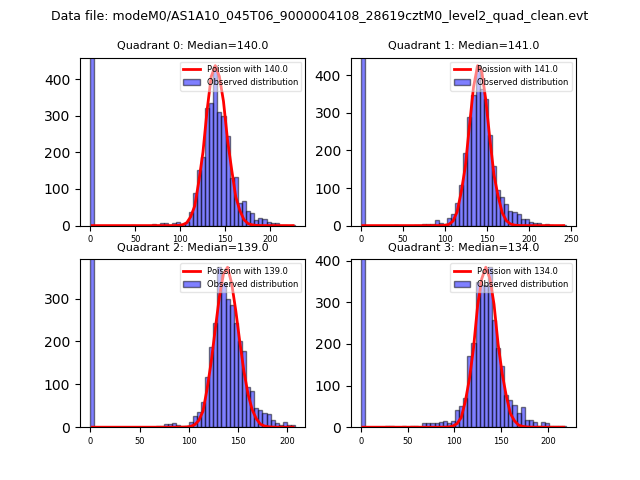 |
 |
| Quadrant-wise count rates Data is divided into 100 sec bins |
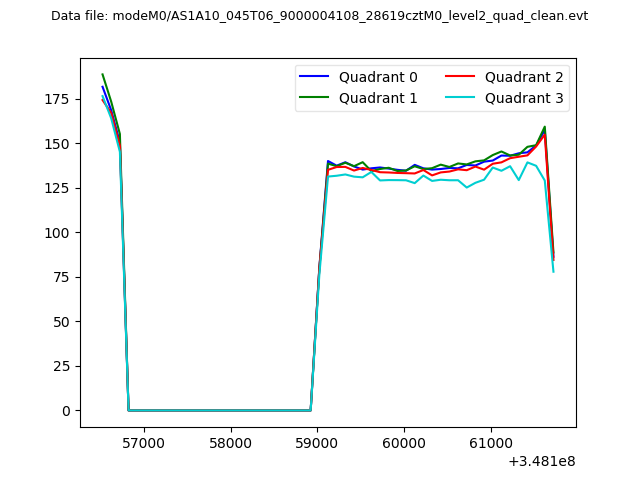 |
|
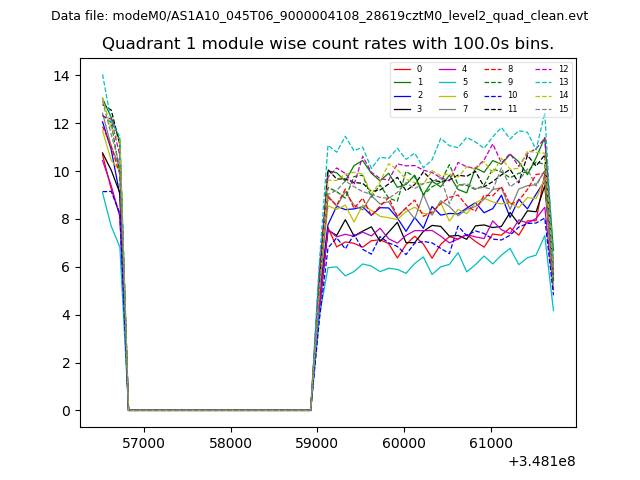
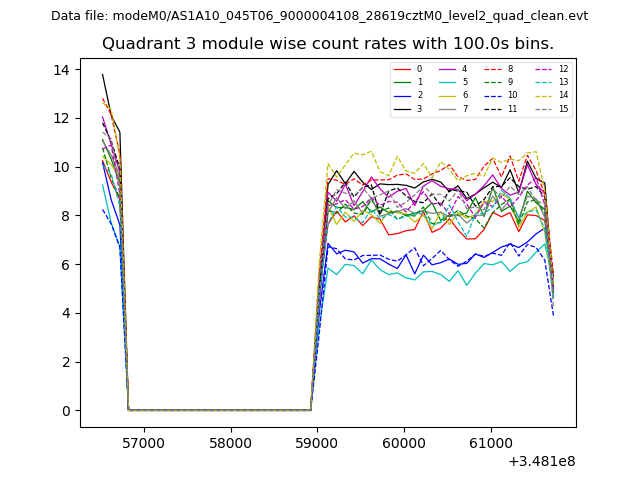
| Module-wise count rates for Quadrant A Data is divided into 100 sec bins |
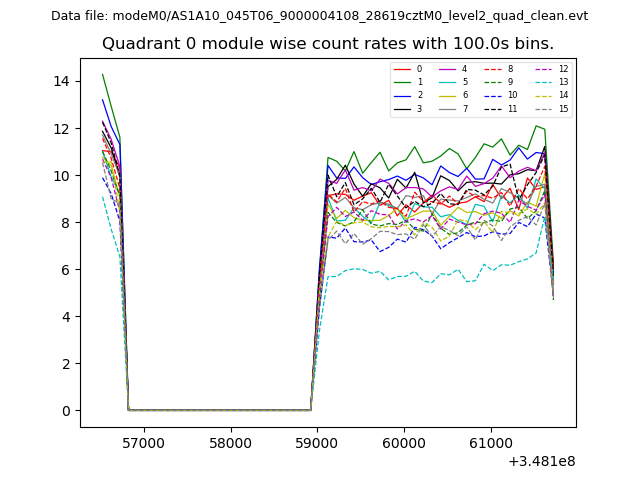 |
 |
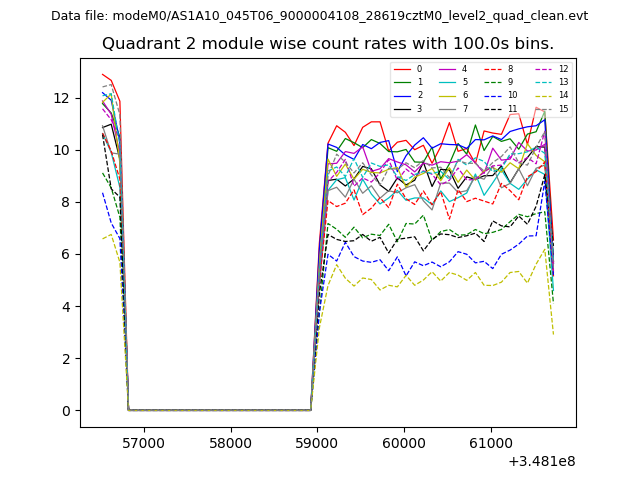
| Module-wise count rates for Quadrant B Data is divided into 100 sec bins |
 |
 |
| Module-wise count rates for Quadrant C Data is divided into 100 sec bins |
 |
 |
| Module-wise count rates for Quadrant D Data is divided into 100 sec bins |
 |
 |
| Parameter | Plot |
|---|---|
| CZT HV Monitor | 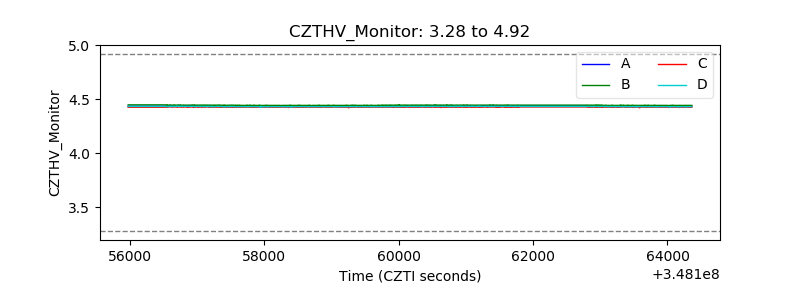 |
| D_VDD | 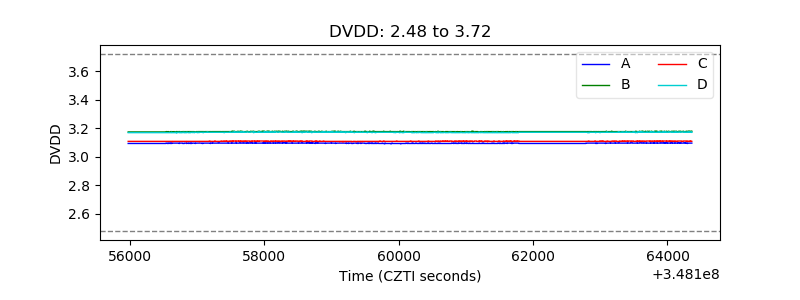 |
| Temperature 1 |  |
| Veto HV Monitor | 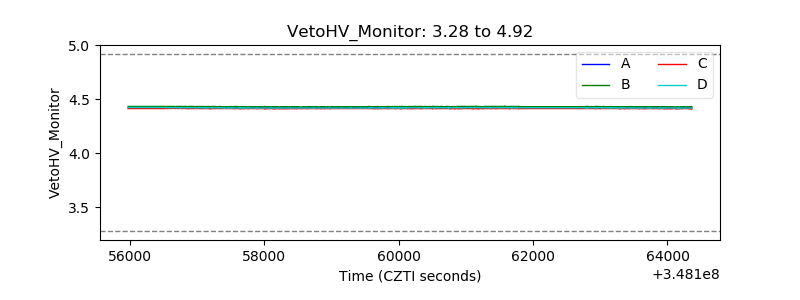 |
| Veto LLD | 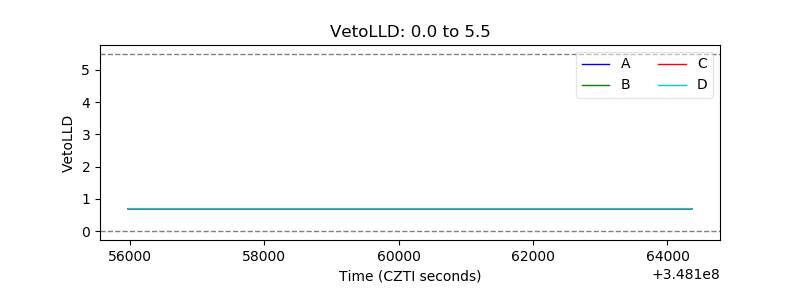 |
| Alpha Counter | 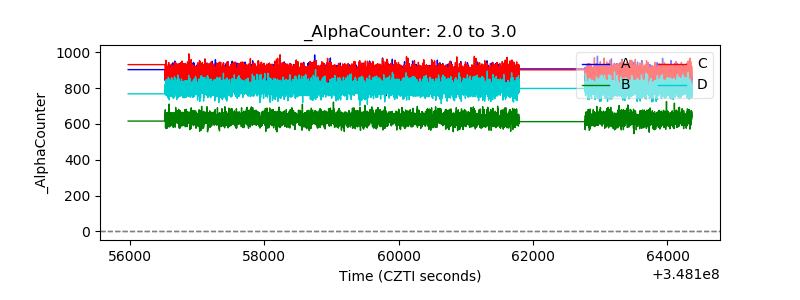 |
| _CPM_Rate | 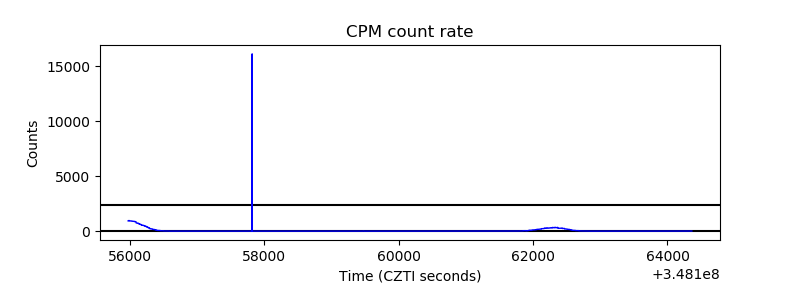 |
| CZT Counter | 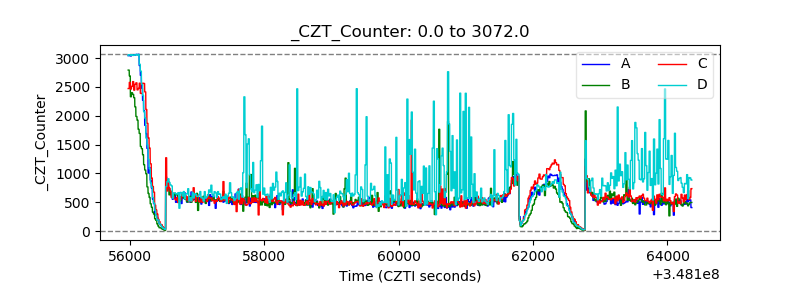 |
| +2.5 Volts monitor |  |
| +5 Volts monitor |  |
| _ROLL_ROT | 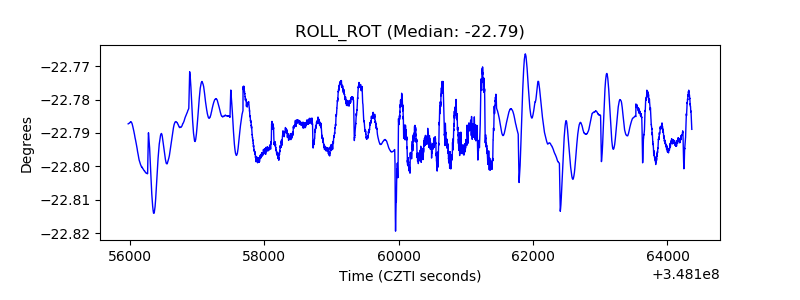 |
| _Roll_DEC | 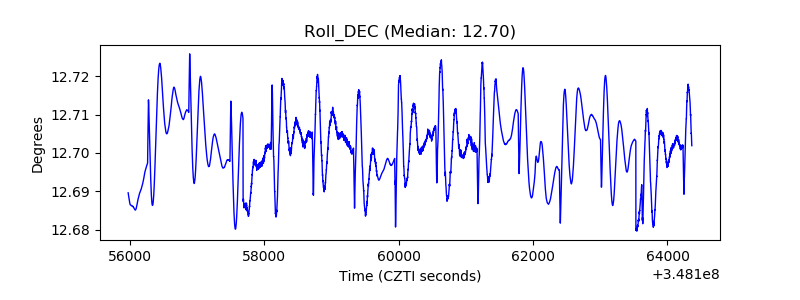 |
| _Roll_RA | 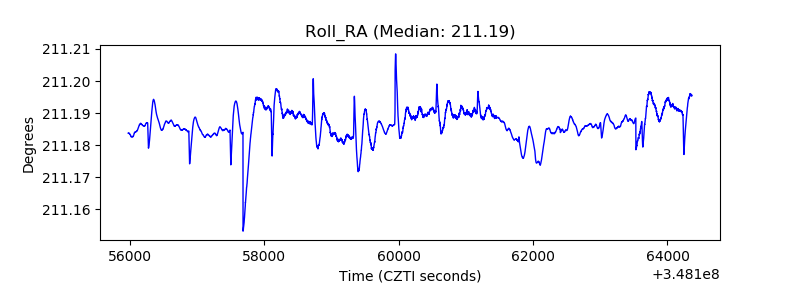 |
| Veto Counter | 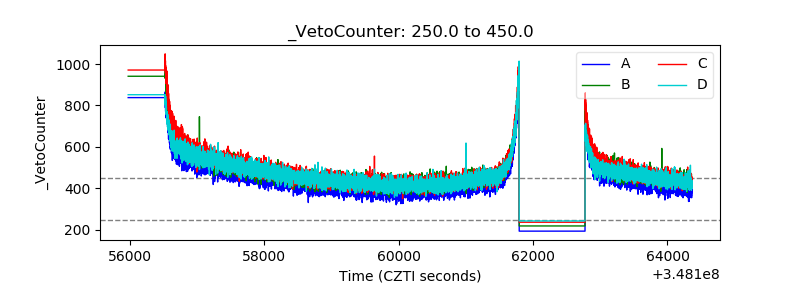 |