| Param | Original file | Final file |
|---|---|---|
| Filename | modeM0/AS1A10_045T06_9000004108_28620cztM0_level2.evt | modeM0/AS1A10_045T06_9000004108_28620cztM0_level2_quad_clean.evt |
| Size (bytes) | 610,361,280 | 76,305,600 |
| Size | 582.1 MB | 72.8 MB |
| Events in quadrant A | 3,591,776 | 461,479 |
| Events in quadrant B | 3,819,385 | 462,492 |
| Events in quadrant C | 3,883,129 | 451,913 |
| Events in quadrant D | 6,706,343 | 436,547 |
| Mode M9 | |||
|---|---|---|---|
| Quadrant | BADHDUFLAG | Total packets | Discarded packets |
| A | 0 | 5 | 0 |
| B | 0 | 5 | 0 |
| C | 0 | 5 | 0 |
| D | 0 | 5 | 0 |
| Mode M0 | |||
|---|---|---|---|
| Quadrant | BADHDUFLAG | Total packets | Discarded packets |
| A | 0 | 15044 | 3 |
| B | 0 | 15810 | 2 |
| C | 0 | 15901 | 2 |
| D | 0 | 24911 | 2 |
| Mode SS | |||
|---|---|---|---|
| Quadrant | BADHDUFLAG | Total packets | Discarded packets |
| A | 0 | 148 | 0 |
| B | 0 | 148 | 0 |
| C | 0 | 148 | 0 |
| D | 0 | 148 | 0 |
| Quadrant | Total seconds | Saturated seconds | Saturation percentage |
|---|---|---|---|
| A | 7139 | 124 | 1.736938% |
| B | 7140 | 215 | 3.011204% |
| C | 7140 | 214 | 2.997199% |
| D | 7140 | 614 | 8.599440% |
Noise dominated data is calculated using 1-second bins in cleaned event files. If a bin has >2000 counts, and if more than 50% of those come from <1% of pixels, then it is considered to be noise-dominated and hence unusable.
| Quadrant | # 1 sec bins | Bins with >0 counts | Bins with >2000 counts | High rate bins dominated by noise | Noise dominated (total time) | Noise dominated (detector-on time) | Marked lightcurve |
|---|---|---|---|---|---|---|---|
| A | 7714 | 7139 | 1 | 1 | 0.01% | 0.01% | 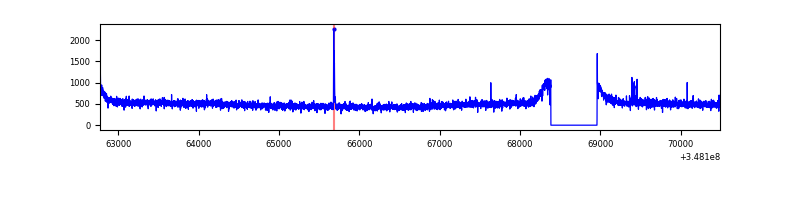 |
| B | 7715 | 7140 | 28 | 28 | 0.36% | 0.39% | 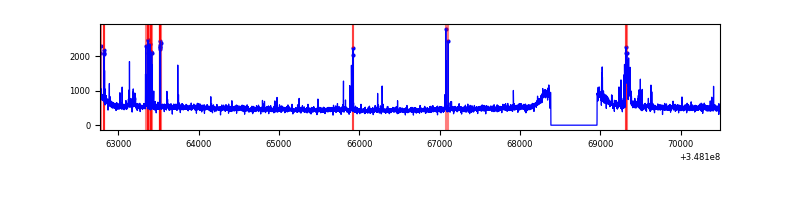 |
| C | 7715 | 7140 | 3 | 3 | 0.04% | 0.04% | 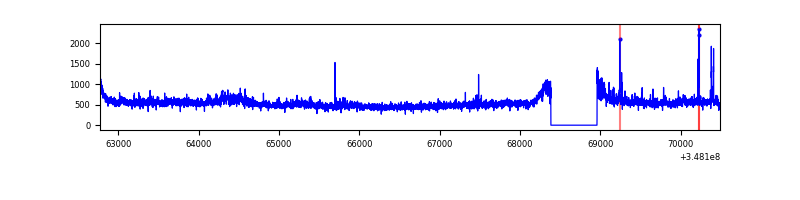 |
| D | 7715 | 7140 | 377 | 377 | 4.89% | 5.28% | 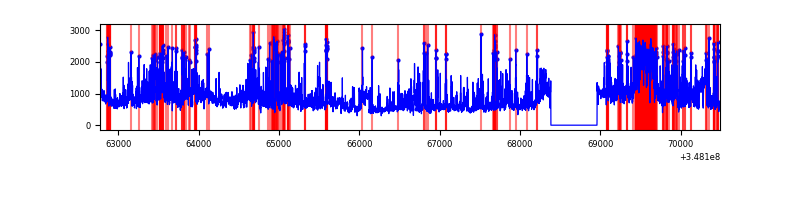 |
Top three noisy pixels from each quadrant. If the there are fewer than three noisy pixels in the level2.evt file, extra rows are filled as -1
| Pixel properties | Quadrant properties | ||||||
|---|---|---|---|---|---|---|---|
| Quadrant | DetID | PixID | Counts | Sigma | Mean | Median | Sigma |
| A | 15 | 174 | 30019 | 156.28 | 919 | 898 | 186.3 |
| A | 13 | 254 | 12851 | 64.15 | 919 | 898 | 186.3 |
| A | 15 | 47 | 9275 | 44.95 | 919 | 898 | 186.3 |
| B | 10 | 245 | 115617 | 658.47 | 903 | 880 | 174.2 |
| B | 10 | 246 | 76336 | 433.04 | 903 | 880 | 174.2 |
| B | 4 | 171 | 43976 | 247.33 | 903 | 880 | 174.2 |
| C | 3 | 233 | 226328 | 1084.64 | 882 | 889 | 207.8 |
| C | 14 | 238 | 146868 | 702.34 | 882 | 889 | 207.8 |
| C | 7 | 247 | 36516 | 171.41 | 882 | 889 | 207.8 |
| D | 1 | 52 | 1978189 | 9317.1 | 871 | 846 | 212.2 |
| D | 8 | 195 | 1123180 | 5288.36 | 871 | 846 | 212.2 |
| D | 2 | 250 | 157649 | 738.84 | 871 | 846 | 212.2 |
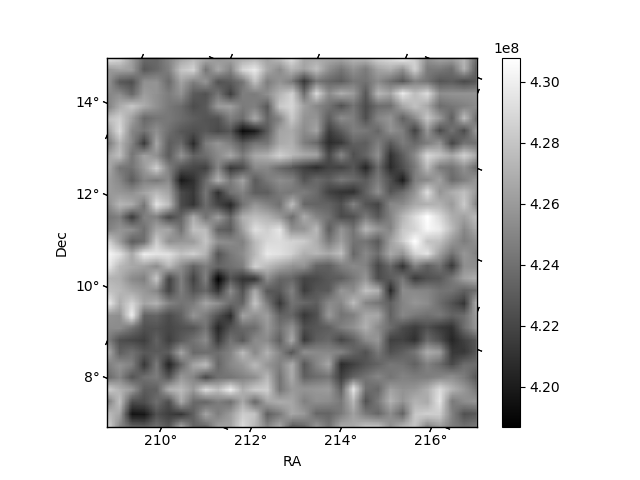
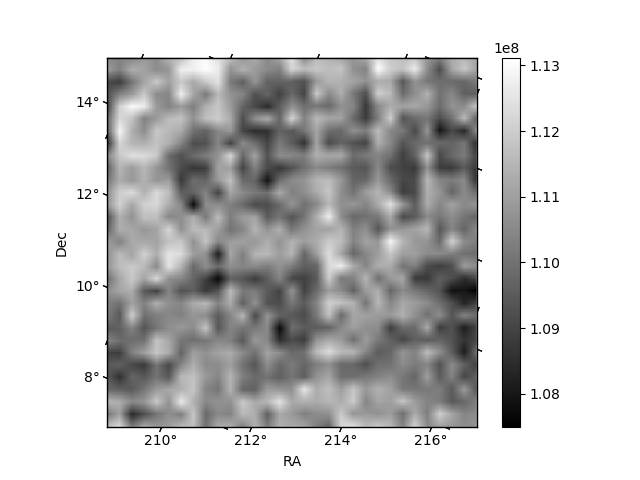
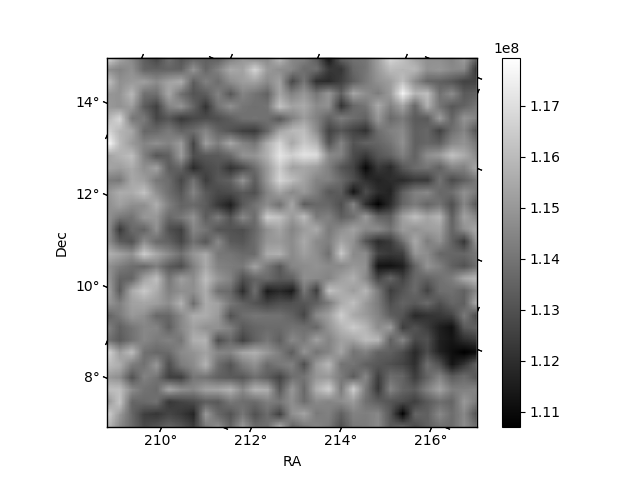
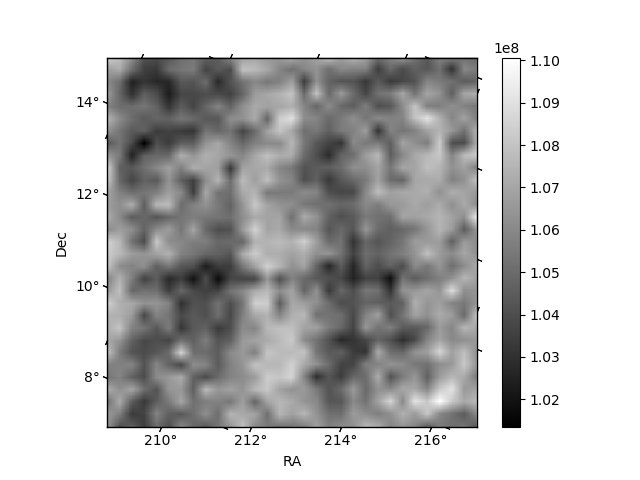
Histogram calculated using DETX and DETY for each event in the final _common_clean file
| Quadrant A | 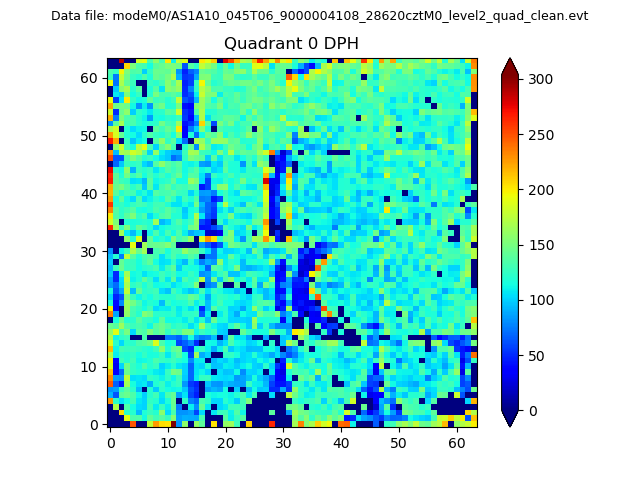 |
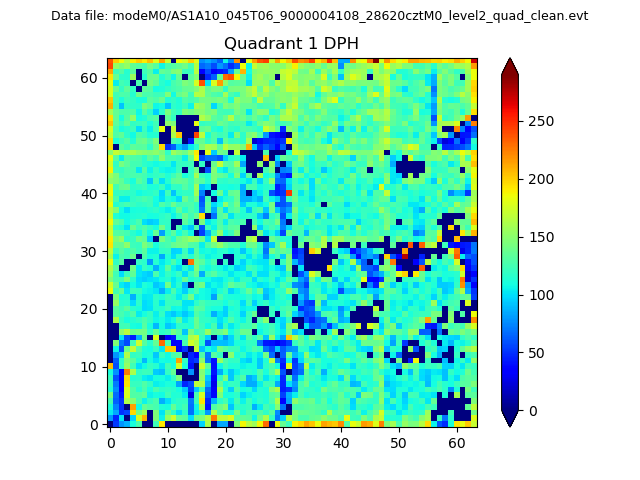 |
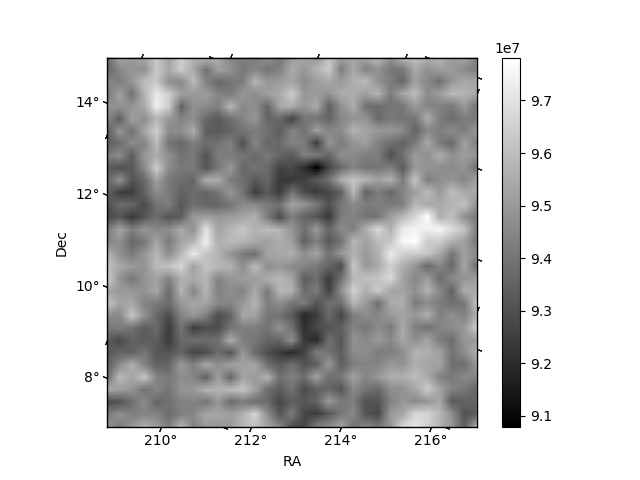
Quadrant B |
|---|---|---|---|
| Quadrant D | 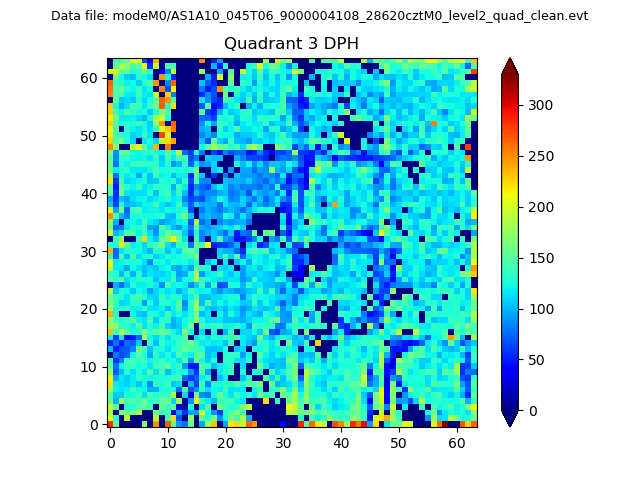 |
 |
Quadrant C |
| Plot type | Count rate plots | Images |
|---|---|---|
| Comparison with Poisson distribution Blue bars denote a histogram of data divided into 1 sec bins. Red curve is a Poisson curve with rate = median count rate of data. |
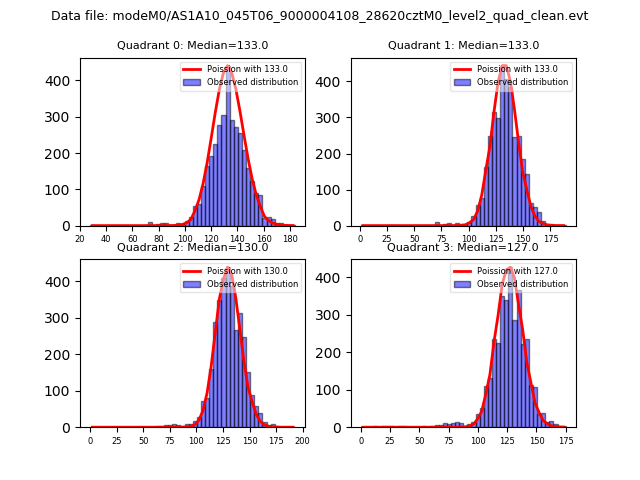 |
 |
| Quadrant-wise count rates Data is divided into 100 sec bins |
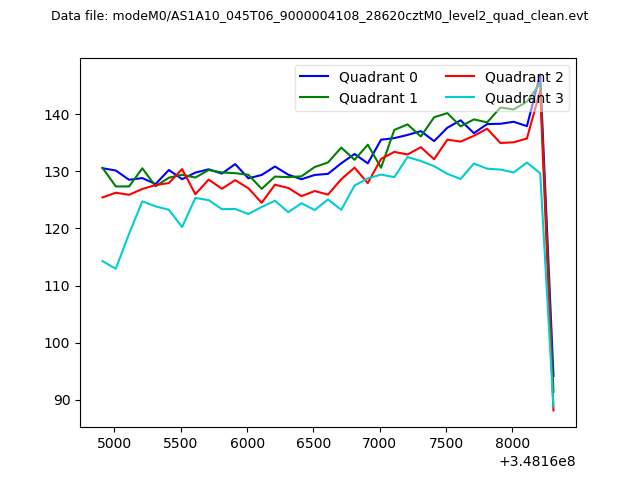 |
|
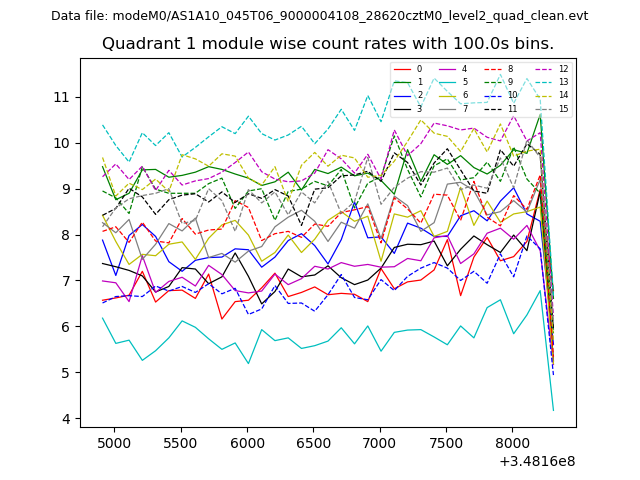
| Module-wise count rates for Quadrant A Data is divided into 100 sec bins |
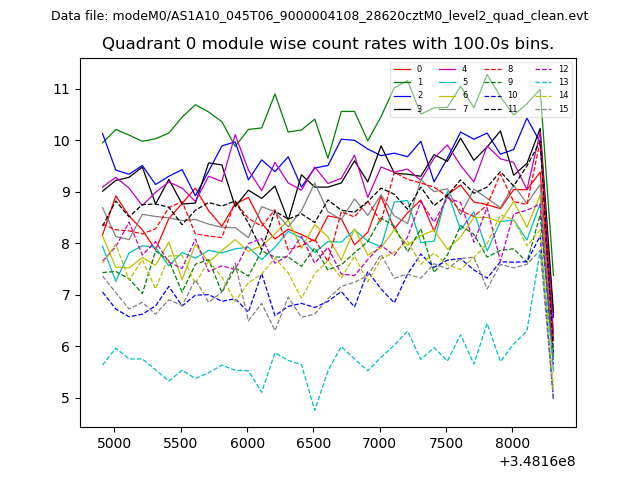 |
 |
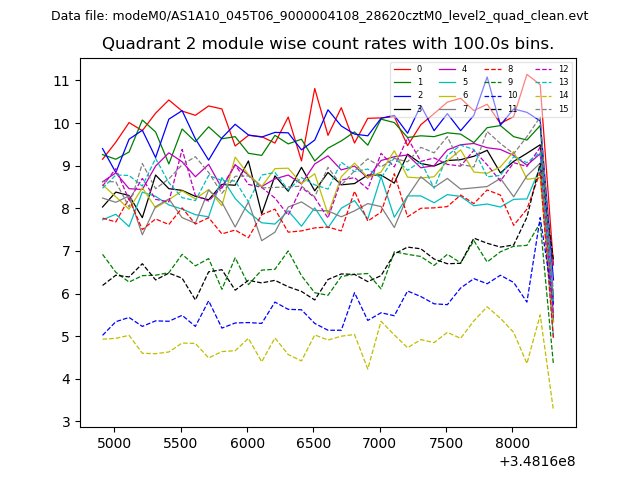
| Module-wise count rates for Quadrant B Data is divided into 100 sec bins |
 |
 |
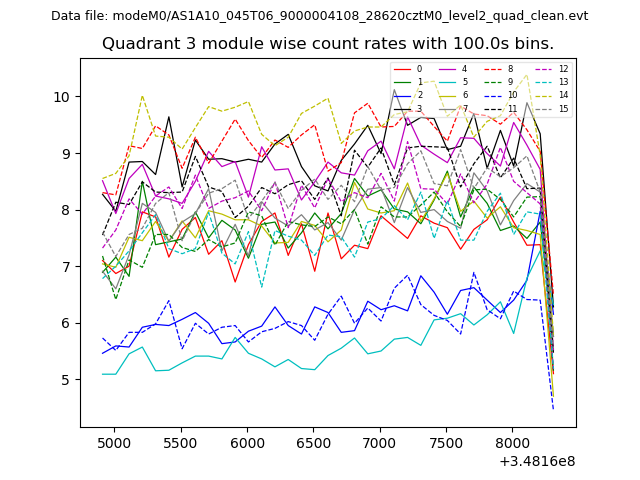
| Module-wise count rates for Quadrant C Data is divided into 100 sec bins |
 |
 |
| Module-wise count rates for Quadrant D Data is divided into 100 sec bins |
 |
 |
| Parameter | Plot |
|---|---|
| CZT HV Monitor | 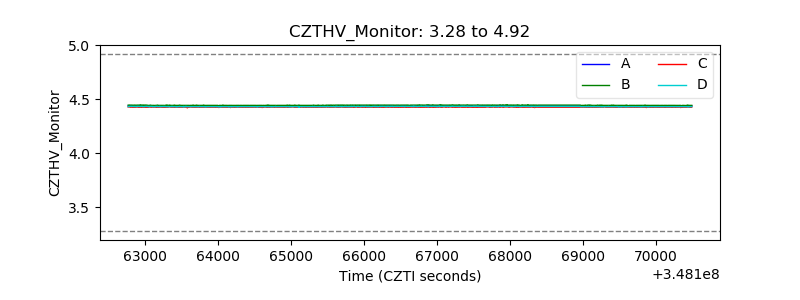 |
| D_VDD | 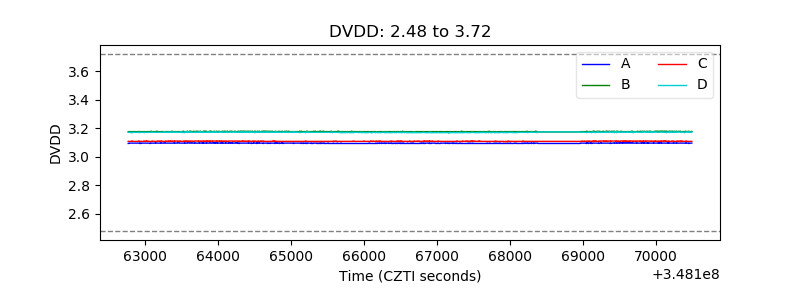 |
| Temperature 1 | 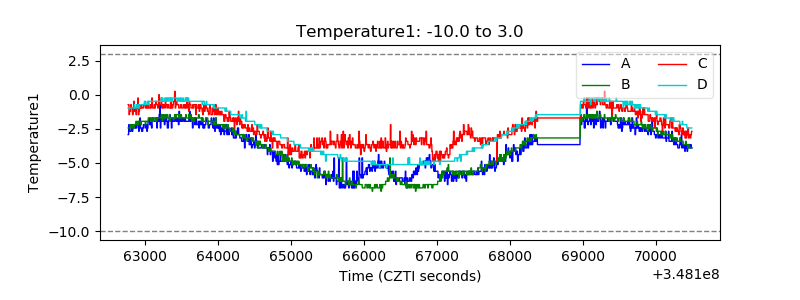 |
| Veto HV Monitor | 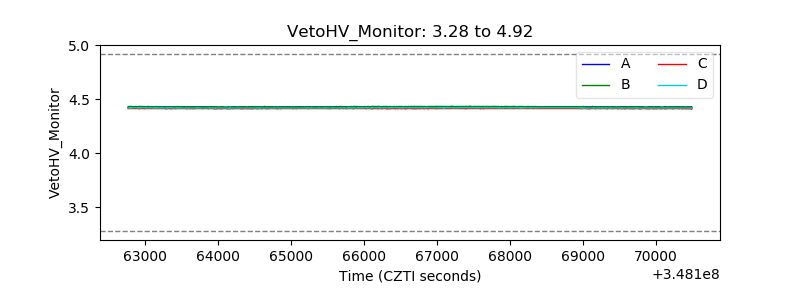 |
| Veto LLD | 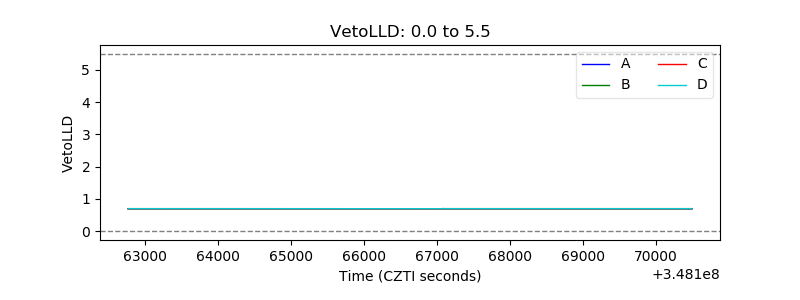 |
| Alpha Counter | 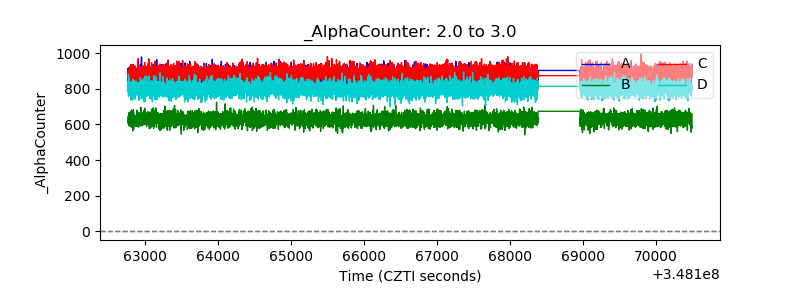 |
| _CPM_Rate | 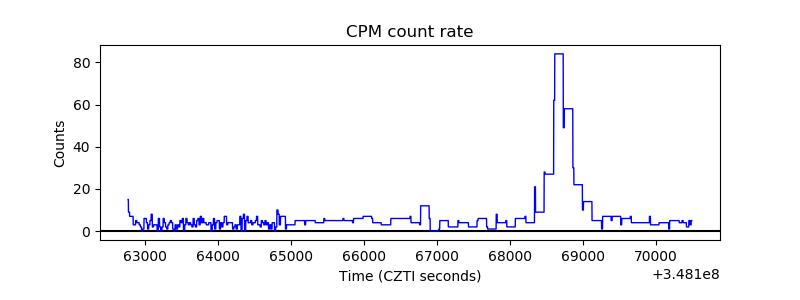 |
| CZT Counter |  |
| +2.5 Volts monitor |  |
| +5 Volts monitor |  |
| _ROLL_ROT | 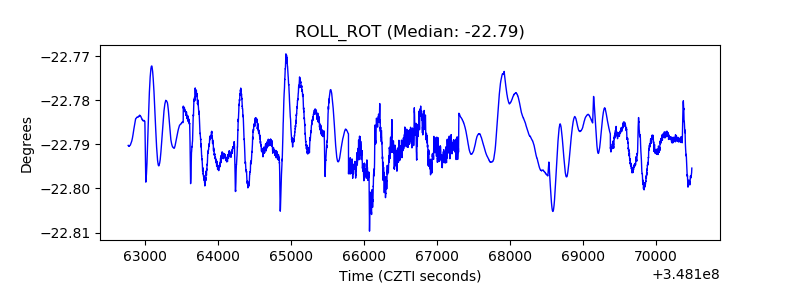 |
| _Roll_DEC | 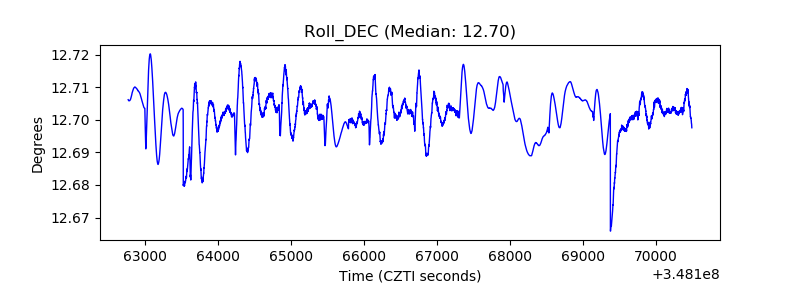 |
| _Roll_RA | 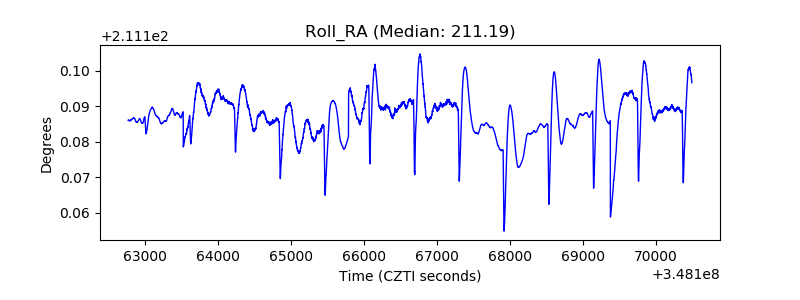 |
| Veto Counter | 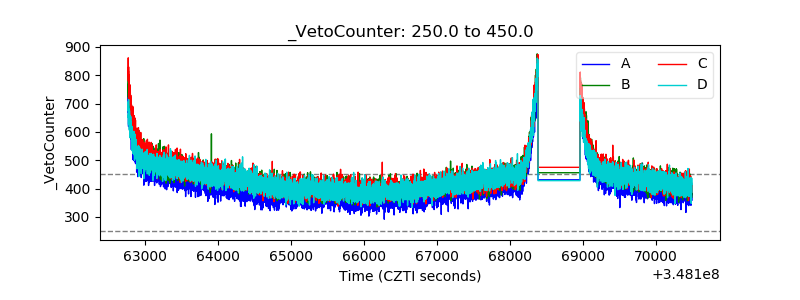 |