| Param | Original file | Final file |
|---|---|---|
| Filename | modeM0/AS1A10_045T06_9000004108_28626cztM0_level2.evt | modeM0/AS1A10_045T06_9000004108_28626cztM0_level2_quad_clean.evt |
| Size (bytes) | 1,876,302,720 | 303,782,400 |
| Size | 1.7 GB | 289.7 MB |
| Events in quadrant A | 11,497,033 | 1,915,435 |
| Events in quadrant B | 13,613,927 | 1,918,264 |
| Events in quadrant C | 11,715,596 | 1,885,743 |
| Events in quadrant D | 18,356,222 | 1,807,639 |
| Mode M9 | |||
|---|---|---|---|
| Quadrant | BADHDUFLAG | Total packets | Discarded packets |
| A | 0 | 33 | 0 |
| B | 0 | 33 | 0 |
| C | 0 | 33 | 0 |
| D | 0 | 33 | 0 |
| Mode M0 | |||
|---|---|---|---|
| Quadrant | BADHDUFLAG | Total packets | Discarded packets |
| A | 0 | 50352 | 5 |
| B | 0 | 56265 | 5 |
| C | 0 | 50583 | 5 |
| D | 0 | 71672 | 5 |
| Mode SS | |||
|---|---|---|---|
| Quadrant | BADHDUFLAG | Total packets | Discarded packets |
| A | 0 | 492 | 0 |
| B | 0 | 492 | 0 |
| C | 0 | 492 | 0 |
| D | 0 | 492 | 0 |
| Quadrant | Total seconds | Saturated seconds | Saturation percentage |
|---|---|---|---|
| A | 24342 | 191 | 0.784652% |
| B | 24342 | 652 | 2.678498% |
| C | 24343 | 443 | 1.819825% |
| D | 24343 | 1308 | 5.373208% |
Noise dominated data is calculated using 1-second bins in cleaned event files. If a bin has >2000 counts, and if more than 50% of those come from <1% of pixels, then it is considered to be noise-dominated and hence unusable.
| Quadrant | # 1 sec bins | Bins with >0 counts | Bins with >2000 counts | High rate bins dominated by noise | Noise dominated (total time) | Noise dominated (detector-on time) | Marked lightcurve |
|---|---|---|---|---|---|---|---|
| A | 27452 | 24344 | 27 | 27 | 0.10% | 0.11% | 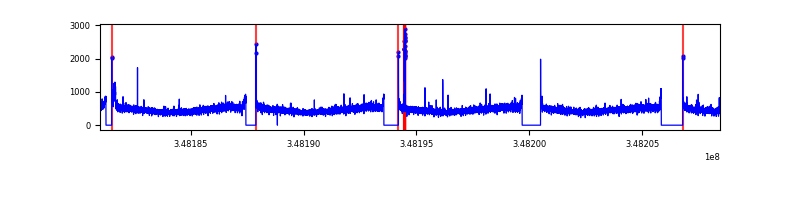 |
| B | 27452 | 24341 | 414 | 414 | 1.51% | 1.70% | 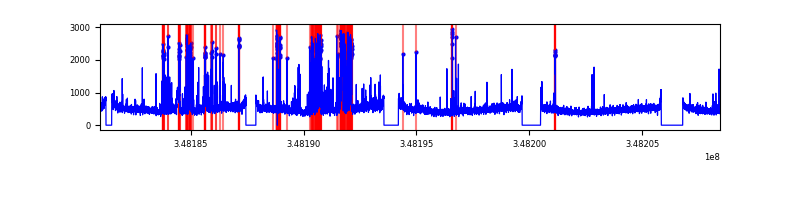 |
| C | 27453 | 24343 | 0 | 0 | 0.00% | 0.00% | 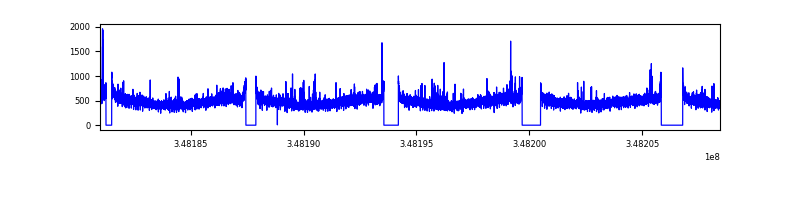 |
| D | 27453 | 24345 | 1052 | 1052 | 3.83% | 4.32% |  |
Top three noisy pixels from each quadrant. If the there are fewer than three noisy pixels in the level2.evt file, extra rows are filled as -1
| Pixel properties | Quadrant properties | ||||||
|---|---|---|---|---|---|---|---|
| Quadrant | DetID | PixID | Counts | Sigma | Mean | Median | Sigma |
| A | 15 | 174 | 112483 | 186.25 | 2933 | 2868 | 588.5 |
| A | 13 | 254 | 42859 | 67.95 | 2933 | 2868 | 588.5 |
| A | 15 | 47 | 38464 | 60.48 | 2933 | 2868 | 588.5 |
| B | 10 | 245 | 1895823 | 3463.7 | 2889 | 2816 | 546.5 |
| B | 14 | 207 | 166136 | 298.83 | 2889 | 2816 | 546.5 |
| B | 12 | 111 | 70067 | 123.05 | 2889 | 2816 | 546.5 |
| C | 14 | 238 | 503173 | 759.26 | 2819 | 2836 | 659.0 |
| C | 7 | 247 | 138983 | 206.6 | 2819 | 2836 | 659.0 |
| C | 14 | 254 | 82728 | 121.24 | 2819 | 2836 | 659.0 |
| D | 1 | 52 | 5076158 | 7621.85 | 2800 | 2728 | 665.6 |
| D | 8 | 195 | 1956459 | 2935.1 | 2800 | 2728 | 665.6 |
| D | 2 | 250 | 545801 | 815.86 | 2800 | 2728 | 665.6 |
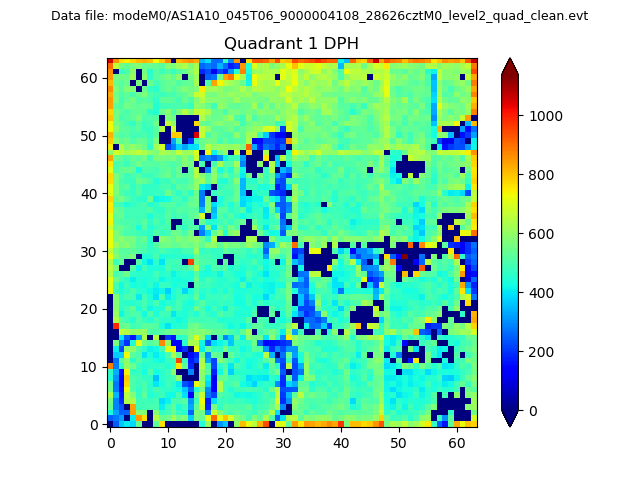
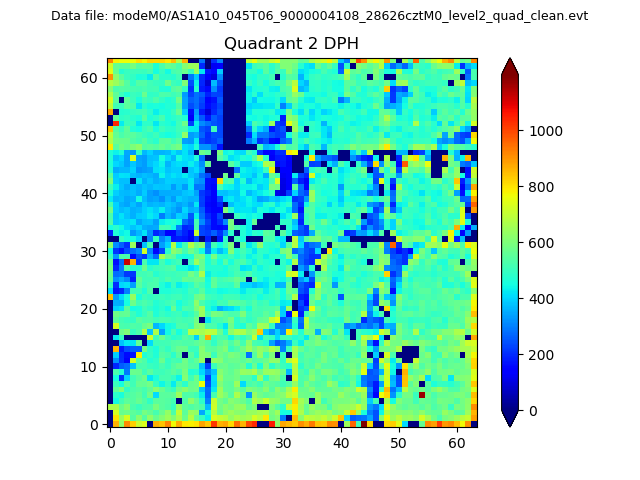
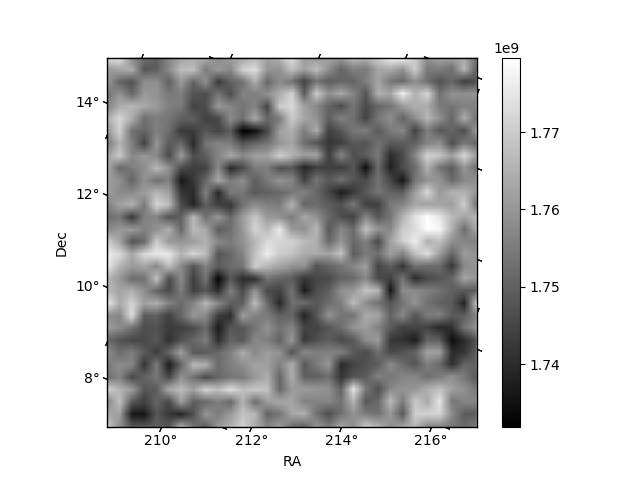
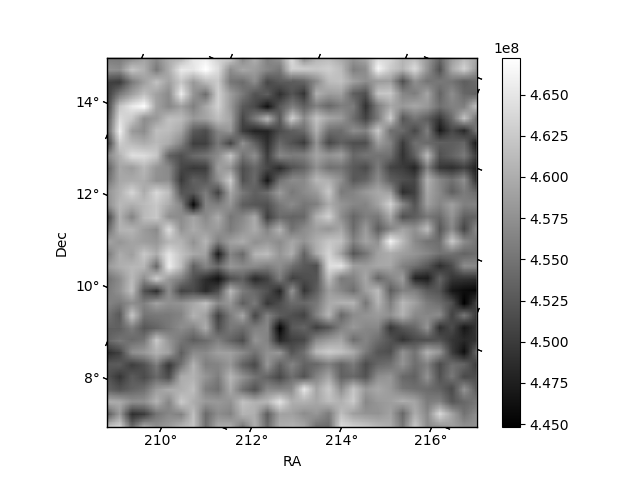
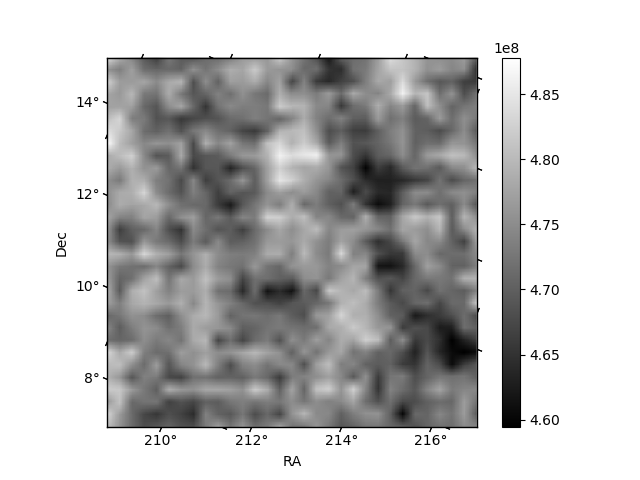
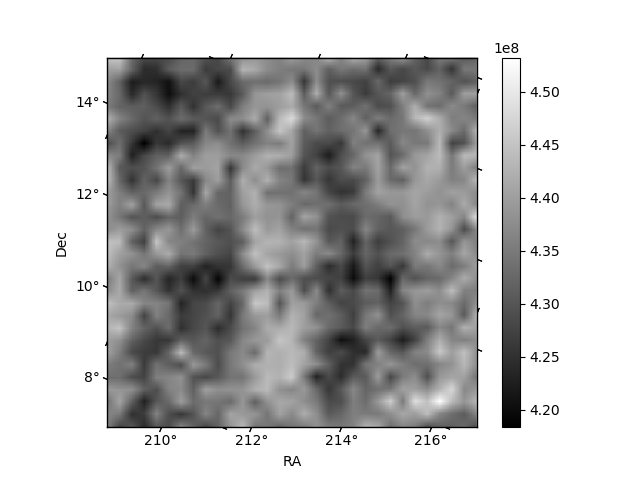
Histogram calculated using DETX and DETY for each event in the final _common_clean file
| Quadrant A | 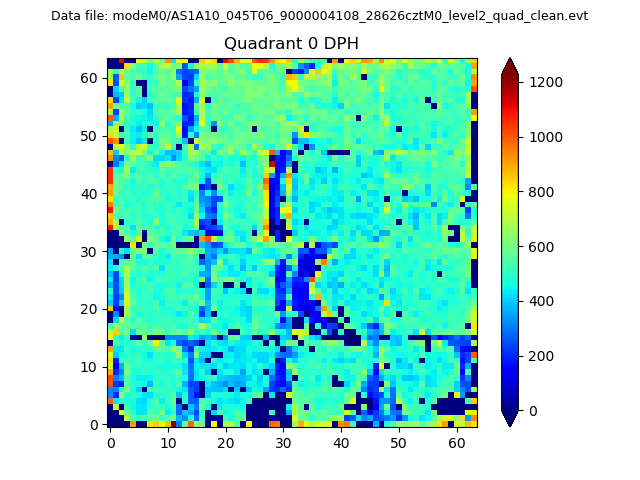 |
 |
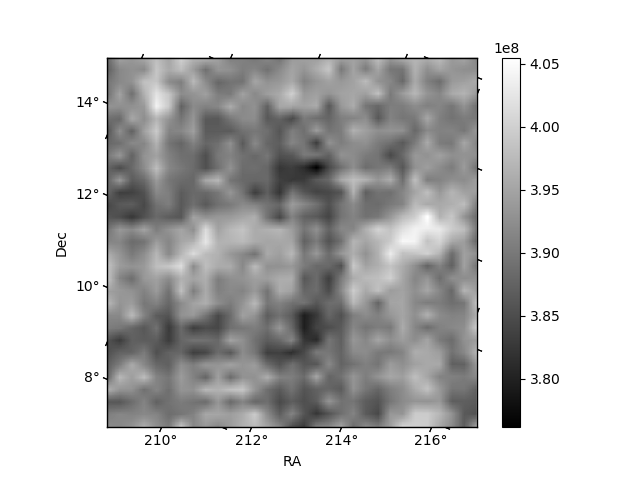
Quadrant B |
|---|---|---|---|
| Quadrant D | 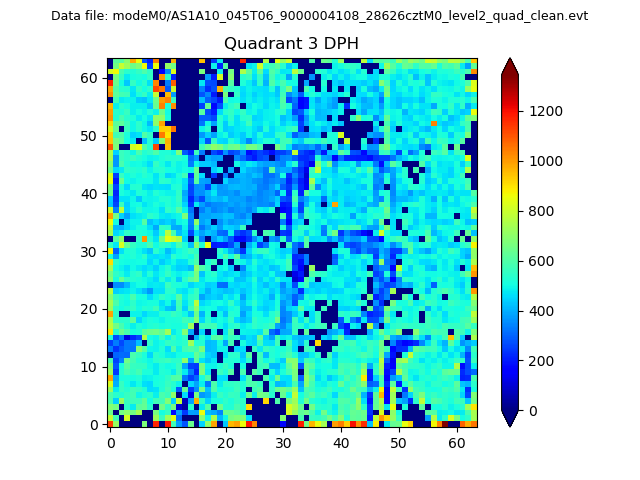 |
 |
Quadrant C |
| Plot type | Count rate plots | Images |
|---|---|---|
| Comparison with Poisson distribution Blue bars denote a histogram of data divided into 1 sec bins. Red curve is a Poisson curve with rate = median count rate of data. |
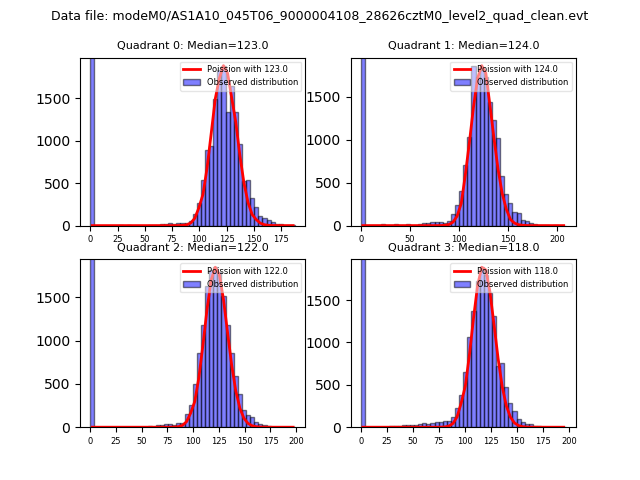 |
 |
| Quadrant-wise count rates Data is divided into 100 sec bins |
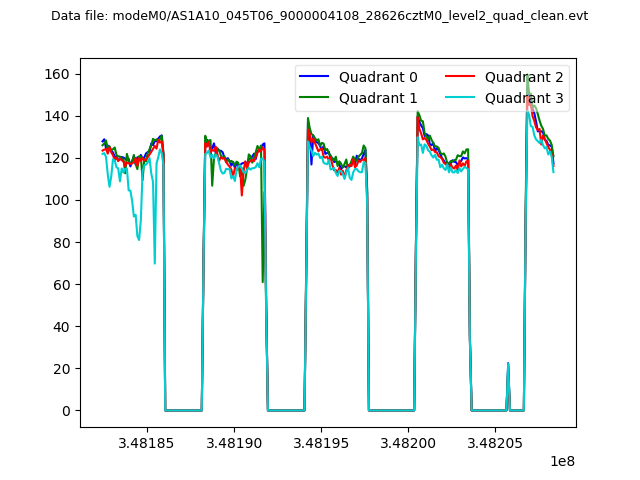 |
|
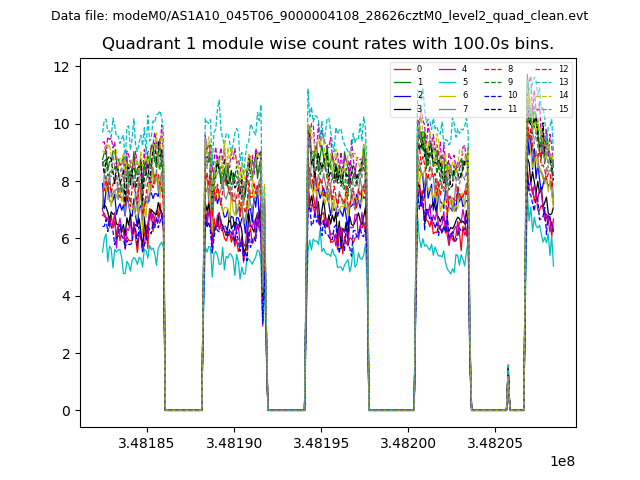
| Module-wise count rates for Quadrant A Data is divided into 100 sec bins |
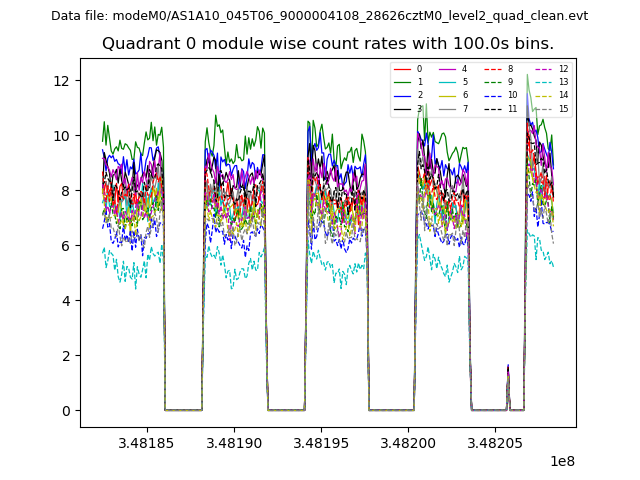 |
 |
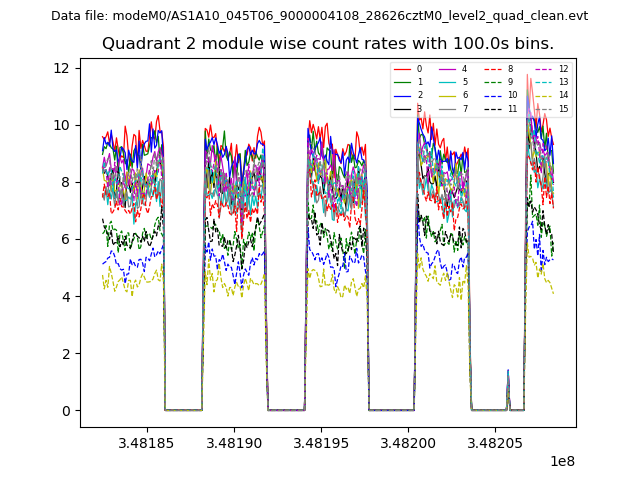
| Module-wise count rates for Quadrant B Data is divided into 100 sec bins |
 |
 |
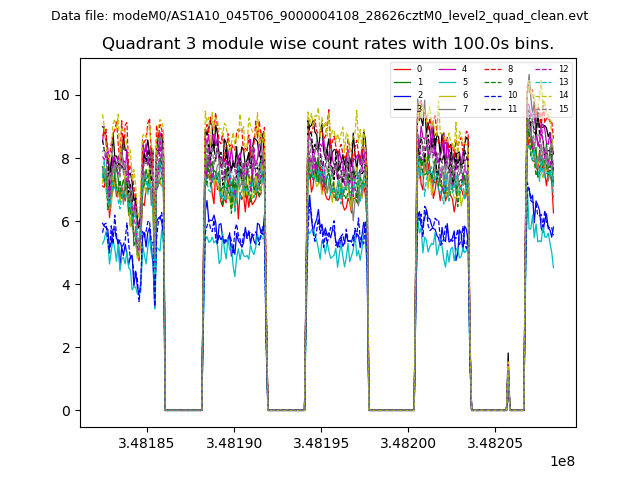
| Module-wise count rates for Quadrant C Data is divided into 100 sec bins |
 |
 |
| Module-wise count rates for Quadrant D Data is divided into 100 sec bins |
 |
 |
| Parameter | Plot |
|---|---|
| CZT HV Monitor | 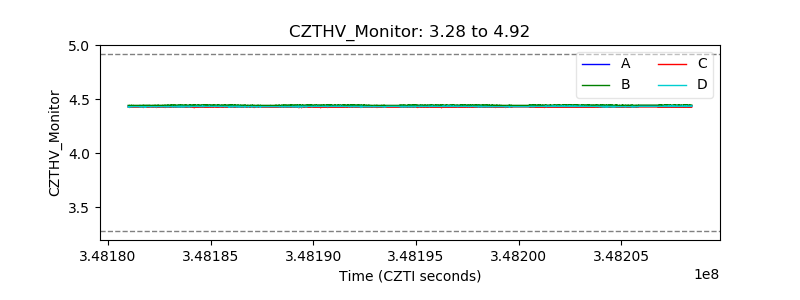 |
| D_VDD | 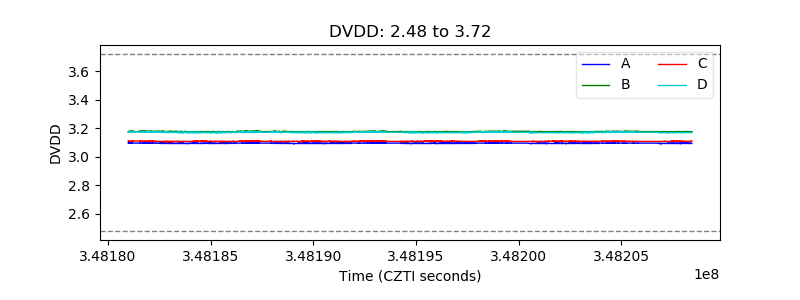 |
| Temperature 1 | 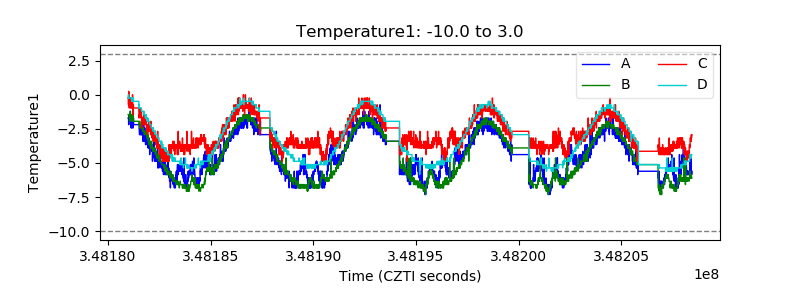 |
| Veto HV Monitor | 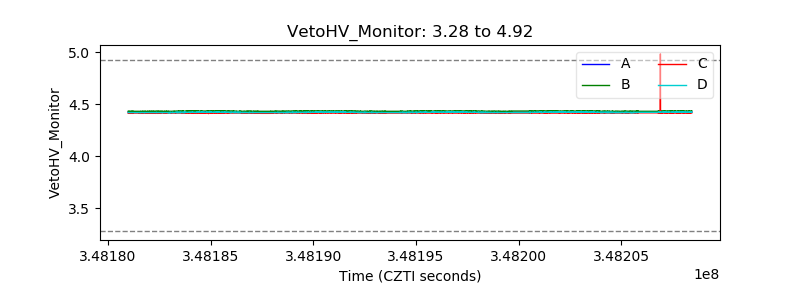 |
| Veto LLD | 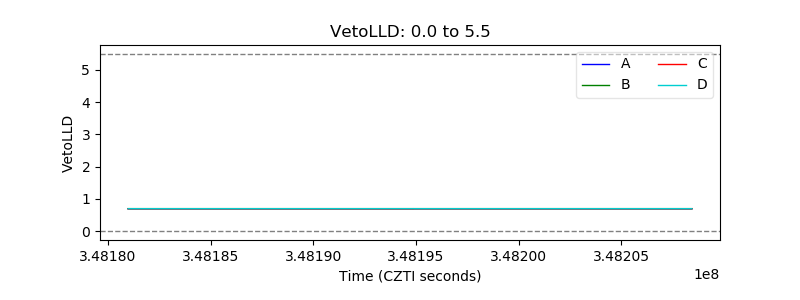 |
| Alpha Counter | 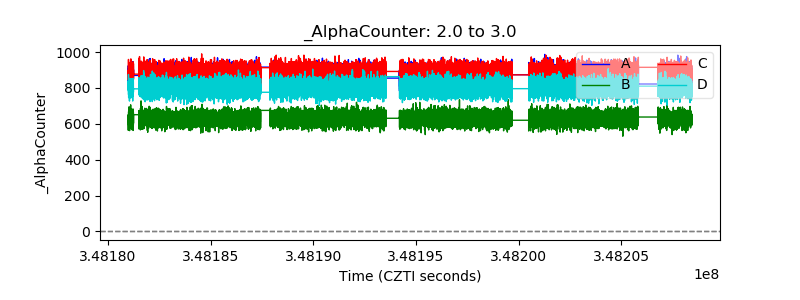 |
| _CPM_Rate | 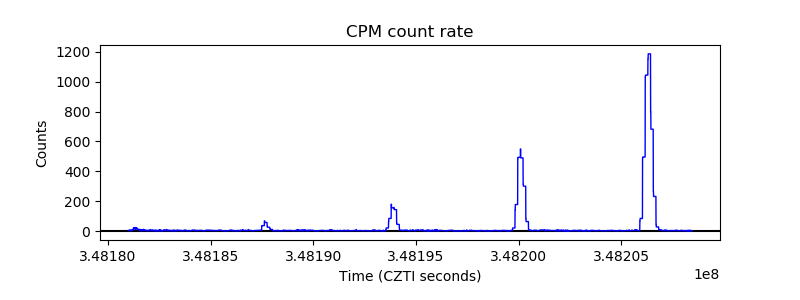 |
| CZT Counter | 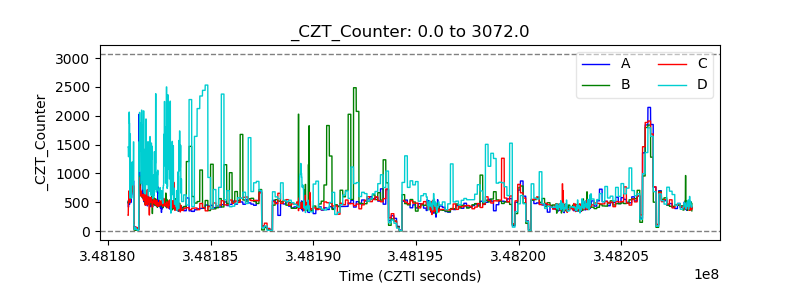 |
| +2.5 Volts monitor |  |
| +5 Volts monitor |  |
| _ROLL_ROT | 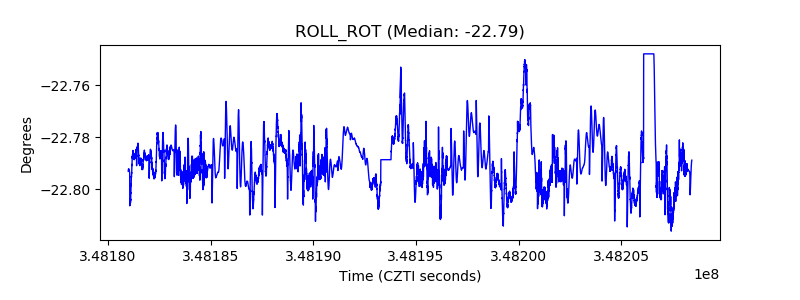 |
| _Roll_DEC | 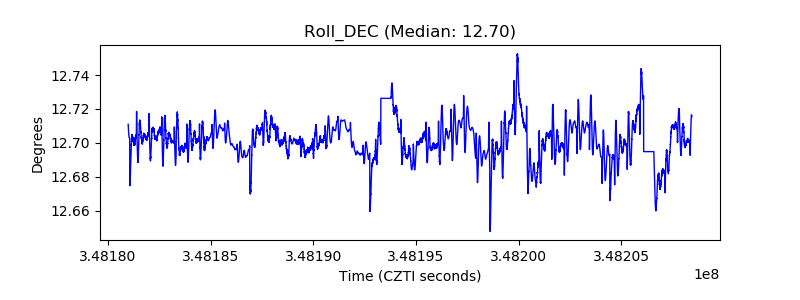 |
| _Roll_RA | 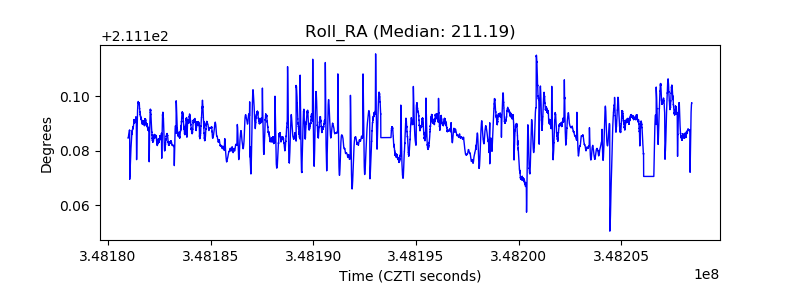 |
| Veto Counter | 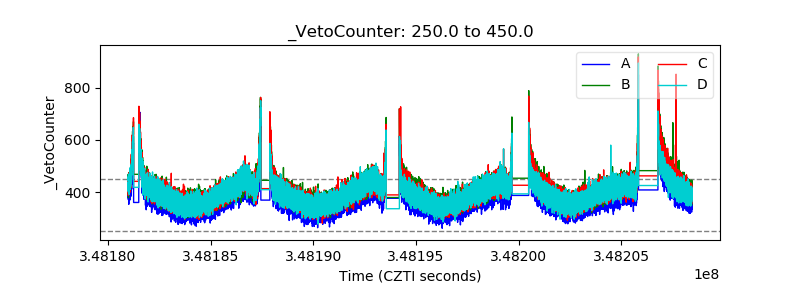 |