| Param | Original file | Final file |
|---|---|---|
| Filename | modeM0/AS1A10_045T06_9000004108_28629cztM0_level2.evt | modeM0/AS1A10_045T06_9000004108_28629cztM0_level2_quad_clean.evt |
| Size (bytes) | 506,350,080 | 94,305,600 |
| Size | 482.9 MB | 89.9 MB |
| Events in quadrant A | 3,190,000 | 614,184 |
| Events in quadrant B | 4,241,877 | 619,413 |
| Events in quadrant C | 3,258,015 | 602,846 |
| Events in quadrant D | 4,216,604 | 578,709 |
| Mode M9 | |||
|---|---|---|---|
| Quadrant | BADHDUFLAG | Total packets | Discarded packets |
| A | 0 | 12 | 0 |
| B | 0 | 12 | 0 |
| C | 0 | 12 | 0 |
| D | 0 | 12 | 0 |
| Mode M0 | |||
|---|---|---|---|
| Quadrant | BADHDUFLAG | Total packets | Discarded packets |
| A | 0 | 13167 | 1 |
| B | 0 | 16725 | 1 |
| C | 0 | 13376 | 1 |
| D | 0 | 16615 | 1 |
| Mode SS | |||
|---|---|---|---|
| Quadrant | BADHDUFLAG | Total packets | Discarded packets |
| A | 0 | 128 | 0 |
| B | 0 | 128 | 0 |
| C | 0 | 128 | 0 |
| D | 0 | 128 | 0 |
| Quadrant | Total seconds | Saturated seconds | Saturation percentage |
|---|---|---|---|
| A | 6315 | 60 | 0.950119% |
| B | 6316 | 242 | 3.831539% |
| C | 6316 | 118 | 1.868271% |
| D | 6316 | 197 | 3.119063% |
Noise dominated data is calculated using 1-second bins in cleaned event files. If a bin has >2000 counts, and if more than 50% of those come from <1% of pixels, then it is considered to be noise-dominated and hence unusable.
| Quadrant | # 1 sec bins | Bins with >0 counts | Bins with >2000 counts | High rate bins dominated by noise | Noise dominated (total time) | Noise dominated (detector-on time) | Marked lightcurve |
|---|---|---|---|---|---|---|---|
| A | 7474 | 6314 | 0 | 0 | 0.00% | 0.00% |  |
| B | 7475 | 6315 | 90 | 90 | 1.20% | 1.43% |  |
| C | 7475 | 6316 | 0 | 0 | 0.00% | 0.00% | 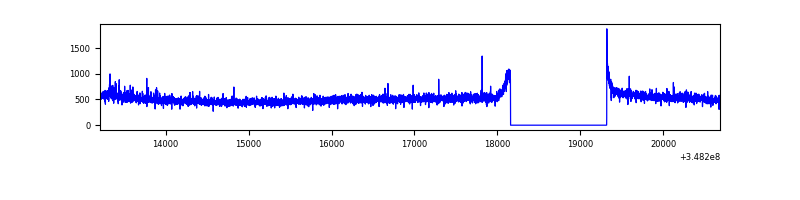 |
| D | 7475 | 6315 | 132 | 132 | 1.77% | 2.09% |  |
Top three noisy pixels from each quadrant. If the there are fewer than three noisy pixels in the level2.evt file, extra rows are filled as -1
| Pixel properties | Quadrant properties | ||||||
|---|---|---|---|---|---|---|---|
| Quadrant | DetID | PixID | Counts | Sigma | Mean | Median | Sigma |
| A | 12 | 16 | 12414 | 70.86 | 820 | 804 | 163.8 |
| A | 13 | 254 | 11909 | 67.78 | 820 | 804 | 163.8 |
| A | 3 | 137 | 7635 | 41.69 | 820 | 804 | 163.8 |
| B | 10 | 245 | 1088700 | 7088.64 | 800 | 780 | 153.5 |
| B | 12 | 111 | 17929 | 111.74 | 800 | 780 | 153.5 |
| B | 11 | 111 | 16507 | 102.47 | 800 | 780 | 153.5 |
| C | 14 | 238 | 139301 | 757.7 | 787 | 794 | 182.8 |
| C | 14 | 254 | 19175 | 100.55 | 787 | 794 | 182.8 |
| C | 7 | 247 | 17397 | 90.83 | 787 | 794 | 182.8 |
| D | 1 | 52 | 1019361 | 5460.55 | 788 | 770 | 186.5 |
| D | 8 | 195 | 154215 | 822.6 | 788 | 770 | 186.5 |
| D | 2 | 250 | 25470 | 132.41 | 788 | 770 | 186.5 |
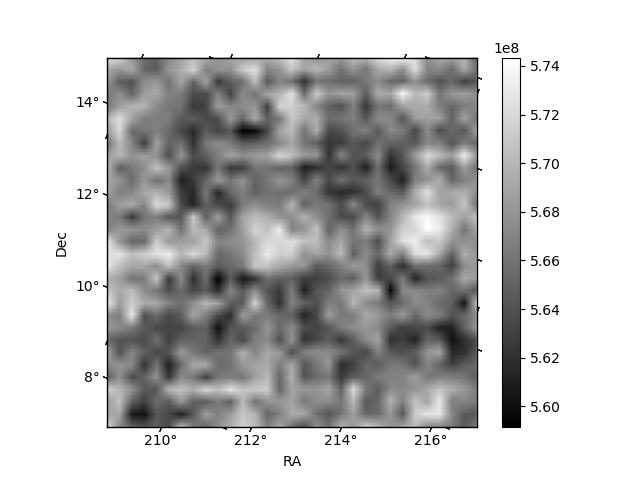
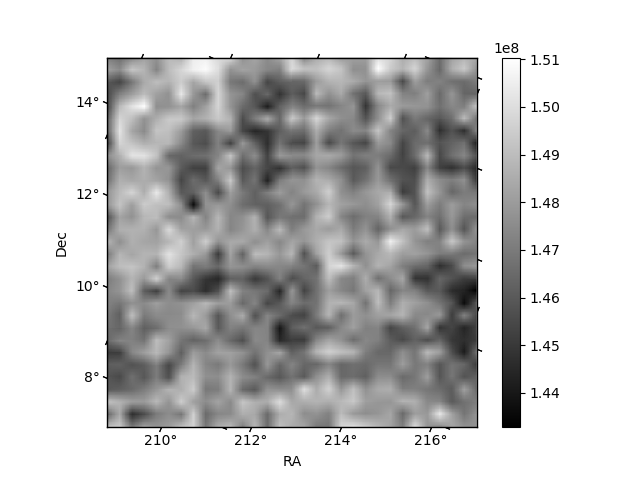
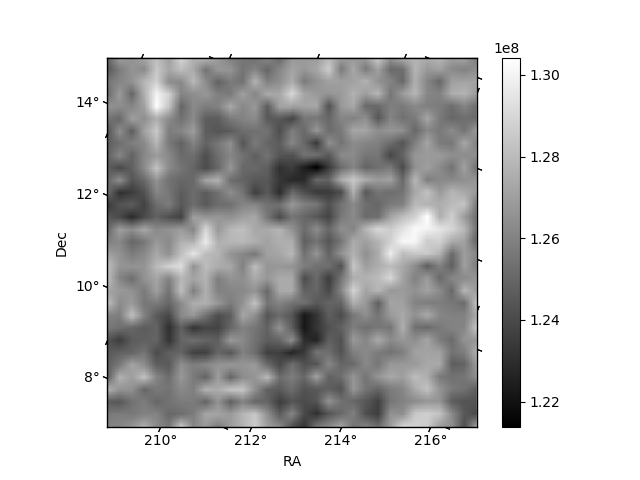
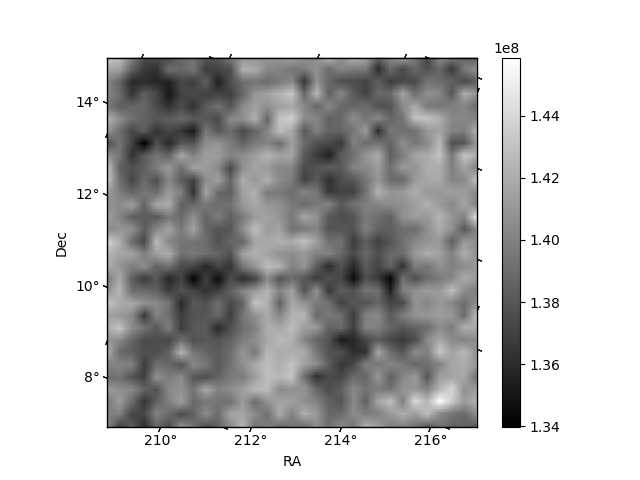
Histogram calculated using DETX and DETY for each event in the final _common_clean file
| Quadrant A | 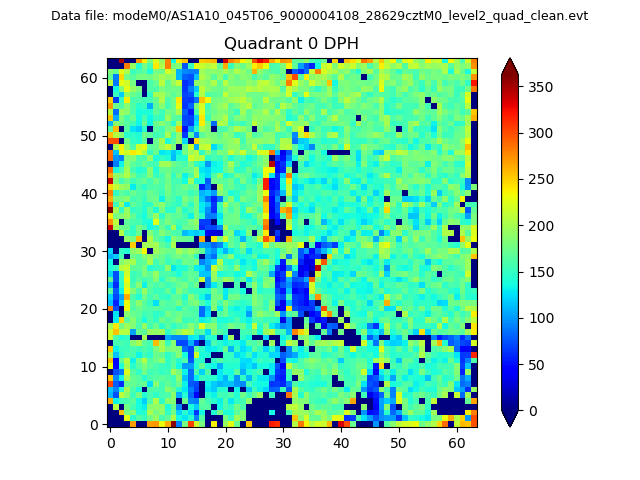 |
 |
Quadrant B |
|---|---|---|---|
| Quadrant D | 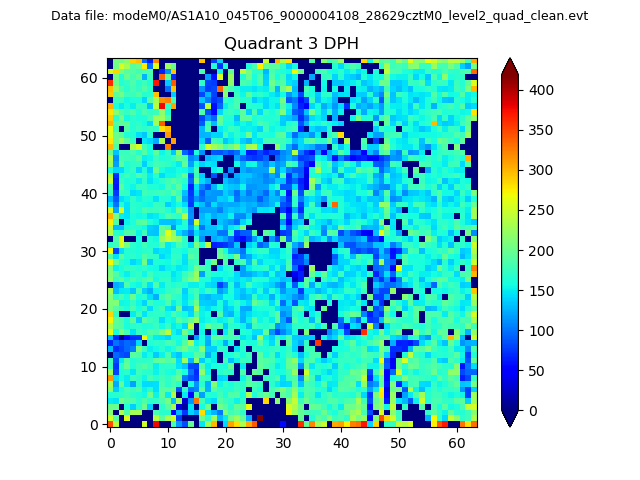 |
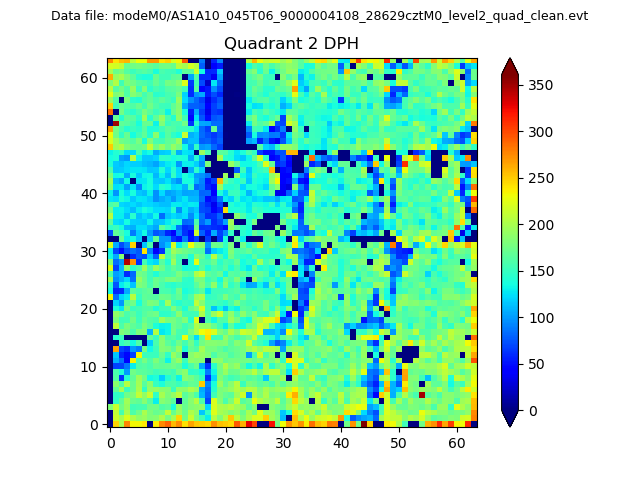 |
Quadrant C |
| Plot type | Count rate plots | Images |
|---|---|---|
| Comparison with Poisson distribution Blue bars denote a histogram of data divided into 1 sec bins. Red curve is a Poisson curve with rate = median count rate of data. |
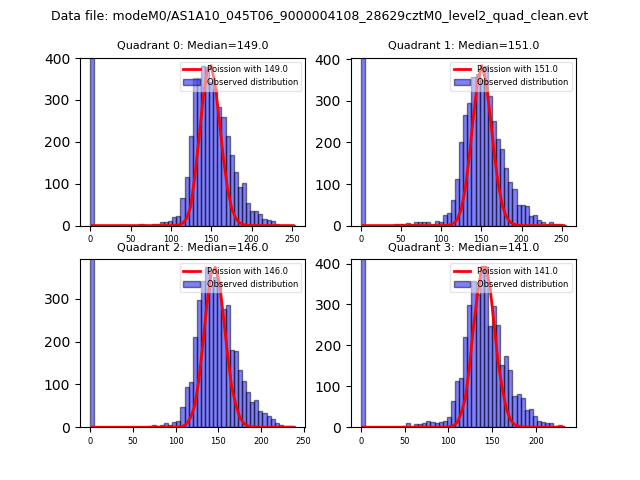 |
 |
| Quadrant-wise count rates Data is divided into 100 sec bins |
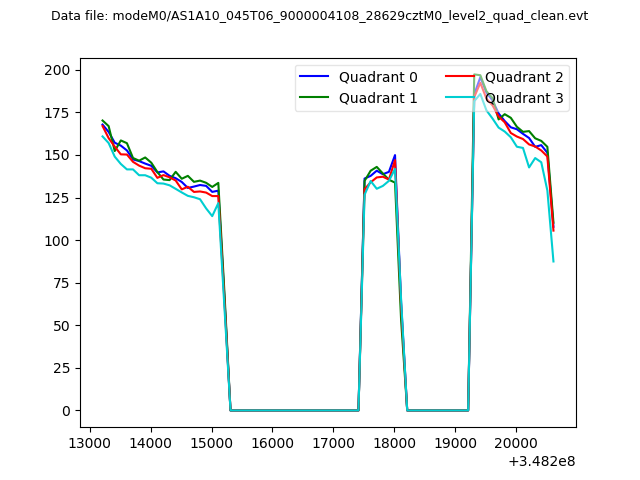 |
|
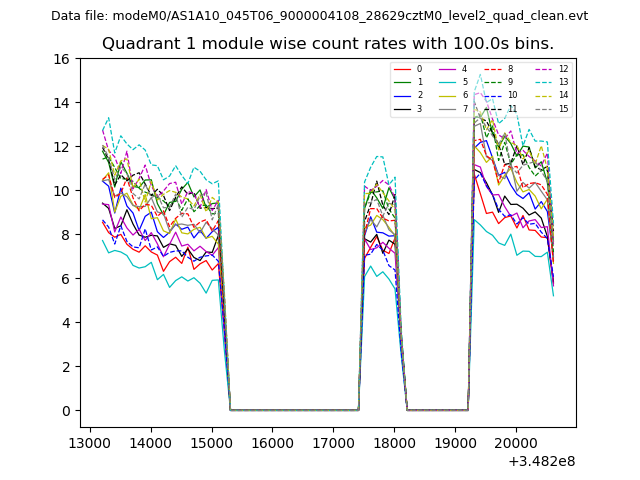
| Module-wise count rates for Quadrant A Data is divided into 100 sec bins |
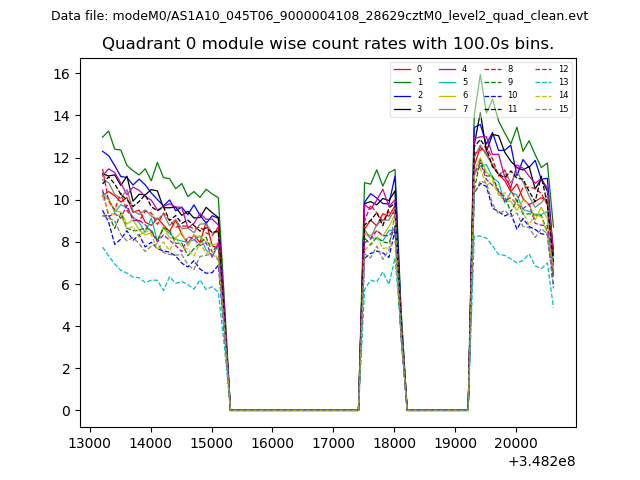 |
 |
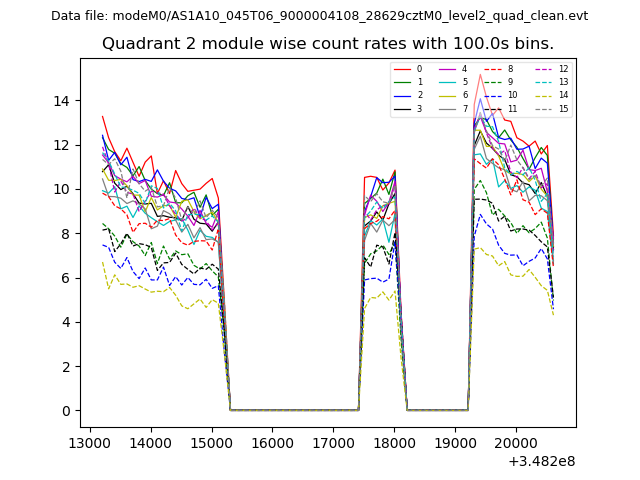
| Module-wise count rates for Quadrant B Data is divided into 100 sec bins |
 |
 |
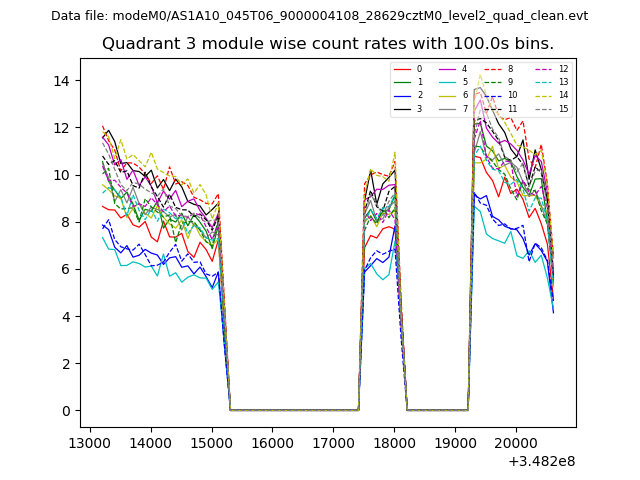
| Module-wise count rates for Quadrant C Data is divided into 100 sec bins |
 |
 |
| Module-wise count rates for Quadrant D Data is divided into 100 sec bins |
 |
 |
| Parameter | Plot |
|---|---|
| CZT HV Monitor |  |
| D_VDD | 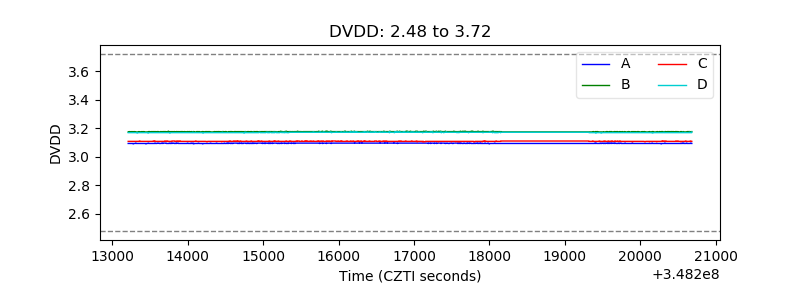 |
| Temperature 1 | 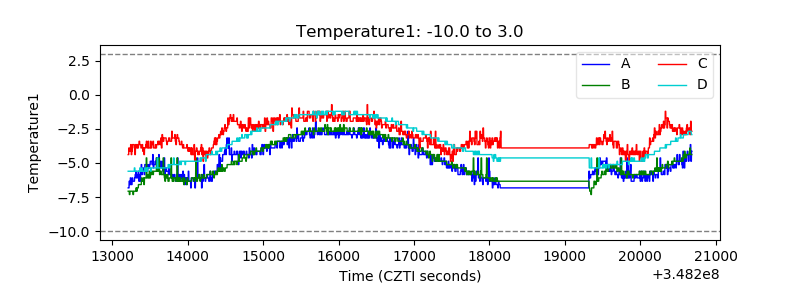 |
| Veto HV Monitor | 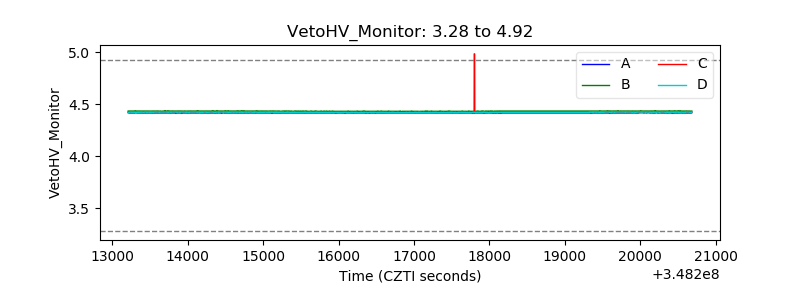 |
| Veto LLD |  |
| Alpha Counter | 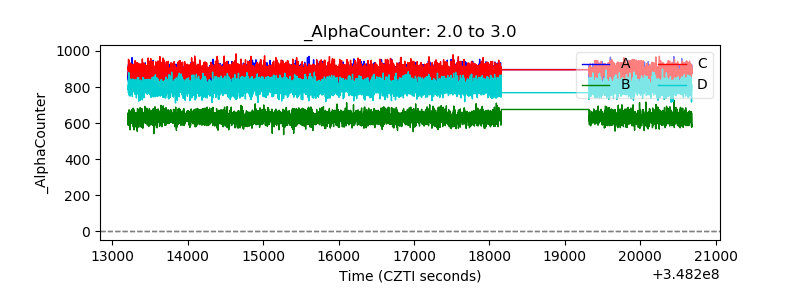 |
| _CPM_Rate | 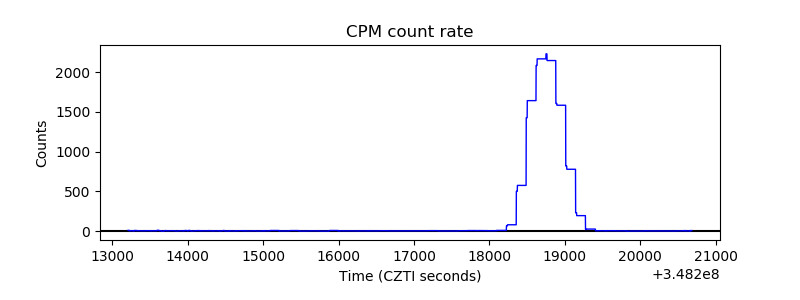 |
| CZT Counter | 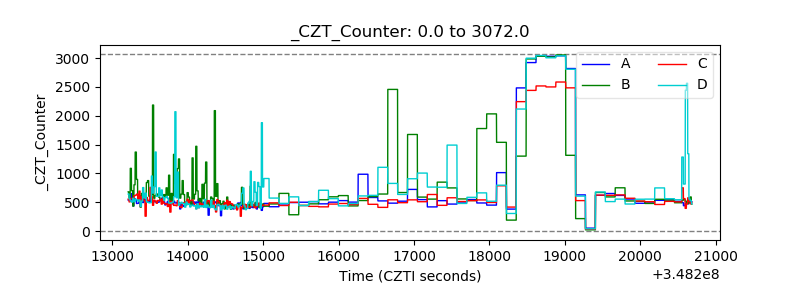 |
| +2.5 Volts monitor |  |
| +5 Volts monitor |  |
| _ROLL_ROT | 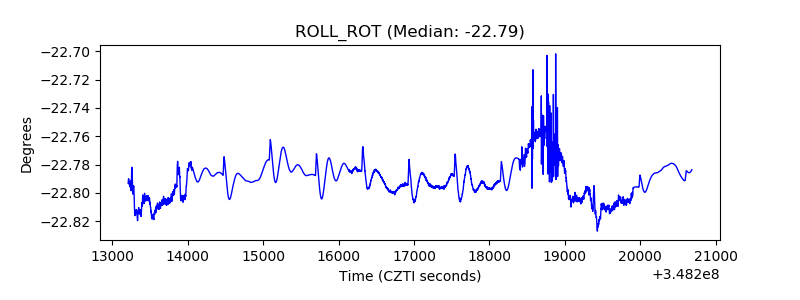 |
| _Roll_DEC | 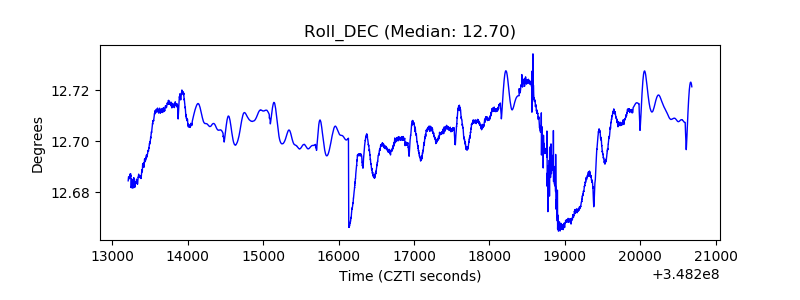 |
| _Roll_RA | 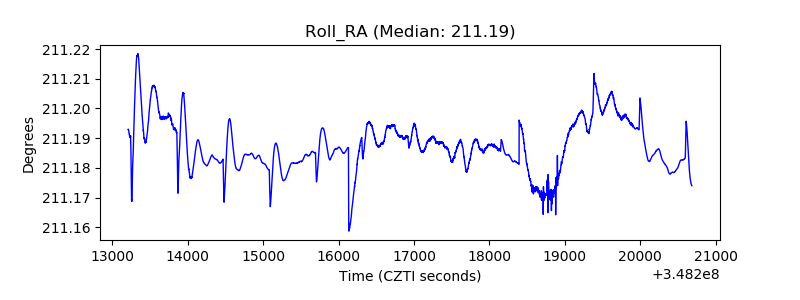 |
| Veto Counter | 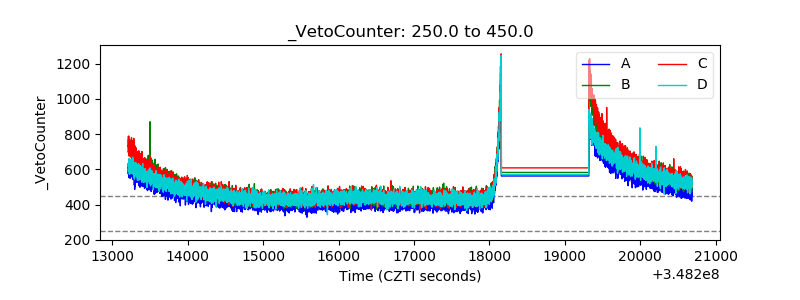 |