| Param | Original file | Final file |
|---|---|---|
| Filename | modeM0/AS1A10_045T06_9000004108_28630cztM0_level2.evt | modeM0/AS1A10_045T06_9000004108_28630cztM0_level2_quad_clean.evt |
| Size (bytes) | 525,732,480 | 99,472,320 |
| Size | 501.4 MB | 94.9 MB |
| Events in quadrant A | 3,366,617 | 663,265 |
| Events in quadrant B | 4,003,540 | 627,397 |
| Events in quadrant C | 3,417,017 | 655,272 |
| Events in quadrant D | 4,707,156 | 626,548 |
| Mode M9 | |||
|---|---|---|---|
| Quadrant | BADHDUFLAG | Total packets | Discarded packets |
| A | 0 | 12 | 0 |
| B | 0 | 12 | 0 |
| C | 0 | 12 | 0 |
| D | 0 | 12 | 0 |
| Mode M0 | |||
|---|---|---|---|
| Quadrant | BADHDUFLAG | Total packets | Discarded packets |
| A | 0 | 13568 | 2 |
| B | 0 | 15551 | 2 |
| C | 0 | 13766 | 2 |
| D | 0 | 18128 | 2 |
| Mode SS | |||
|---|---|---|---|
| Quadrant | BADHDUFLAG | Total packets | Discarded packets |
| A | 0 | 130 | 0 |
| B | 0 | 130 | 0 |
| C | 0 | 130 | 0 |
| D | 0 | 130 | 0 |
| Quadrant | Total seconds | Saturated seconds | Saturation percentage |
|---|---|---|---|
| A | 6295 | 83 | 1.318507% |
| B | 6295 | 390 | 6.195393% |
| C | 6295 | 125 | 1.985703% |
| D | 6296 | 304 | 4.828463% |
Noise dominated data is calculated using 1-second bins in cleaned event files. If a bin has >2000 counts, and if more than 50% of those come from <1% of pixels, then it is considered to be noise-dominated and hence unusable.
| Quadrant | # 1 sec bins | Bins with >0 counts | Bins with >2000 counts | High rate bins dominated by noise | Noise dominated (total time) | Noise dominated (detector-on time) | Marked lightcurve |
|---|---|---|---|---|---|---|---|
| A | 7515 | 6294 | 0 | 0 | 0.00% | 0.00% |  |
| B | 7516 | 6295 | 264 | 264 | 3.51% | 4.19% |  |
| C | 7516 | 6295 | 0 | 0 | 0.00% | 0.00% |  |
| D | 7517 | 6296 | 247 | 247 | 3.29% | 3.92% |  |
Top three noisy pixels from each quadrant. If the there are fewer than three noisy pixels in the level2.evt file, extra rows are filled as -1
| Pixel properties | Quadrant properties | ||||||
|---|---|---|---|---|---|---|---|
| Quadrant | DetID | PixID | Counts | Sigma | Mean | Median | Sigma |
| A | 12 | 96 | 17418 | 96.42 | 865 | 849 | 171.8 |
| A | 13 | 254 | 11276 | 60.68 | 865 | 849 | 171.8 |
| A | 15 | 47 | 8151 | 42.49 | 865 | 849 | 171.8 |
| B | 10 | 245 | 799039 | 5225.29 | 813 | 793 | 152.8 |
| B | 12 | 111 | 18213 | 114.03 | 813 | 793 | 152.8 |
| B | 11 | 111 | 16684 | 104.02 | 813 | 793 | 152.8 |
| C | 14 | 238 | 142371 | 732.17 | 834 | 841 | 193.3 |
| C | 14 | 254 | 12075 | 58.11 | 834 | 841 | 193.3 |
| C | 7 | 247 | 11104 | 53.09 | 834 | 841 | 193.3 |
| D | 1 | 52 | 1151376 | 5844.66 | 833 | 814 | 196.9 |
| D | 8 | 195 | 273454 | 1384.96 | 833 | 814 | 196.9 |
| D | 2 | 250 | 72483 | 364.07 | 833 | 814 | 196.9 |
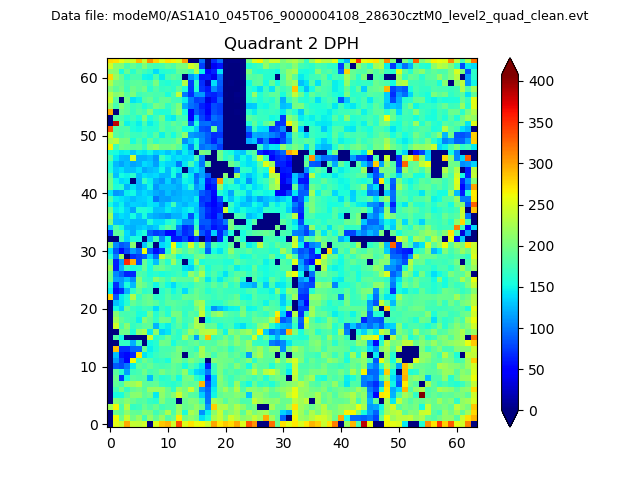
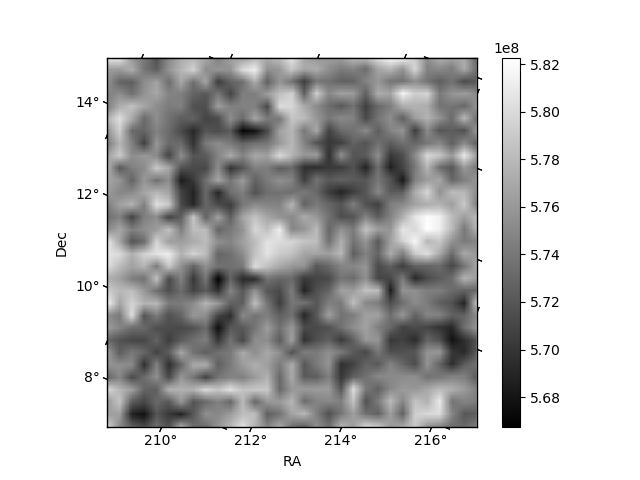
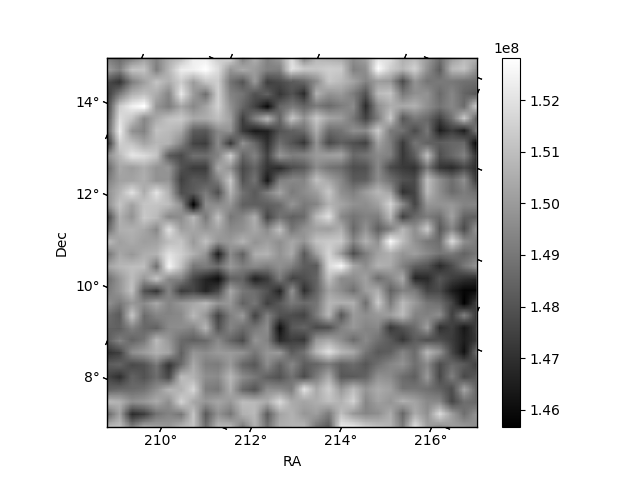
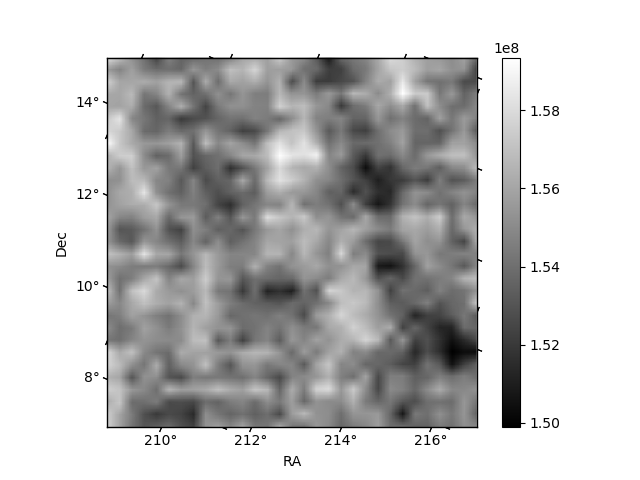
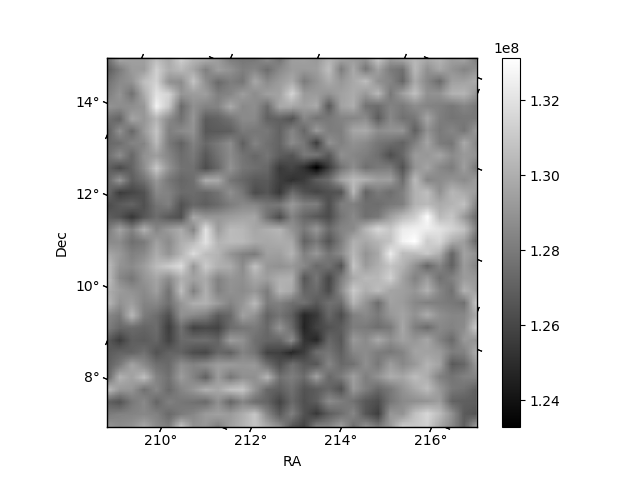
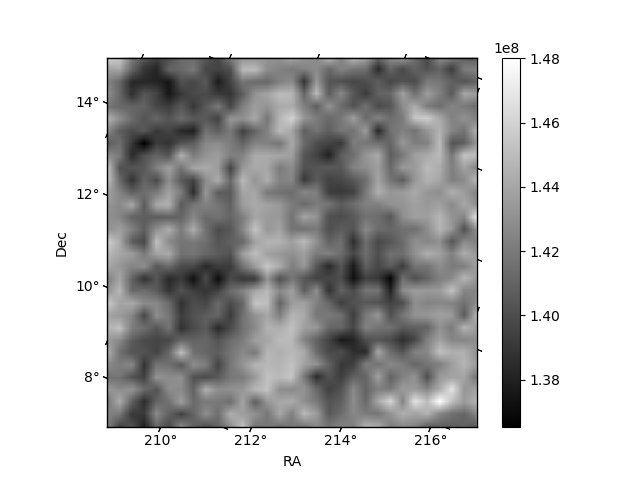
Histogram calculated using DETX and DETY for each event in the final _common_clean file
| Quadrant A | 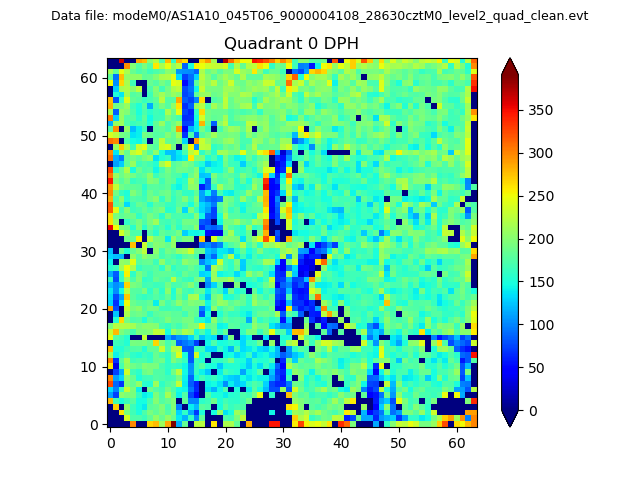 |
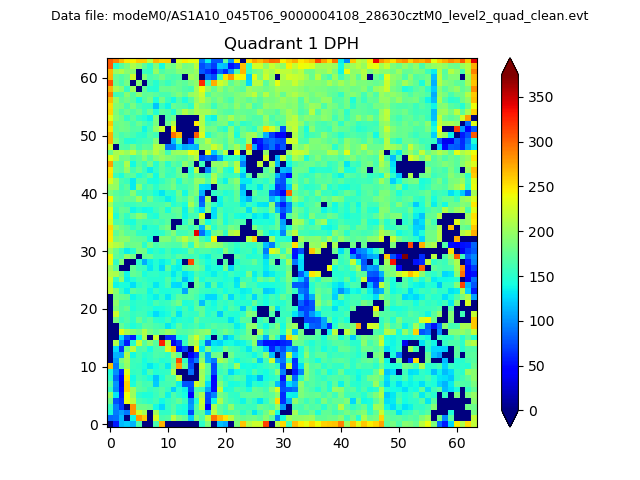 |
Quadrant B |
|---|---|---|---|
| Quadrant D | 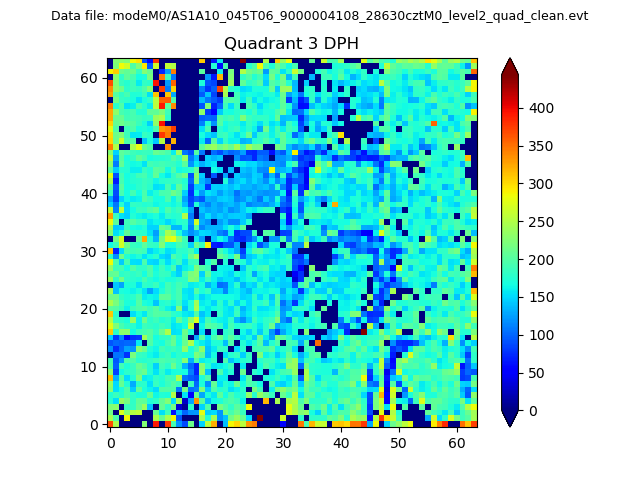 |
 |
Quadrant C |
| Plot type | Count rate plots | Images |
|---|---|---|
| Comparison with Poisson distribution Blue bars denote a histogram of data divided into 1 sec bins. Red curve is a Poisson curve with rate = median count rate of data. |
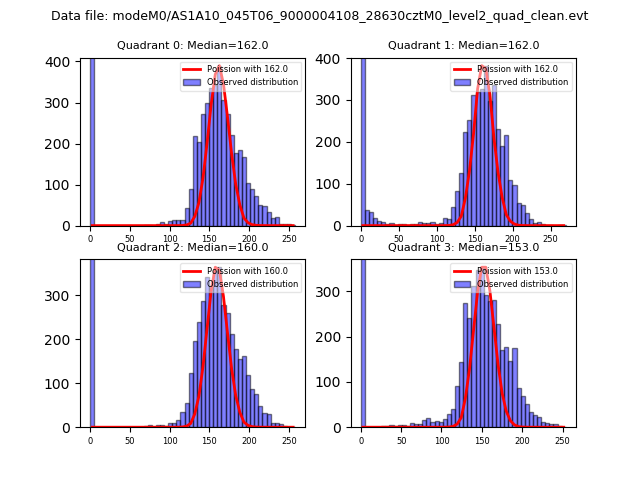 |
 |
| Quadrant-wise count rates Data is divided into 100 sec bins |
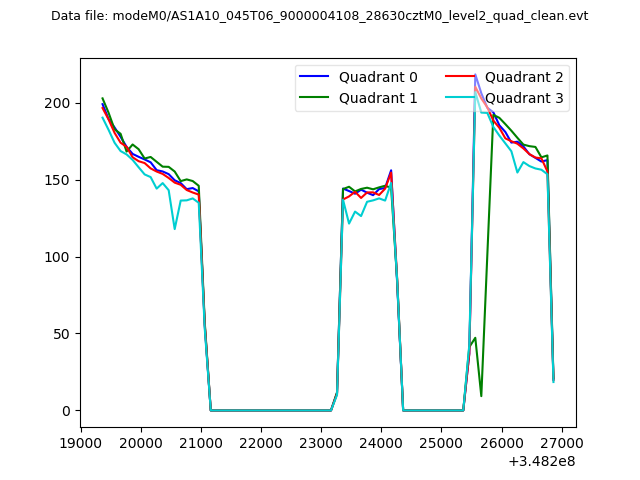 |
|
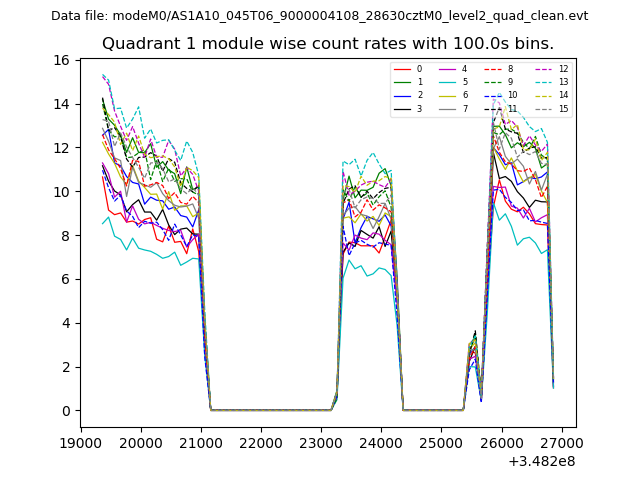
| Module-wise count rates for Quadrant A Data is divided into 100 sec bins |
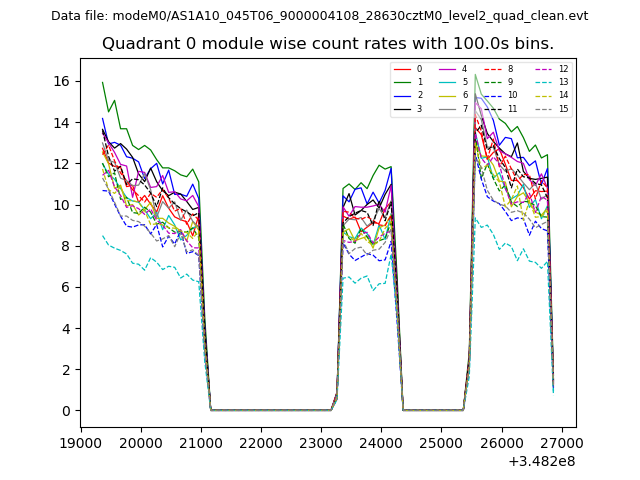 |
 |
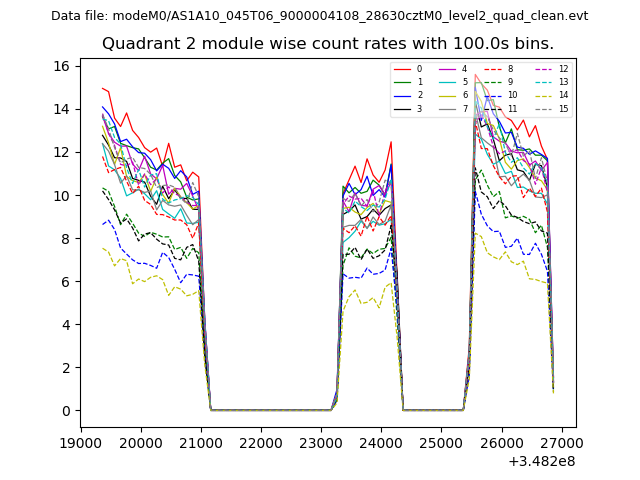
| Module-wise count rates for Quadrant B Data is divided into 100 sec bins |
 |
 |
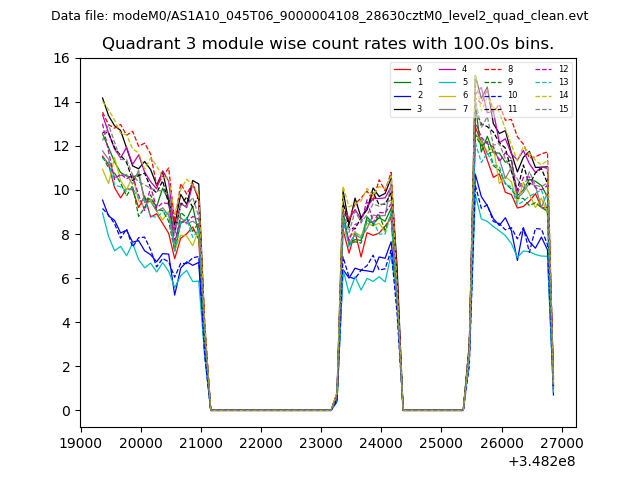
| Module-wise count rates for Quadrant C Data is divided into 100 sec bins |
 |
 |
| Module-wise count rates for Quadrant D Data is divided into 100 sec bins |
 |
 |
| Parameter | Plot |
|---|---|
| CZT HV Monitor | 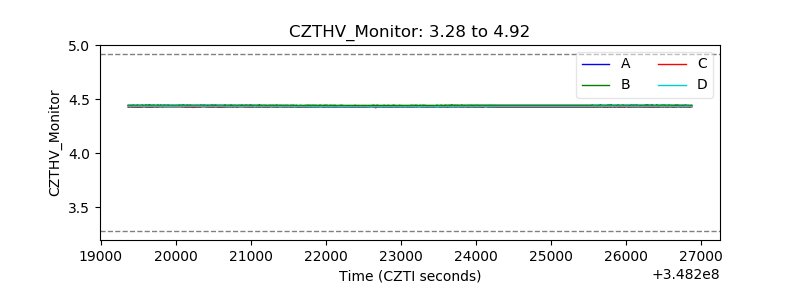 |
| D_VDD | 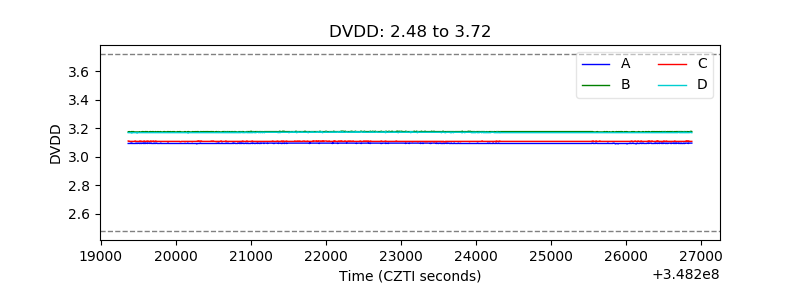 |
| Temperature 1 | 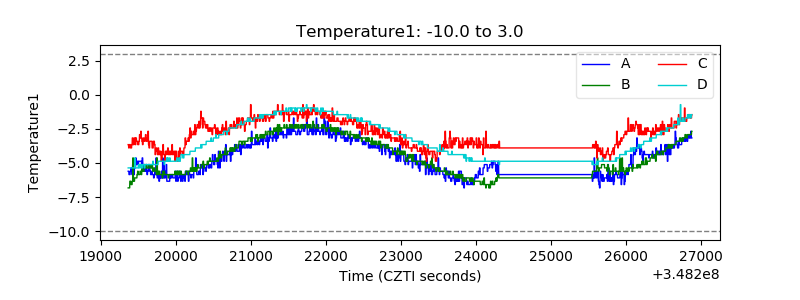 |
| Veto HV Monitor | 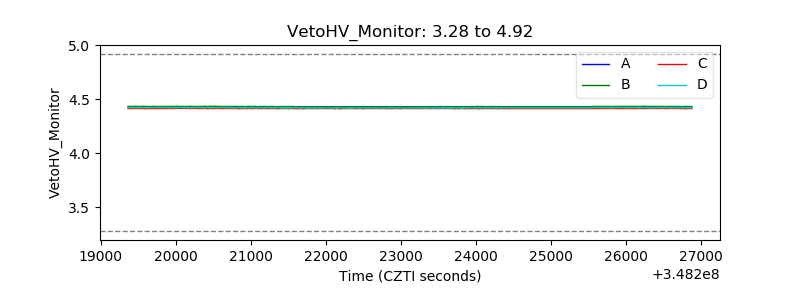 |
| Veto LLD |  |
| Alpha Counter | 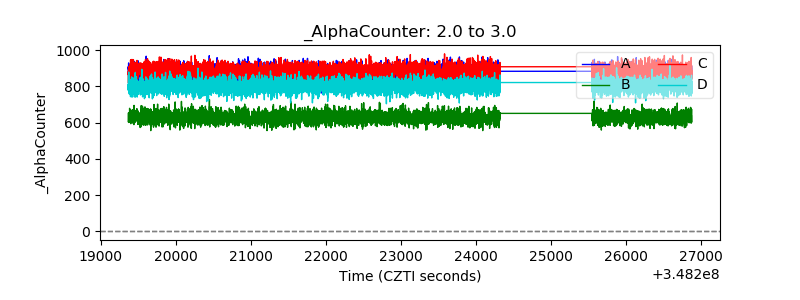 |
| _CPM_Rate | 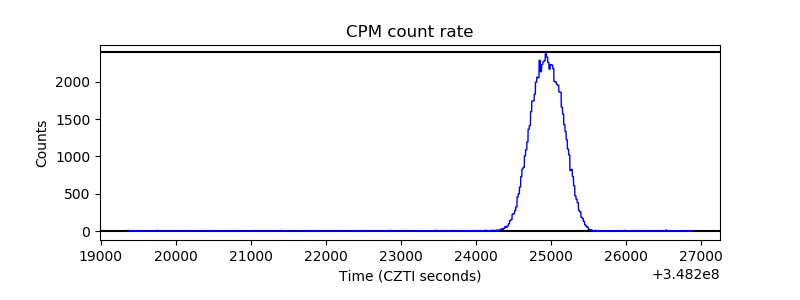 |
| CZT Counter | 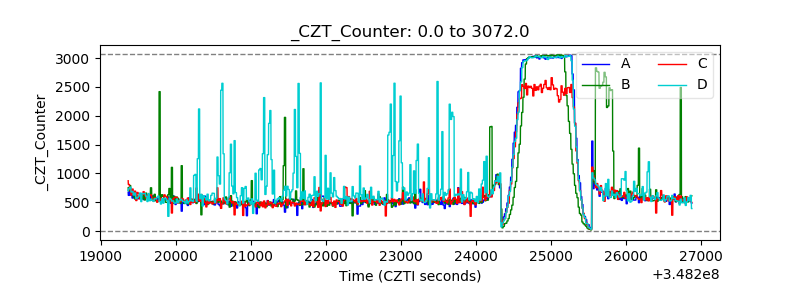 |
| +2.5 Volts monitor |  |
| +5 Volts monitor |  |
| _ROLL_ROT | 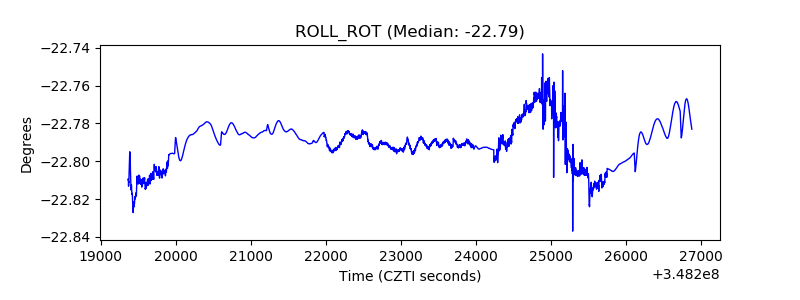 |
| _Roll_DEC | 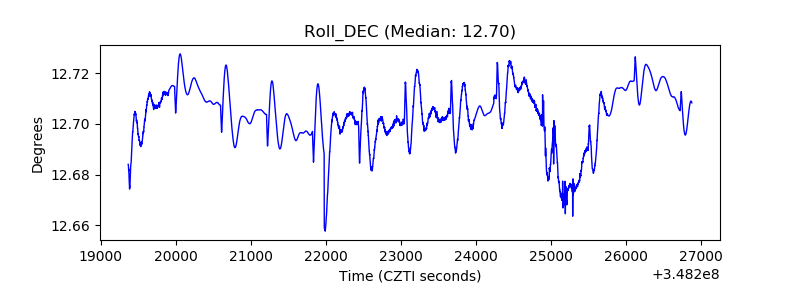 |
| _Roll_RA | 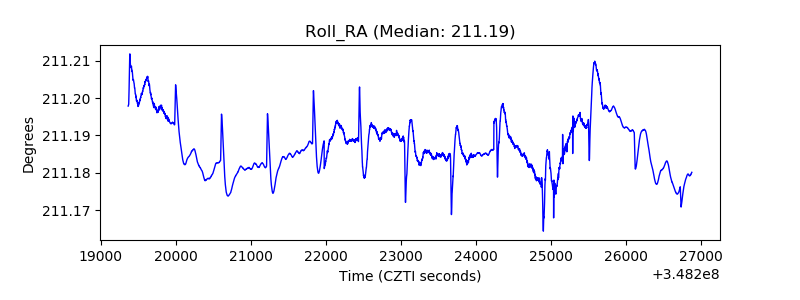 |
| Veto Counter | 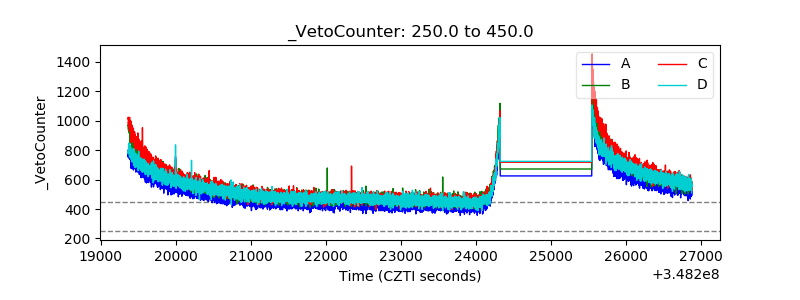 |