| Param | Original file | Final file |
|---|---|---|
| Filename | modeM0/AS1A10_045T06_9000004108_28631cztM0_level2.evt | modeM0/AS1A10_045T06_9000004108_28631cztM0_level2_quad_clean.evt |
| Size (bytes) | 469,681,920 | 79,830,720 |
| Size | 447.9 MB | 76.1 MB |
| Events in quadrant A | 3,093,450 | 514,332 |
| Events in quadrant B | 3,337,490 | 517,328 |
| Events in quadrant C | 3,107,132 | 506,398 |
| Events in quadrant D | 4,301,374 | 482,570 |
| Mode M9 | |||
|---|---|---|---|
| Quadrant | BADHDUFLAG | Total packets | Discarded packets |
| A | 0 | 13 | 0 |
| B | 0 | 13 | 0 |
| C | 0 | 13 | 0 |
| D | 0 | 13 | 0 |
| Mode M0 | |||
|---|---|---|---|
| Quadrant | BADHDUFLAG | Total packets | Discarded packets |
| A | 0 | 12341 | 1 |
| B | 0 | 13207 | 1 |
| C | 0 | 12368 | 1 |
| D | 0 | 16788 | 1 |
| Mode SS | |||
|---|---|---|---|
| Quadrant | BADHDUFLAG | Total packets | Discarded packets |
| A | 0 | 116 | 0 |
| B | 0 | 116 | 0 |
| C | 0 | 116 | 0 |
| D | 0 | 116 | 0 |
| Quadrant | Total seconds | Saturated seconds | Saturation percentage |
|---|---|---|---|
| A | 5671 | 56 | 0.987480% |
| B | 5672 | 124 | 2.186178% |
| C | 5672 | 83 | 1.463329% |
| D | 5672 | 229 | 4.037377% |
Noise dominated data is calculated using 1-second bins in cleaned event files. If a bin has >2000 counts, and if more than 50% of those come from <1% of pixels, then it is considered to be noise-dominated and hence unusable.
| Quadrant | # 1 sec bins | Bins with >0 counts | Bins with >2000 counts | High rate bins dominated by noise | Noise dominated (total time) | Noise dominated (detector-on time) | Marked lightcurve |
|---|---|---|---|---|---|---|---|
| A | 6976 | 5671 | 0 | 0 | 0.00% | 0.00% | 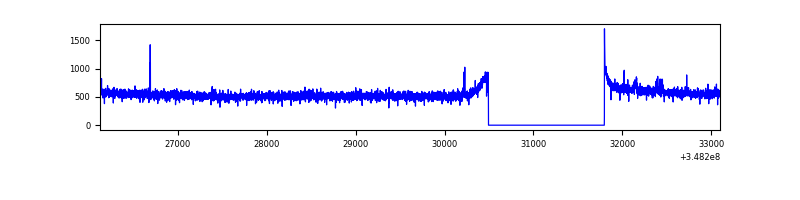 |
| B | 6977 | 5672 | 46 | 46 | 0.66% | 0.81% | 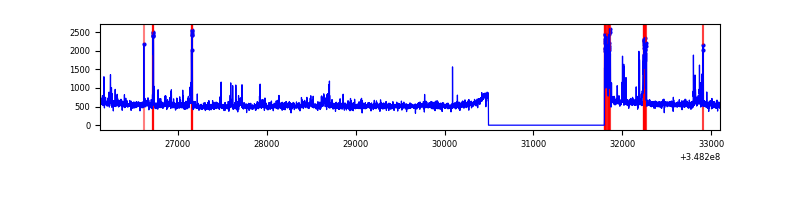 |
| C | 6977 | 5673 | 0 | 0 | 0.00% | 0.00% | 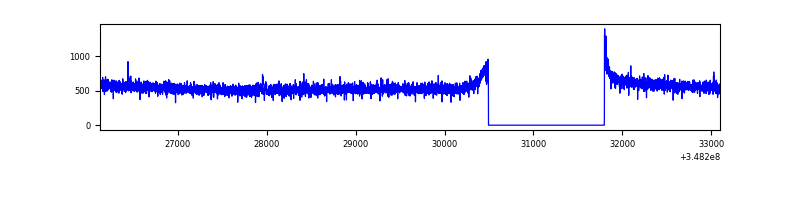 |
| D | 6977 | 5672 | 155 | 155 | 2.22% | 2.73% | 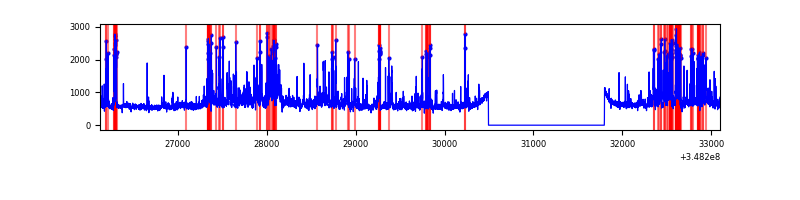 |
Top three noisy pixels from each quadrant. If the there are fewer than three noisy pixels in the level2.evt file, extra rows are filled as -1
| Pixel properties | Quadrant properties | ||||||
|---|---|---|---|---|---|---|---|
| Quadrant | DetID | PixID | Counts | Sigma | Mean | Median | Sigma |
| A | 1 | 113 | 16948 | 102.25 | 794 | 780 | 158.1 |
| A | 13 | 254 | 10623 | 62.25 | 794 | 780 | 158.1 |
| A | 3 | 137 | 6963 | 39.1 | 794 | 780 | 158.1 |
| B | 10 | 245 | 295981 | 2045.72 | 771 | 752 | 144.3 |
| B | 12 | 111 | 16903 | 111.91 | 771 | 752 | 144.3 |
| B | 11 | 111 | 15382 | 101.38 | 771 | 752 | 144.3 |
| C | 14 | 238 | 126311 | 710.65 | 761 | 769 | 176.7 |
| C | 7 | 247 | 7843 | 40.04 | 761 | 769 | 176.7 |
| C | 13 | 61 | 5232 | 25.26 | 761 | 769 | 176.7 |
| D | 1 | 52 | 993935 | 5616.34 | 761 | 744 | 176.8 |
| D | 8 | 195 | 290248 | 1637.1 | 761 | 744 | 176.8 |
| D | 2 | 250 | 83762 | 469.45 | 761 | 744 | 176.8 |
Histogram calculated using DETX and DETY for each event in the final _common_clean file
| Quadrant A | 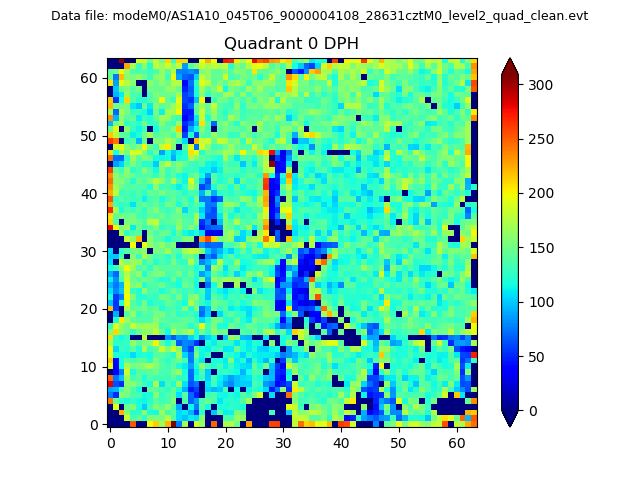 |
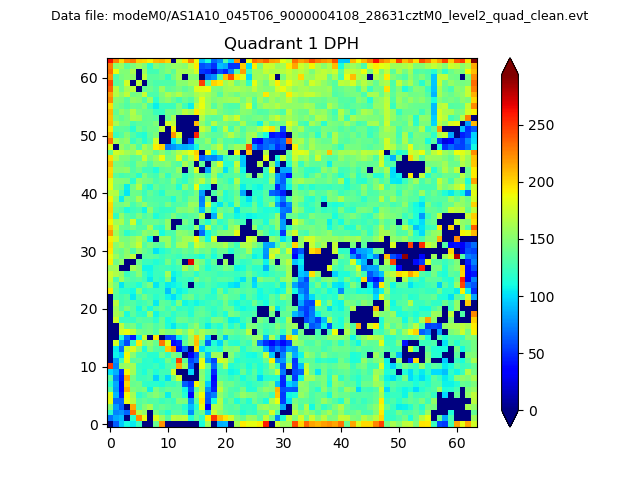 |
Quadrant B |
|---|---|---|---|
| Quadrant D |  |
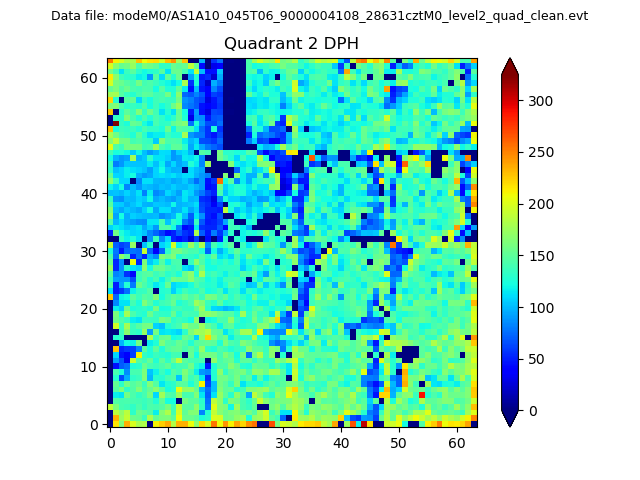 |
Quadrant C |
| Plot type | Count rate plots | Images |
|---|---|---|
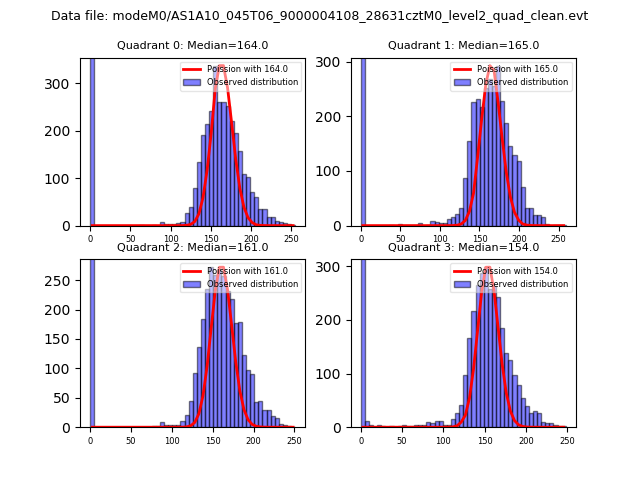
| Comparison with Poisson distribution Blue bars denote a histogram of data divided into 1 sec bins. Red curve is a Poisson curve with rate = median count rate of data. |
 |
 |
| Quadrant-wise count rates Data is divided into 100 sec bins |
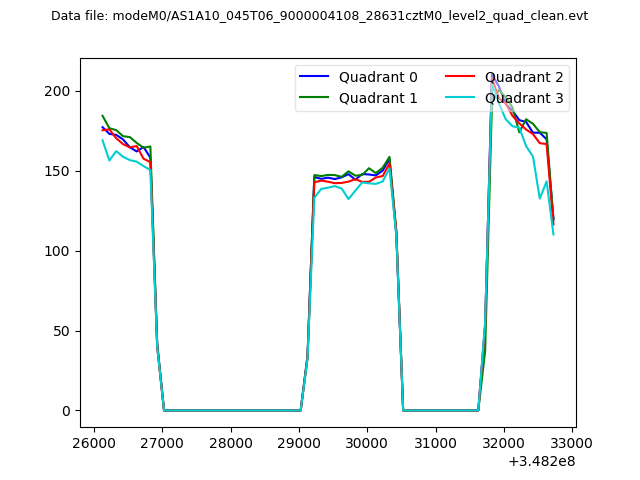 |
|
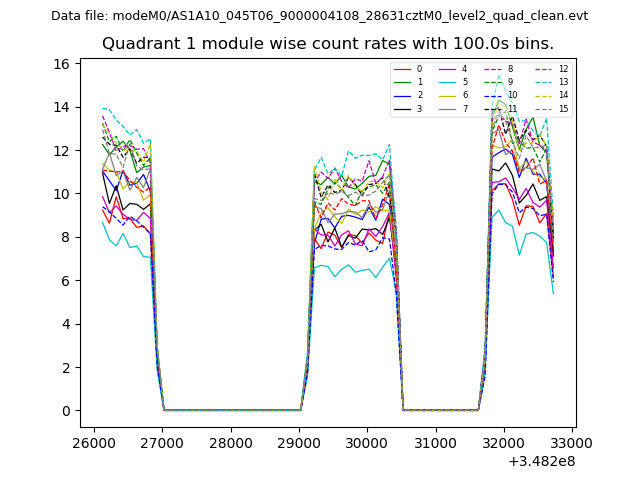
| Module-wise count rates for Quadrant A Data is divided into 100 sec bins |
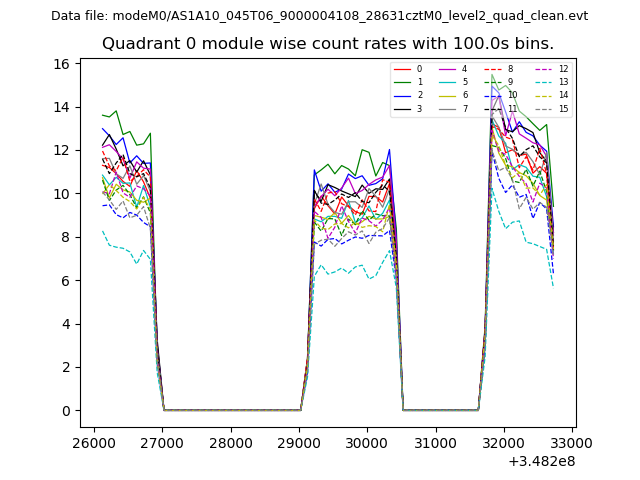 |
 |
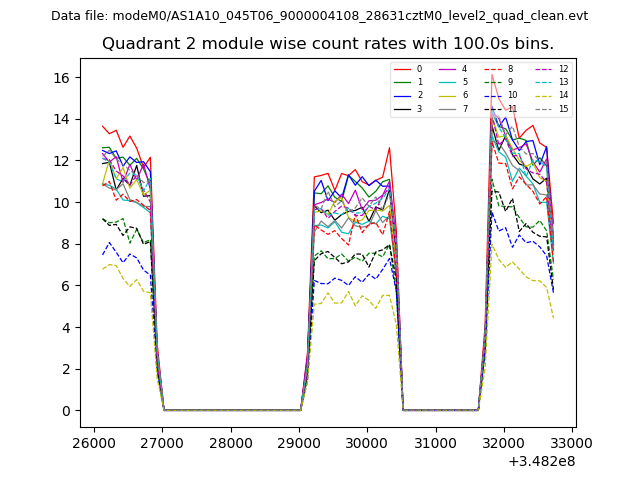
| Module-wise count rates for Quadrant B Data is divided into 100 sec bins |
 |
 |
| Module-wise count rates for Quadrant C Data is divided into 100 sec bins |
 |
 |
| Module-wise count rates for Quadrant D Data is divided into 100 sec bins |
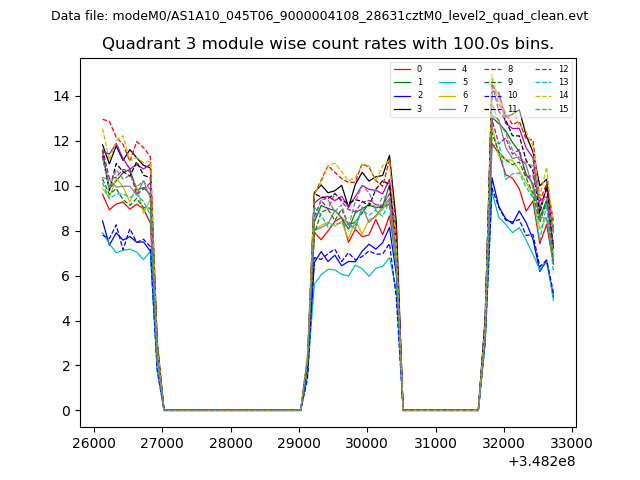 |
 |
| Parameter | Plot |
|---|---|
| CZT HV Monitor | 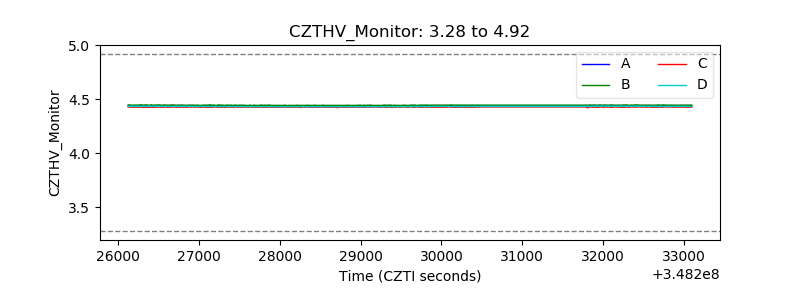 |
| D_VDD | 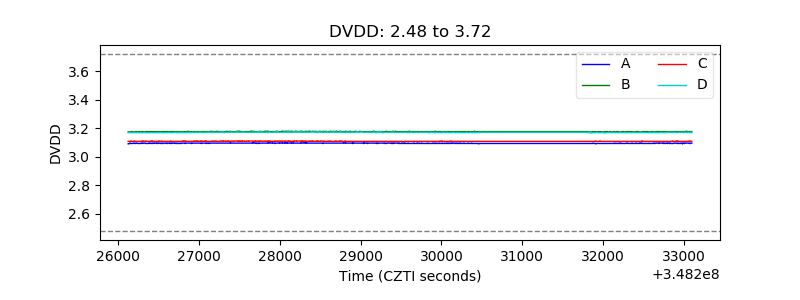 |
| Temperature 1 | 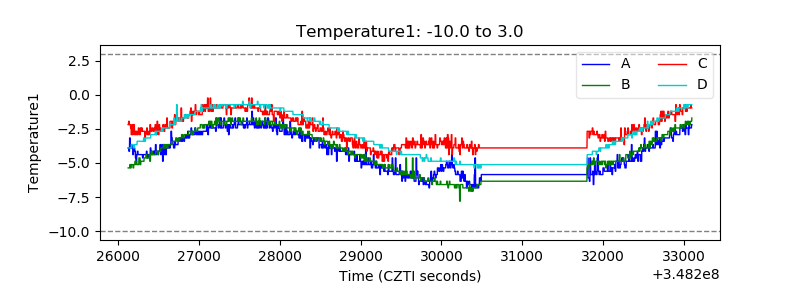 |
| Veto HV Monitor | 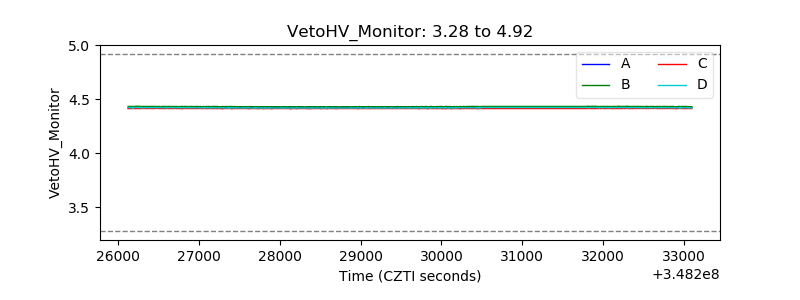 |
| Veto LLD | 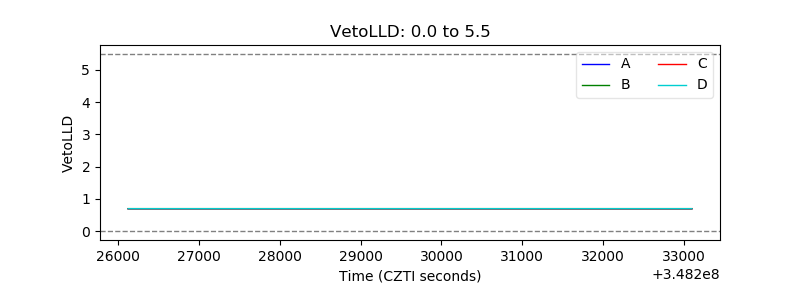 |
| Alpha Counter | 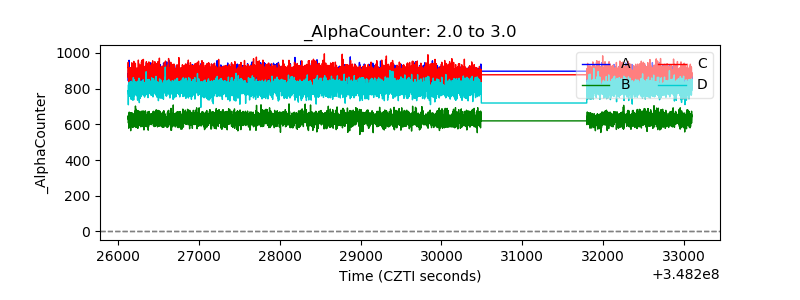 |
| _CPM_Rate | 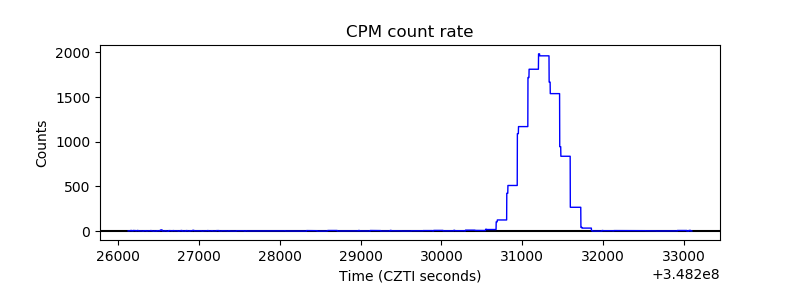 |
| CZT Counter | 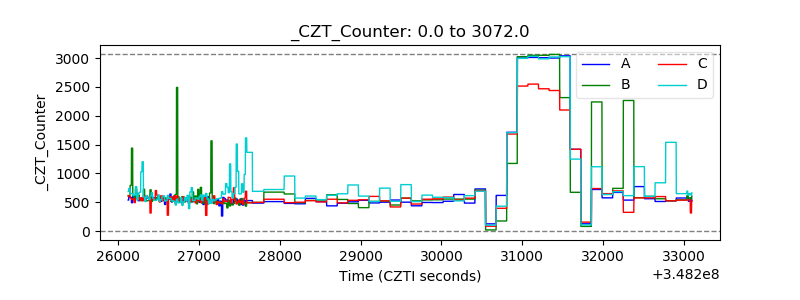 |
| +2.5 Volts monitor |  |
| +5 Volts monitor |  |
| _ROLL_ROT | 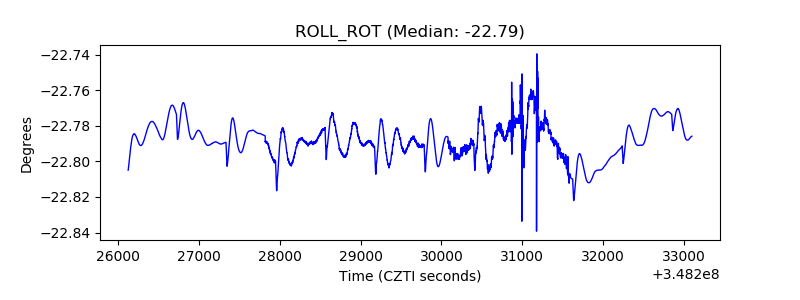 |
| _Roll_DEC | 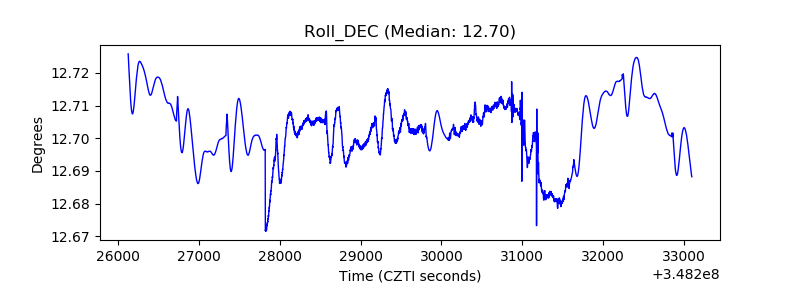 |
| _Roll_RA |  |
| Veto Counter | 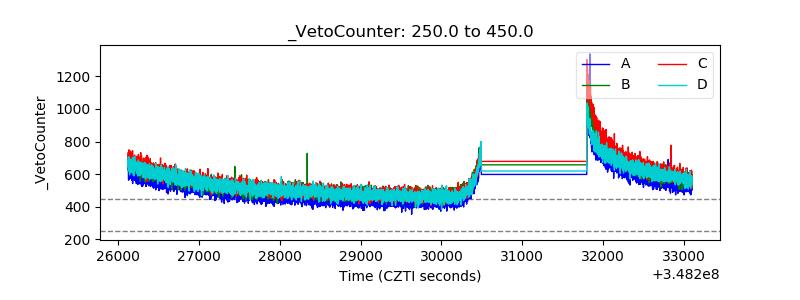 |