| Param | Original file | Final file |
|---|---|---|
| Filename | modeM0/AS1A10_045T06_9000004108_28632cztM0_level2.evt | modeM0/AS1A10_045T06_9000004108_28632cztM0_level2_quad_clean.evt |
| Size (bytes) | 349,081,920 | 45,815,040 |
| Size | 332.9 MB | 43.7 MB |
| Events in quadrant A | 2,185,968 | 284,754 |
| Events in quadrant B | 2,299,400 | 282,334 |
| Events in quadrant C | 2,137,314 | 279,378 |
| Events in quadrant D | 3,681,371 | 262,614 |
| Mode M9 | |||
|---|---|---|---|
| Quadrant | BADHDUFLAG | Total packets | Discarded packets |
| A | 0 | 1 | 0 |
| B | 0 | 2 | 0 |
| C | 0 | 2 | 0 |
| D | 0 | 2 | 0 |
| Mode M0 | |||
|---|---|---|---|
| Quadrant | BADHDUFLAG | Total packets | Discarded packets |
| A | 0 | 8755 | 1 |
| B | 0 | 9102 | 1 |
| C | 0 | 8565 | 1 |
| D | 0 | 13953 | 1 |
| Mode SS | |||
|---|---|---|---|
| Quadrant | BADHDUFLAG | Total packets | Discarded packets |
| A | 0 | 78 | 0 |
| B | 0 | 78 | 0 |
| C | 0 | 78 | 0 |
| D | 0 | 78 | 0 |
| Quadrant | Total seconds | Saturated seconds | Saturation percentage |
|---|---|---|---|
| A | 3937 | 18 | 0.457201% |
| B | 3937 | 69 | 1.752604% |
| C | 3937 | 31 | 0.787402% |
| D | 3937 | 378 | 9.601219% |
Noise dominated data is calculated using 1-second bins in cleaned event files. If a bin has >2000 counts, and if more than 50% of those come from <1% of pixels, then it is considered to be noise-dominated and hence unusable.
| Quadrant | # 1 sec bins | Bins with >0 counts | Bins with >2000 counts | High rate bins dominated by noise | Noise dominated (total time) | Noise dominated (detector-on time) | Marked lightcurve |
|---|---|---|---|---|---|---|---|
| A | 3936 | 3936 | 0 | 0 | 0.00% | 0.00% | 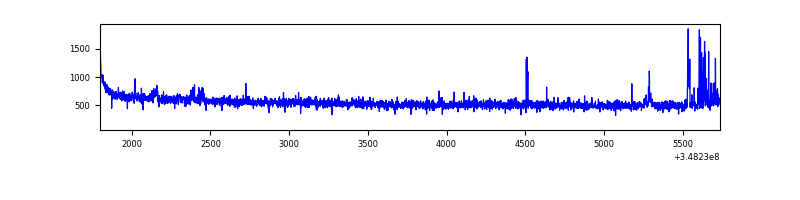 |
| B | 3936 | 3936 | 34 | 34 | 0.86% | 0.86% | 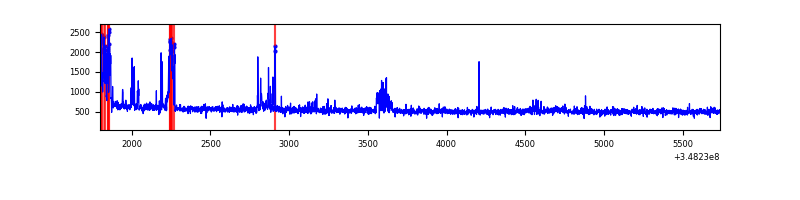 |
| C | 3937 | 3937 | 0 | 0 | 0.00% | 0.00% | 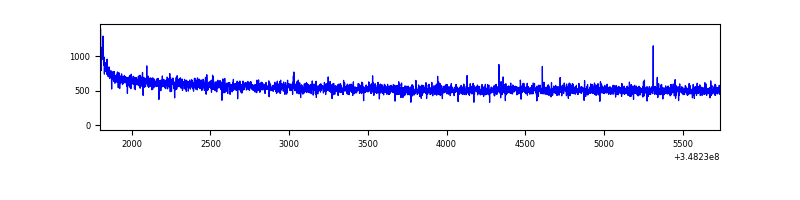 |
| D | 3936 | 3936 | 258 | 258 | 6.55% | 6.55% | 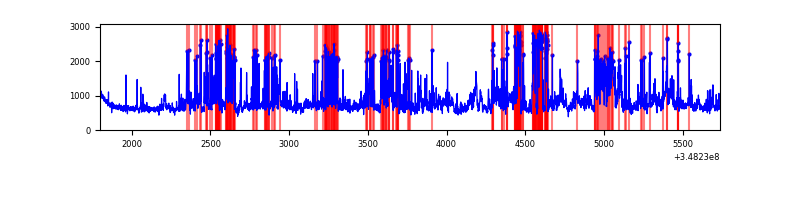 |
Top three noisy pixels from each quadrant. If the there are fewer than three noisy pixels in the level2.evt file, extra rows are filled as -1
| Pixel properties | Quadrant properties | ||||||
|---|---|---|---|---|---|---|---|
| Quadrant | DetID | PixID | Counts | Sigma | Mean | Median | Sigma |
| A | 15 | 174 | 52988 | 478.8 | 547 | 538 | 109.5 |
| A | 1 | 113 | 15829 | 139.59 | 547 | 538 | 109.5 |
| A | 13 | 254 | 7187 | 60.7 | 547 | 538 | 109.5 |
| B | 10 | 245 | 174195 | 1736.42 | 528 | 517 | 100.0 |
| B | 15 | 33 | 30442 | 299.19 | 528 | 517 | 100.0 |
| B | 12 | 111 | 11297 | 107.78 | 528 | 517 | 100.0 |
| C | 14 | 238 | 87124 | 716.02 | 523 | 529 | 120.9 |
| C | 7 | 247 | 5728 | 42.99 | 523 | 529 | 120.9 |
| C | 14 | 254 | 4240 | 30.68 | 523 | 529 | 120.9 |
| D | 1 | 52 | 1272771 | 10603.23 | 506 | 494 | 120.0 |
| D | 8 | 195 | 354160 | 2947.47 | 506 | 494 | 120.0 |
| D | 2 | 250 | 84558 | 700.59 | 506 | 494 | 120.0 |
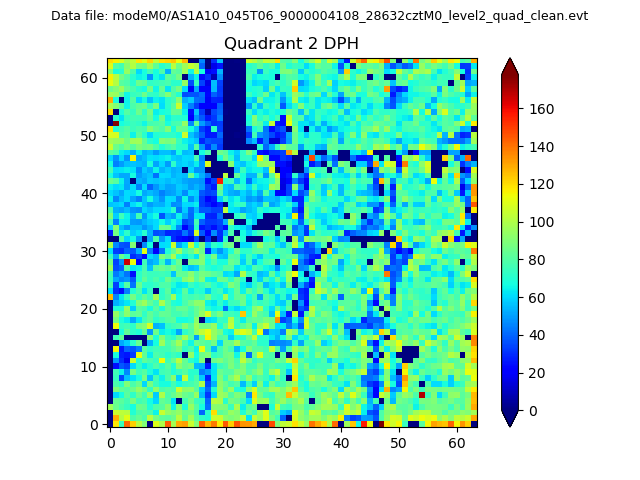
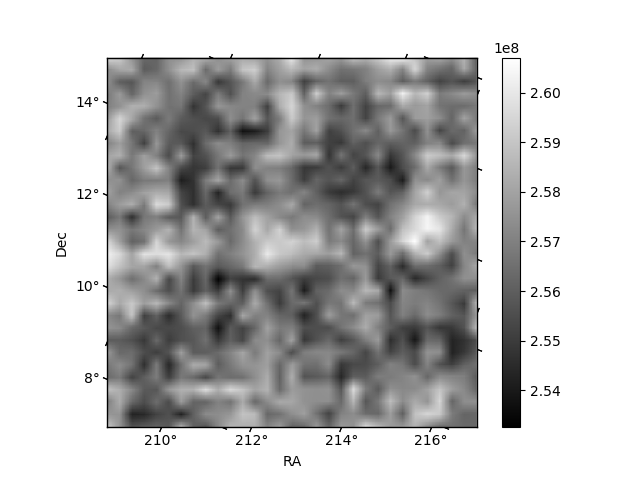
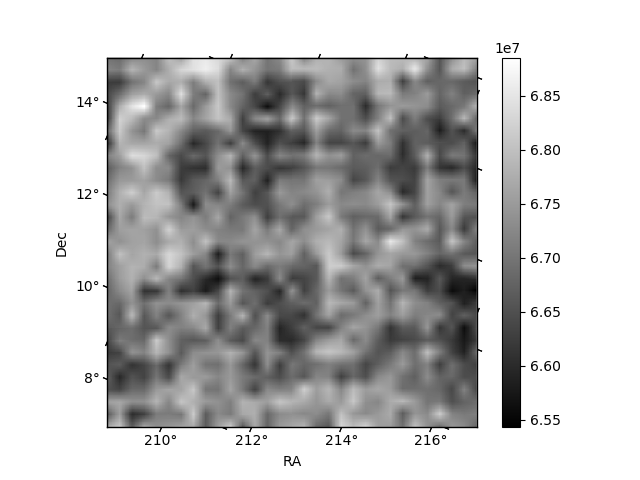
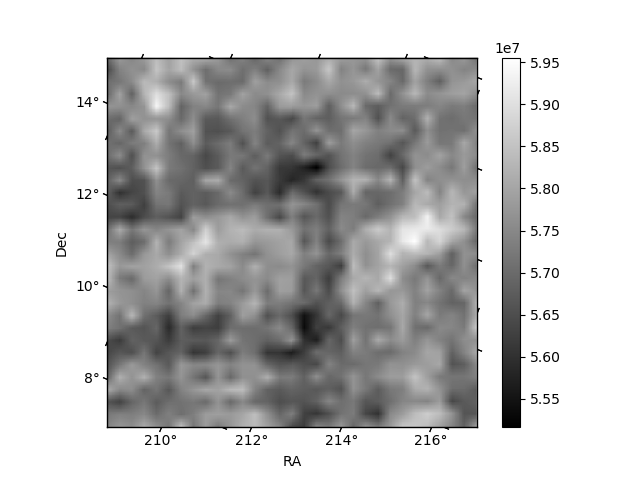
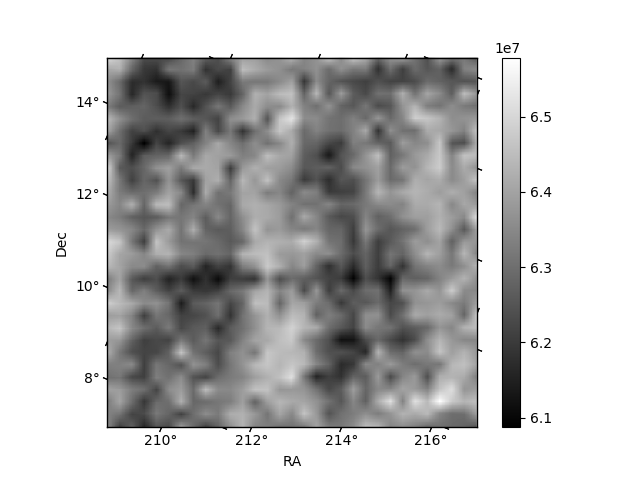
Histogram calculated using DETX and DETY for each event in the final _common_clean file
| Quadrant A | 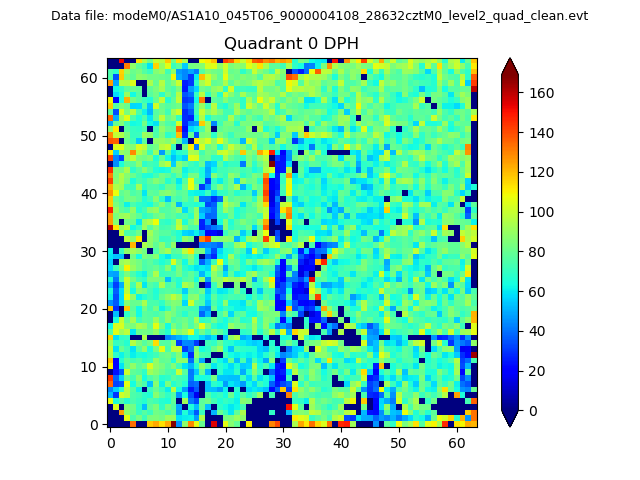 |
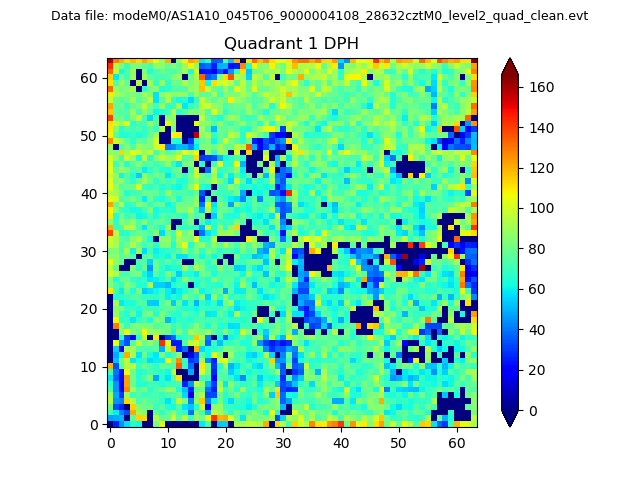 |
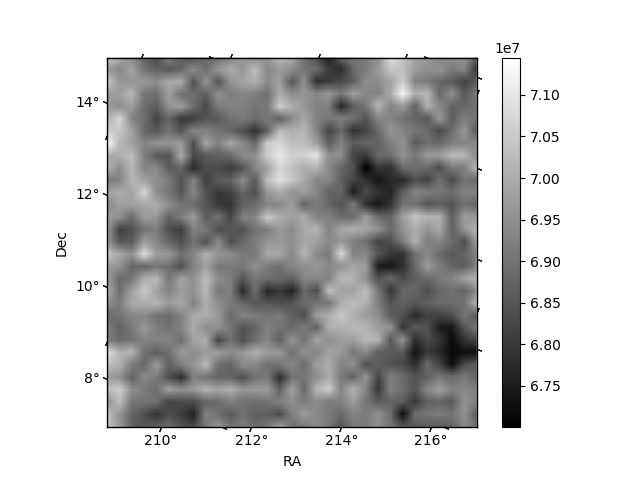
Quadrant B |
|---|---|---|---|
| Quadrant D | 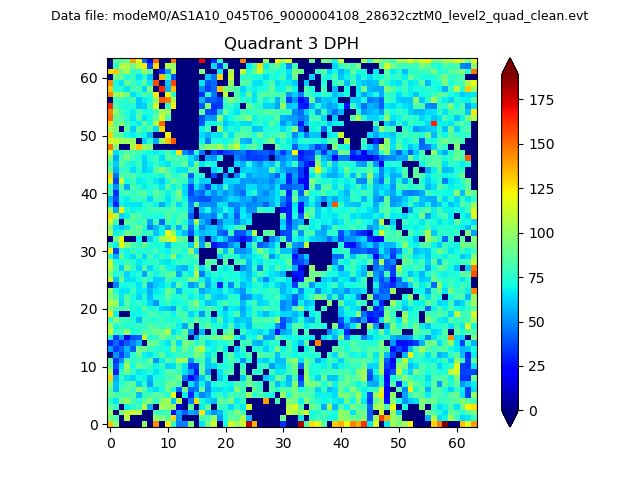 |
 |
Quadrant C |
| Plot type | Count rate plots | Images |
|---|---|---|
| Comparison with Poisson distribution Blue bars denote a histogram of data divided into 1 sec bins. Red curve is a Poisson curve with rate = median count rate of data. |
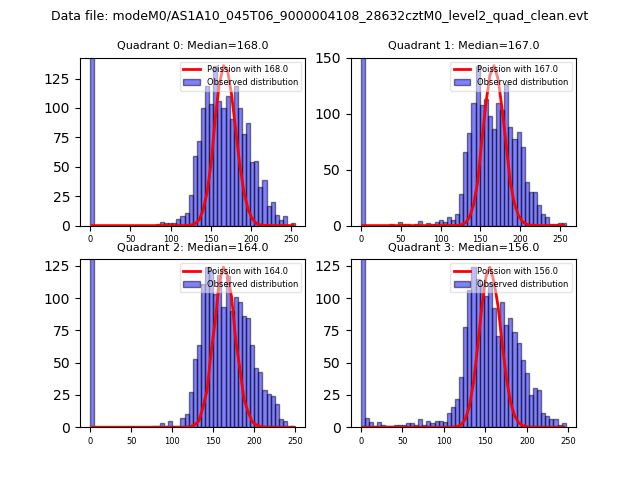 |
 |
| Quadrant-wise count rates Data is divided into 100 sec bins |
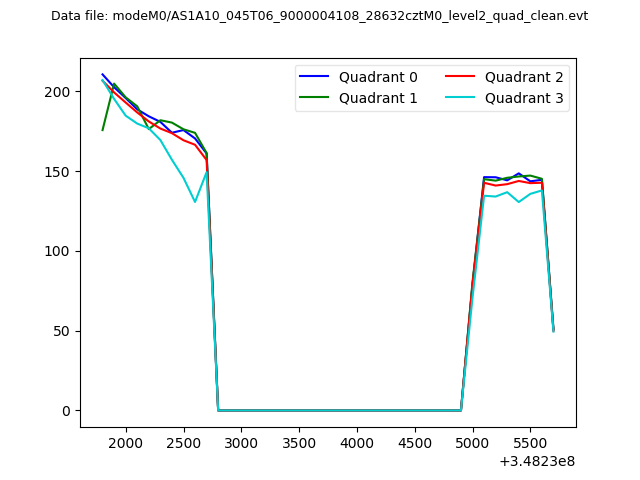 |
|
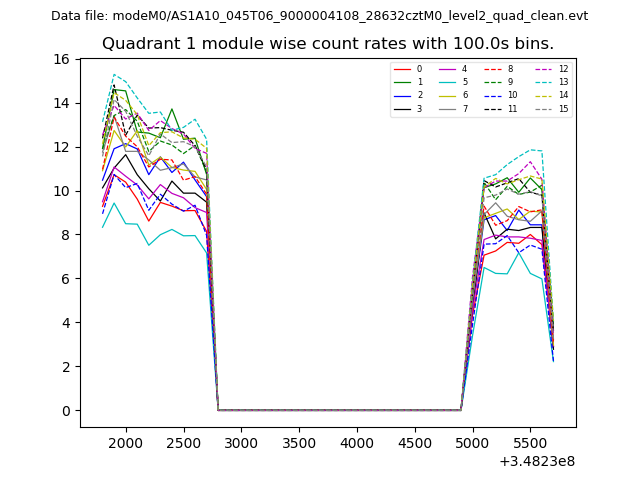
| Module-wise count rates for Quadrant A Data is divided into 100 sec bins |
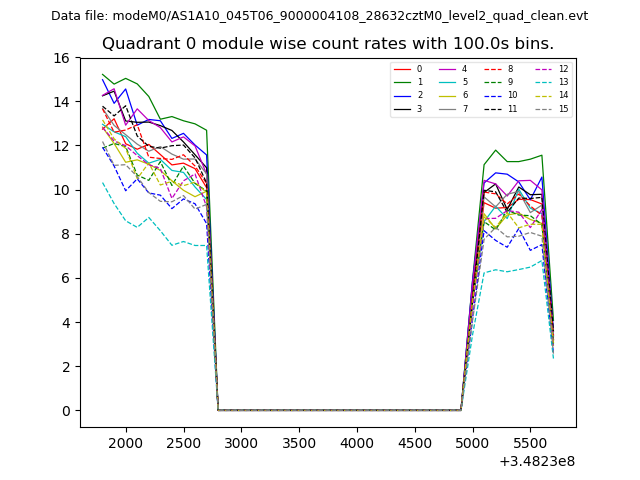 |
 |
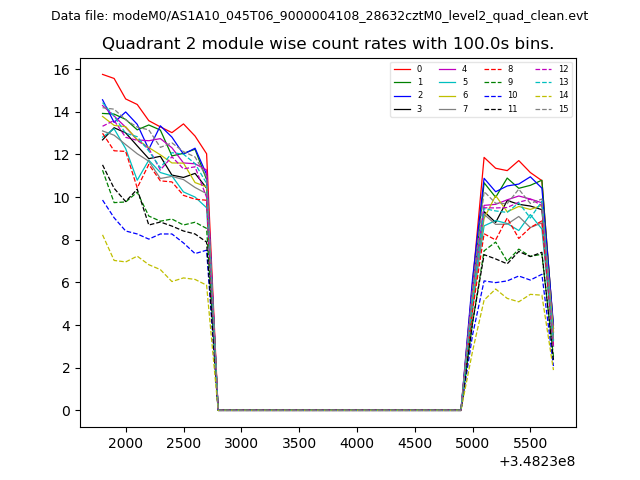
| Module-wise count rates for Quadrant B Data is divided into 100 sec bins |
 |
 |
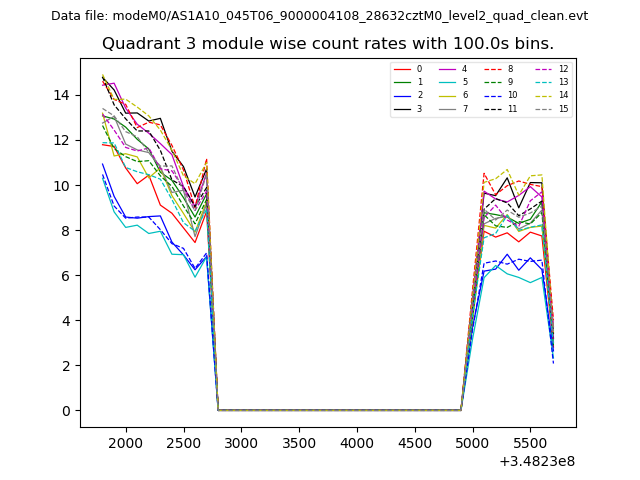
| Module-wise count rates for Quadrant C Data is divided into 100 sec bins |
 |
 |
| Module-wise count rates for Quadrant D Data is divided into 100 sec bins |
 |
 |
| Parameter | Plot |
|---|---|
| CZT HV Monitor | 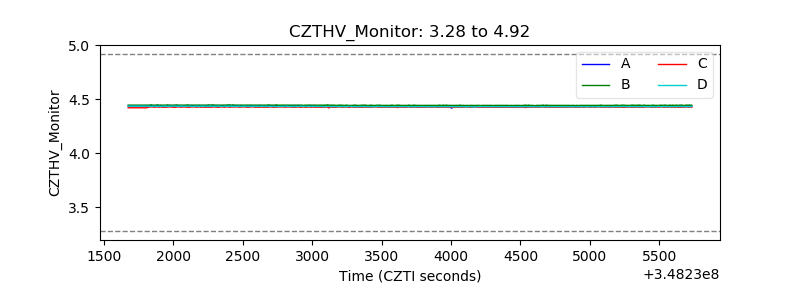 |
| D_VDD | 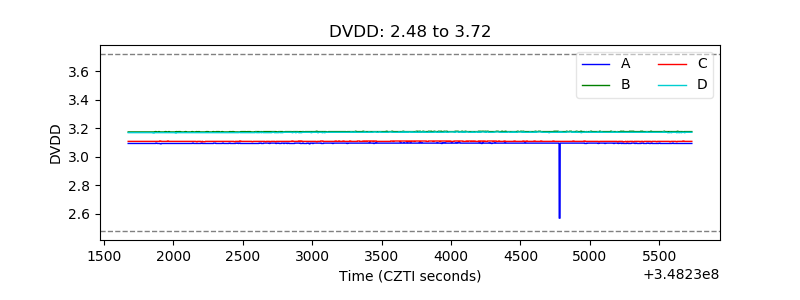 |
| Temperature 1 | 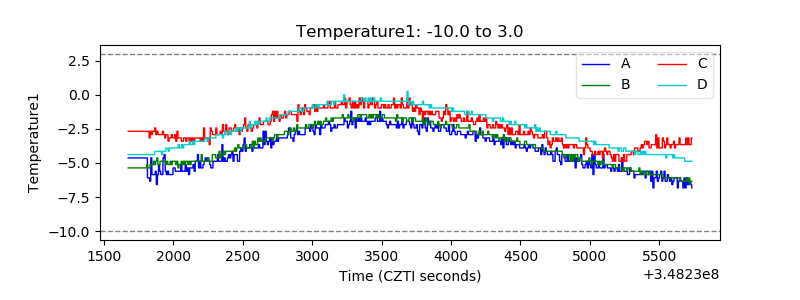 |
| Veto HV Monitor | 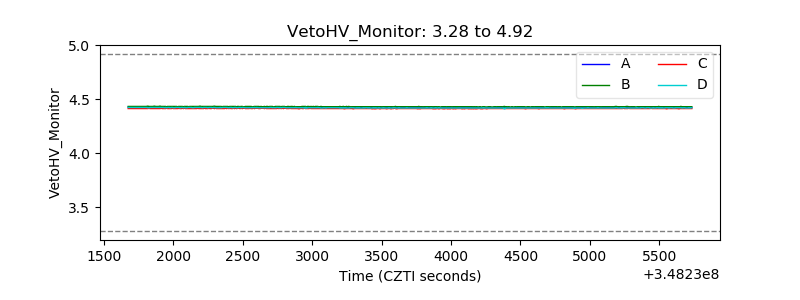 |
| Veto LLD | 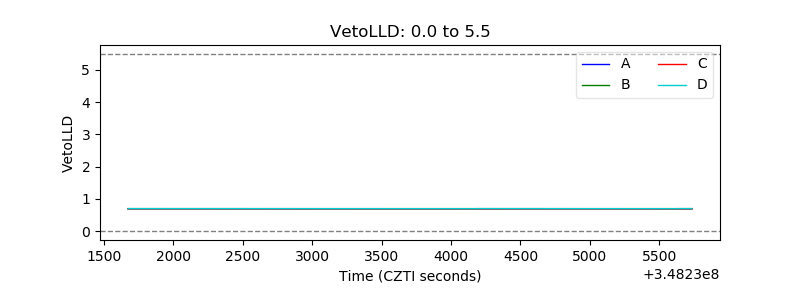 |
| Alpha Counter | 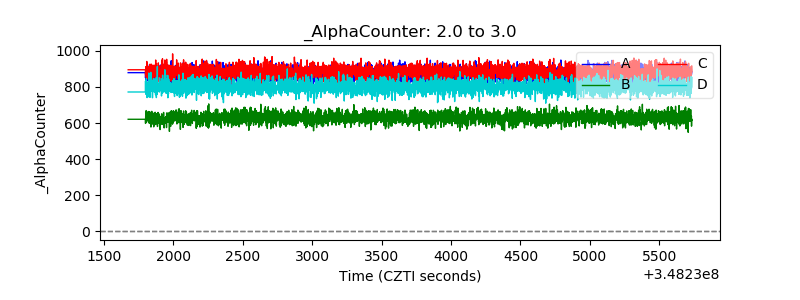 |
| _CPM_Rate | 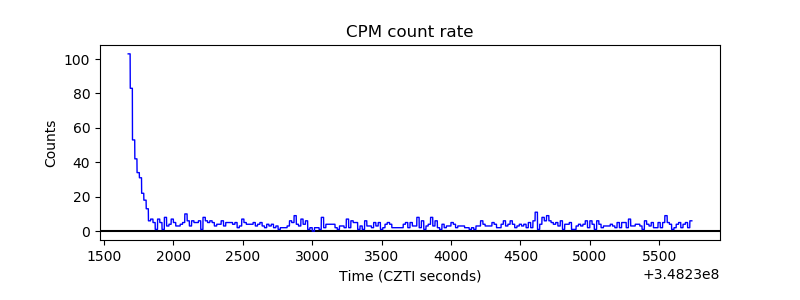 |
| CZT Counter | 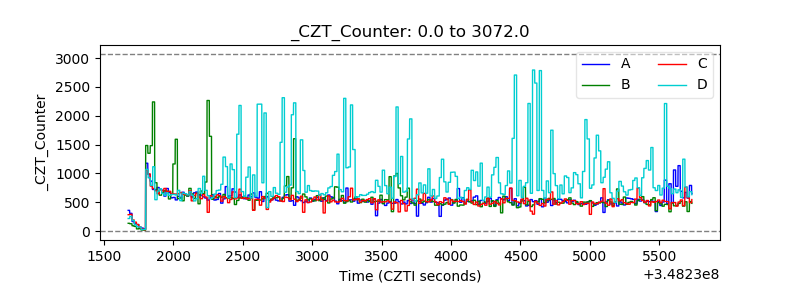 |
| +2.5 Volts monitor |  |
| +5 Volts monitor |  |
| _ROLL_ROT | 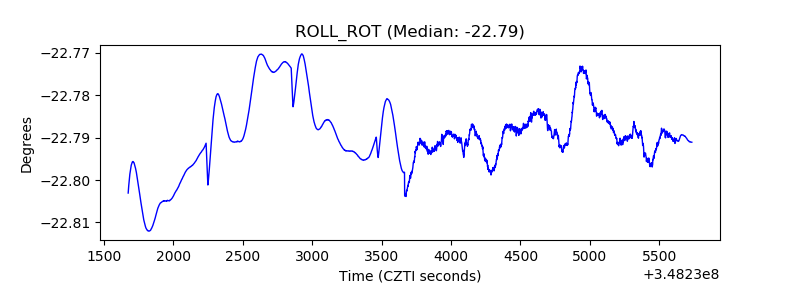 |
| _Roll_DEC | 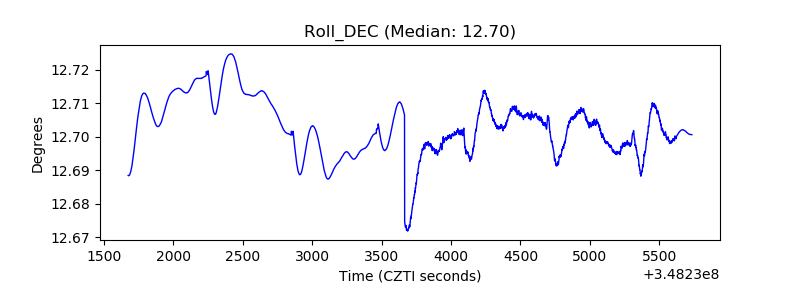 |
| _Roll_RA | 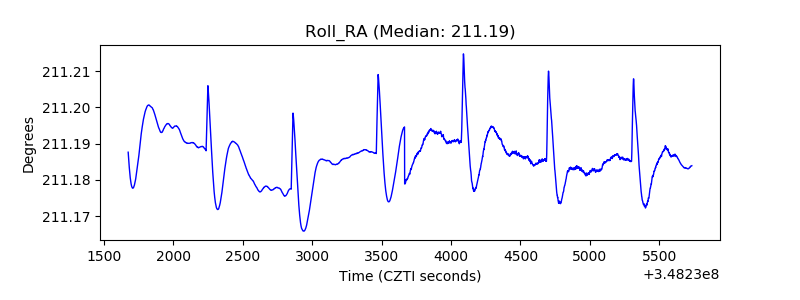 |
| Veto Counter | 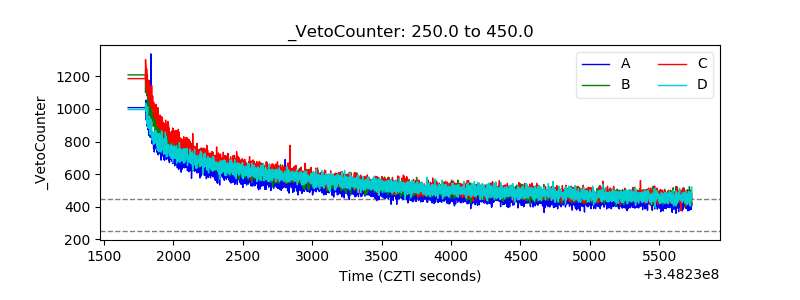 |