| Param | Original file | Final file |
|---|---|---|
| Filename | modeM0/AS1A10_045T07_9000004110cztM0_level2.fits | modeM0/AS1A10_045T07_9000004110cztM0_level2_quad_clean.evt |
| Size (bytes) | 798,575,040 | 604,771,200 |
| Size | 761.6 MB | 576.8 MB |
| Events in quadrant A | 5,033,378 | 3,370,427 |
| Events in quadrant B | 4,724,762 | 3,341,001 |
| Events in quadrant C | 4,928,644 | 3,258,895 |
| Events in quadrant D | 4,065,090 | 2,913,563 |
| Mode SS | |||
|---|---|---|---|
| Quadrant | BADHDUFLAG | Total packets | Discarded packets |
| A | 0 | 1560 | 0 |
| B | 0 | 1560 | 0 |
| C | 0 | 1560 | 0 |
| D | 0 | 1560 | 0 |
| Mode M9 | |||
|---|---|---|---|
| Quadrant | BADHDUFLAG | Total packets | Discarded packets |
| A | 0 | 135 | 0 |
| B | 0 | 135 | 0 |
| C | 0 | 135 | 0 |
| D | 0 | 135 | 0 |
| Mode M0 | |||
|---|---|---|---|
| Quadrant | BADHDUFLAG | Total packets | Discarded packets |
| A | 0 | 168592 | 0 |
| B | 0 | 180287 | 0 |
| C | 0 | 167111 | 0 |
| D | 0 | 268739 | 0 |
| Quadrant | Total seconds | Saturated seconds | Saturation percentage |
|---|---|---|---|
| A | 79377 | 1123 | 1.414768% |
| B | 79371 | 2219 | 2.795731% |
| C | 79375 | 1750 | 2.204724% |
| D | 79375 | 8417 | 10.604094% |
Noise dominated data is calculated using 1-second bins in cleaned event files. If a bin has >2000 counts, and if more than 50% of those come from <1% of pixels, then it is considered to be noise-dominated and hence unusable.
| Quadrant | # 1 sec bins | Bins with >0 counts | Bins with >2000 counts | High rate bins dominated by noise | Noise dominated (total time) | Noise dominated (detector-on time) | Marked lightcurve |
|---|---|---|---|---|---|---|---|
| A | 93082 | 79374 | 0 | 0 | 0.00% | 0.00% | 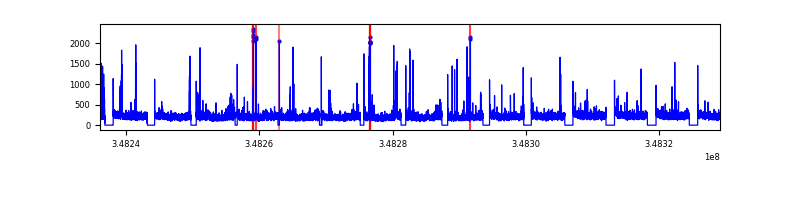 |
| B | 93082 | 79317 | 0 | 0 | 0.00% | 0.00% | 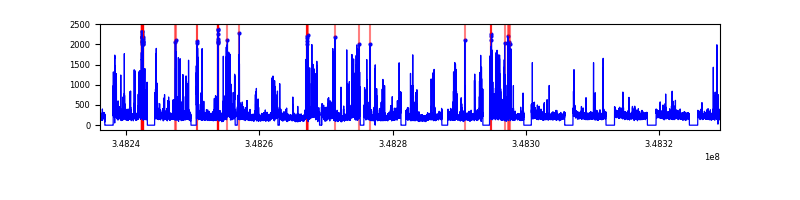 |
| C | 93083 | 79373 | 0 | 0 | 0.00% | 0.00% |  |
| D | 93082 | 79067 | 0 | 0 | 0.00% | 0.00% |  |
Top three noisy pixels from each quadrant. If the there are fewer than three noisy pixels in the level2.evt file, extra rows are filled as -1
| Pixel properties | Quadrant properties | ||||||
|---|---|---|---|---|---|---|---|
| Quadrant | DetID | PixID | Counts | Sigma | Mean | Median | Sigma |
| A | 0 | 29 | 4935 | 11.49 | 1312 | 1228 | 322.6 |
| A | 7 | 110 | 3947 | 8.43 | 1312 | 1228 | 322.6 |
| A | 0 | 30 | 3803 | 7.98 | 1312 | 1228 | 322.6 |
| B | 2 | 9 | 3720 | 10.33 | 1251 | 1194 | 244.5 |
| B | 5 | 128 | 3084 | 7.73 | 1251 | 1194 | 244.5 |
| B | 14 | 254 | 3080 | 7.71 | 1251 | 1194 | 244.5 |
| C | 1 | 81 | 3778 | 7.83 | 1302 | 1223 | 326.5 |
| C | 1 | 80 | 3735 | 7.69 | 1302 | 1223 | 326.5 |
| C | 3 | 126 | 3379 | 6.6 | 1302 | 1223 | 326.5 |
| D | 15 | 46 | 3008 | 6.29 | 1163 | 1062 | 309.3 |
| D | 6 | 67 | 2955 | 6.12 | 1163 | 1062 | 309.3 |
| D | 3 | 14 | 2879 | 5.88 | 1163 | 1062 | 309.3 |
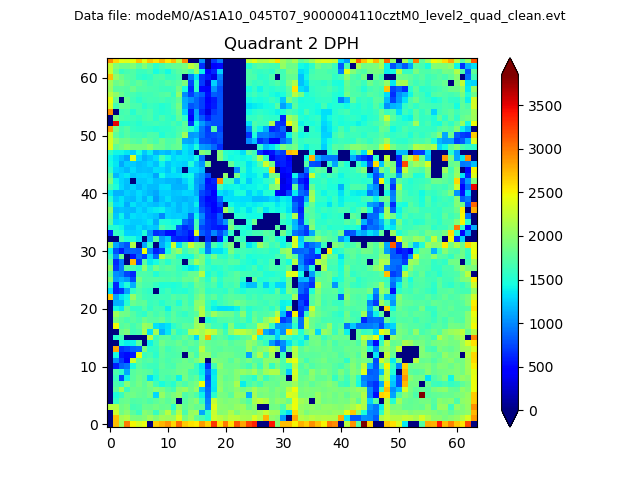
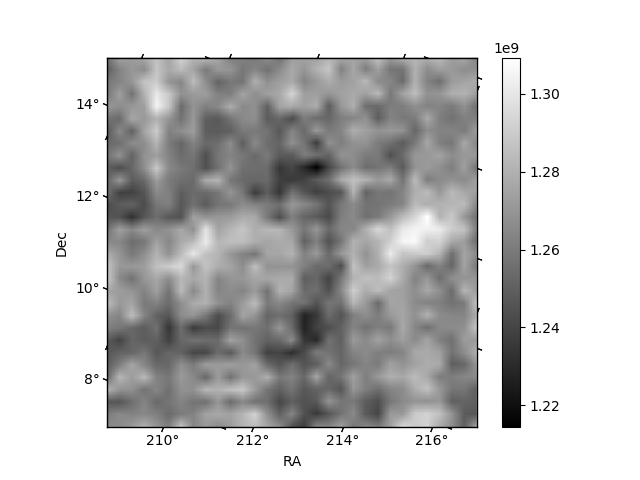
Histogram calculated using DETX and DETY for each event in the final _common_clean file
| Quadrant A | 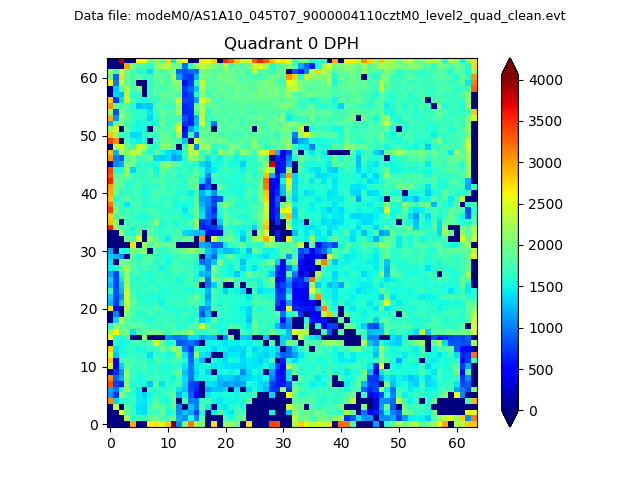 |
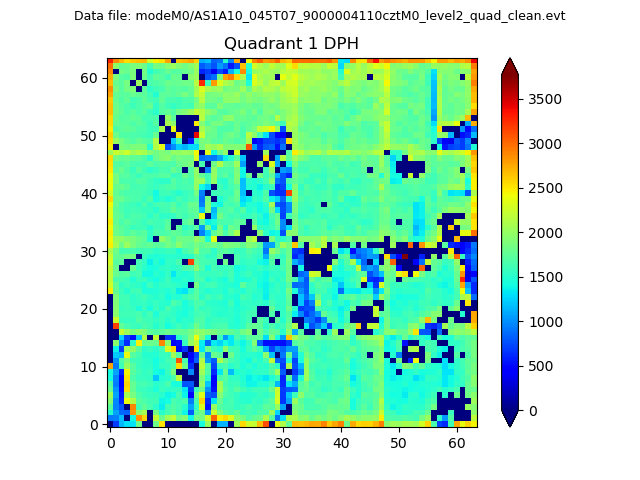 |
Quadrant B |
|---|---|---|---|
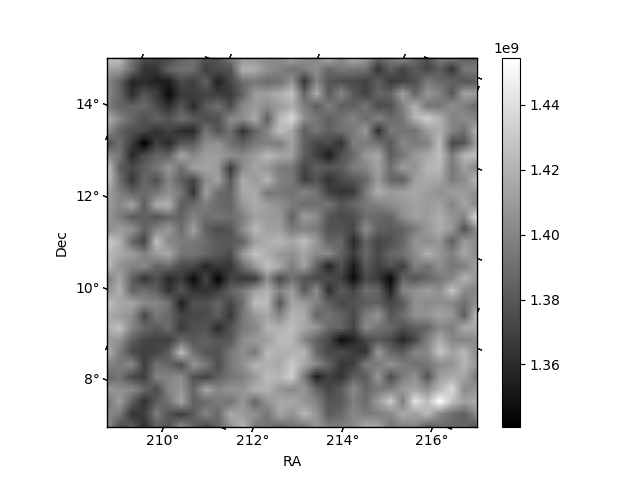
| Quadrant D | 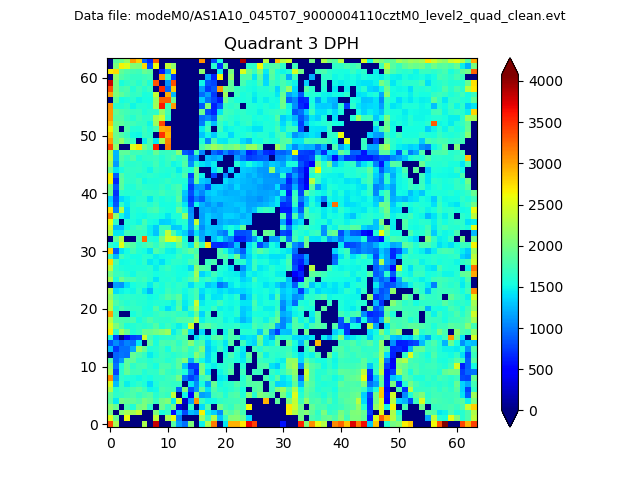 |
 |
Quadrant C |
| Plot type | Count rate plots | Images |
|---|---|---|
| Comparison with Poisson distribution Blue bars denote a histogram of data divided into 1 sec bins. Red curve is a Poisson curve with rate = median count rate of data. |
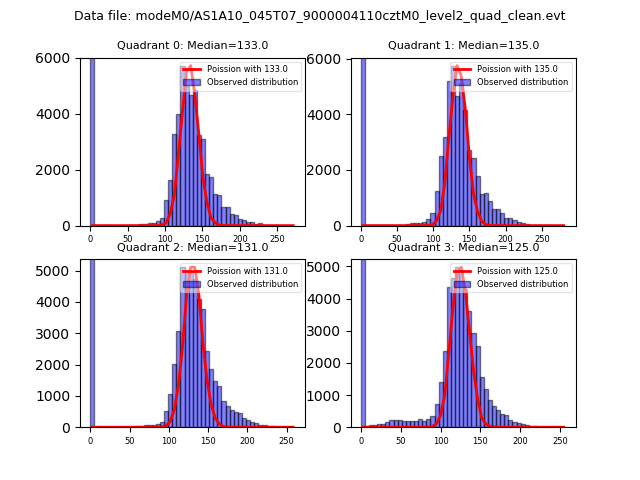 |
 |
| Quadrant-wise count rates Data is divided into 100 sec bins |
 |
|
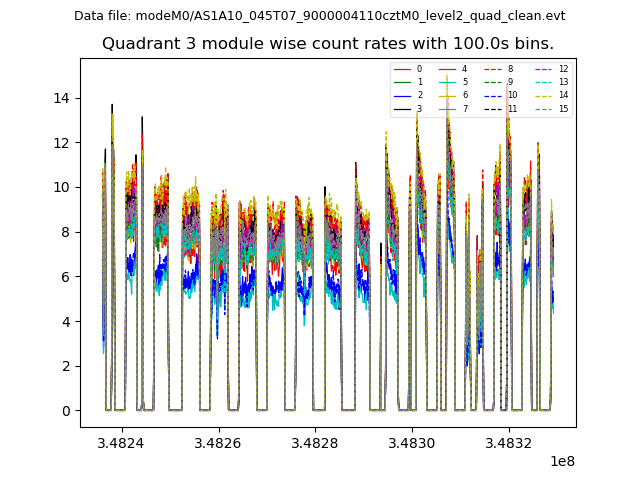
| Module-wise count rates for Quadrant A Data is divided into 100 sec bins |
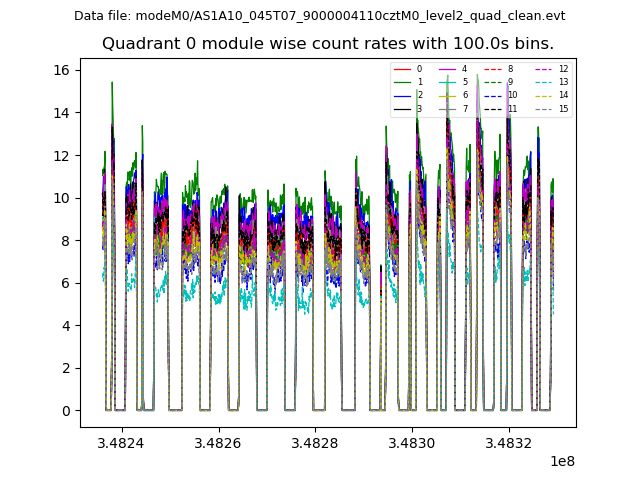 |
 |
| Module-wise count rates for Quadrant B Data is divided into 100 sec bins |
 |
 |
| Module-wise count rates for Quadrant C Data is divided into 100 sec bins |
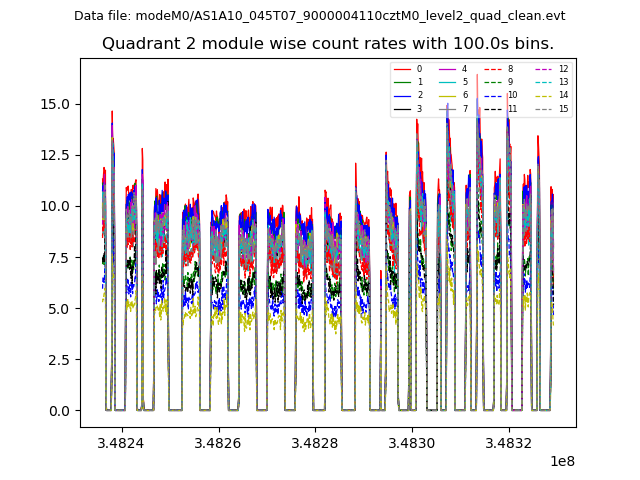 |
 |
| Module-wise count rates for Quadrant D Data is divided into 100 sec bins |
 |
 |
| Parameter | Plot |
|---|---|
| CZT HV Monitor | 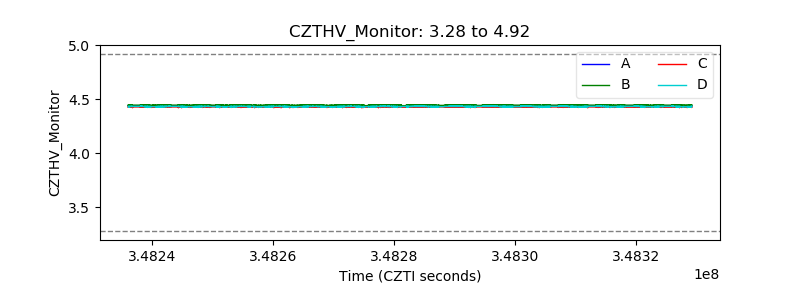 |
| D_VDD | 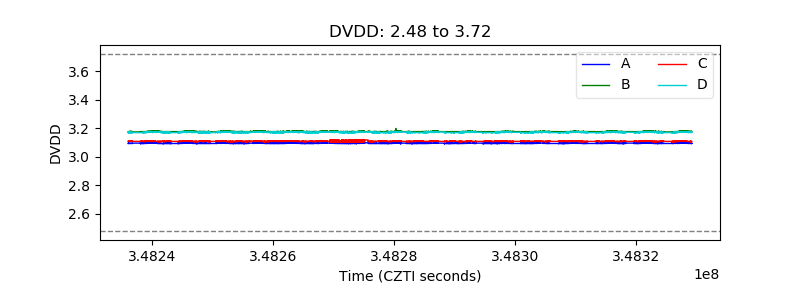 |
| Temperature 1 |  |
| Veto HV Monitor |  |
| Veto LLD | 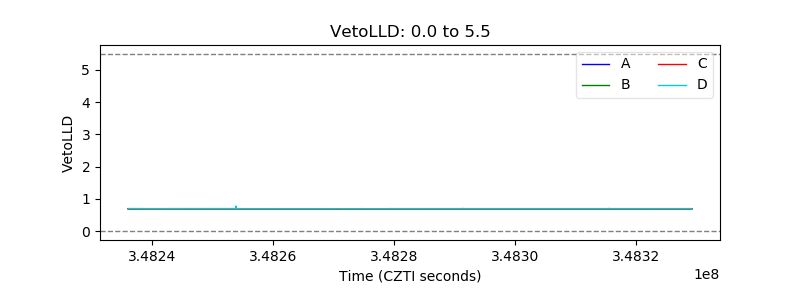 |
| Alpha Counter |  |
| _CPM_Rate | 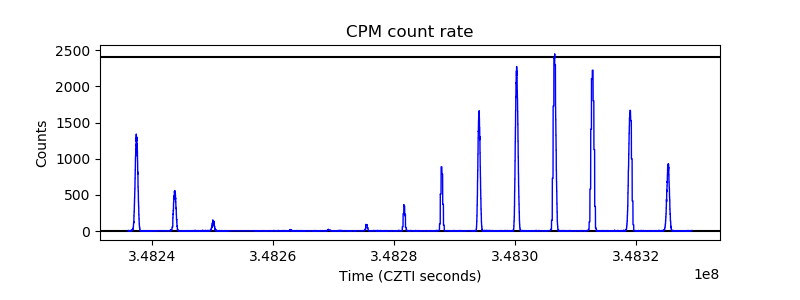 |
| CZT Counter |  |
| +2.5 Volts monitor | 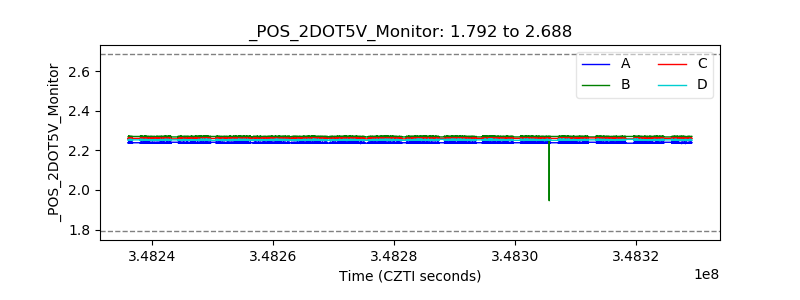 |
| +5 Volts monitor | 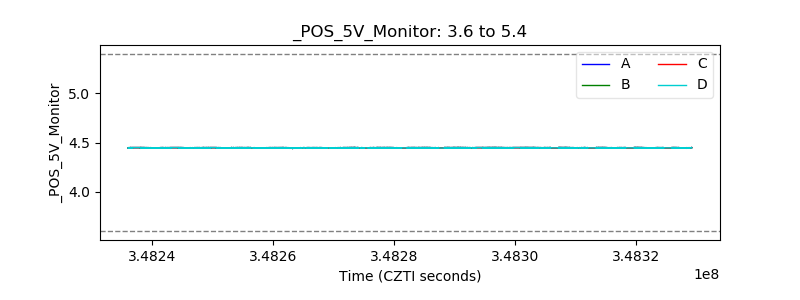 |
| _ROLL_ROT | 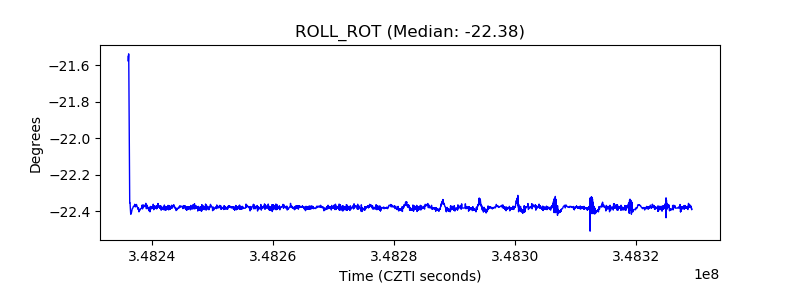 |
| _Roll_DEC | 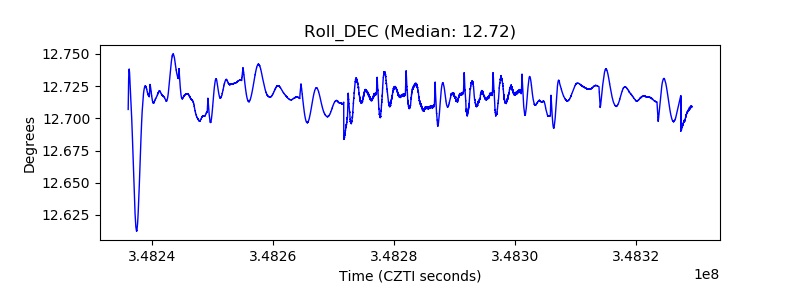 |
| _Roll_RA | 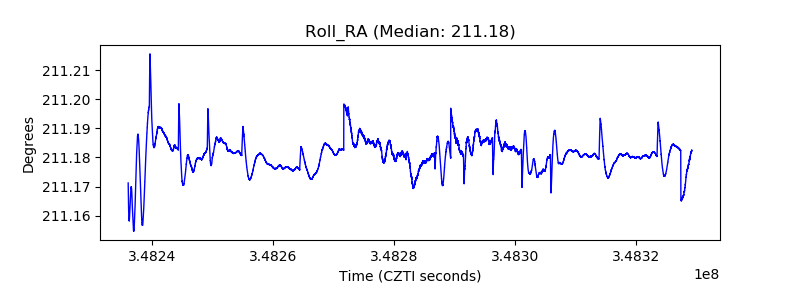 |
| Veto Counter | 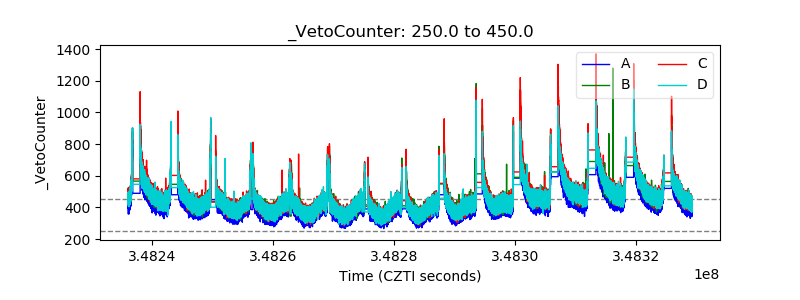 |