| Param | Original file | Final file |
|---|---|---|
| Filename | modeM0/AS1A10_045T07_9000004110_28634cztM0_level2.evt | modeM0/AS1A10_045T07_9000004110_28634cztM0_level2_quad_clean.evt |
| Size (bytes) | 567,025,920 | 73,500,480 |
| Size | 540.8 MB | 70.1 MB |
| Events in quadrant A | 3,712,809 | 434,640 |
| Events in quadrant B | 4,120,883 | 440,313 |
| Events in quadrant C | 3,681,720 | 430,533 |
| Events in quadrant D | 5,173,401 | 423,141 |
| Mode SS | |||
|---|---|---|---|
| Quadrant | BADHDUFLAG | Total packets | Discarded packets |
| A | 0 | 144 | 0 |
| B | 0 | 144 | 0 |
| C | 0 | 144 | 0 |
| D | 0 | 144 | 0 |
| Mode M9 | |||
|---|---|---|---|
| Quadrant | BADHDUFLAG | Total packets | Discarded packets |
| A | 0 | 10 | 0 |
| B | 0 | 11 | 0 |
| C | 0 | 11 | 0 |
| D | 0 | 11 | 0 |
| Mode M0 | |||
|---|---|---|---|
| Quadrant | BADHDUFLAG | Total packets | Discarded packets |
| A | 0 | 15329 | 1 |
| B | 0 | 16468 | 2 |
| C | 0 | 15108 | 1 |
| D | 0 | 20340 | 1 |
| Quadrant | Total seconds | Saturated seconds | Saturation percentage |
|---|---|---|---|
| A | 7138 | 146 | 2.045391% |
| B | 7137 | 288 | 4.035309% |
| C | 7137 | 174 | 2.437999% |
| D | 7137 | 220 | 3.082528% |
Noise dominated data is calculated using 1-second bins in cleaned event files. If a bin has >2000 counts, and if more than 50% of those come from <1% of pixels, then it is considered to be noise-dominated and hence unusable.
| Quadrant | # 1 sec bins | Bins with >0 counts | Bins with >2000 counts | High rate bins dominated by noise | Noise dominated (total time) | Noise dominated (detector-on time) | Marked lightcurve |
|---|---|---|---|---|---|---|---|
| A | 7948 | 7139 | 21 | 21 | 0.26% | 0.29% | 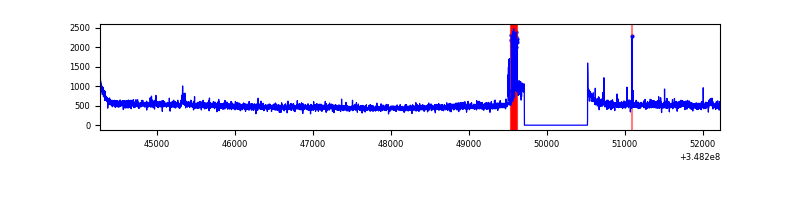 |
| B | 7947 | 7138 | 137 | 137 | 1.72% | 1.92% | 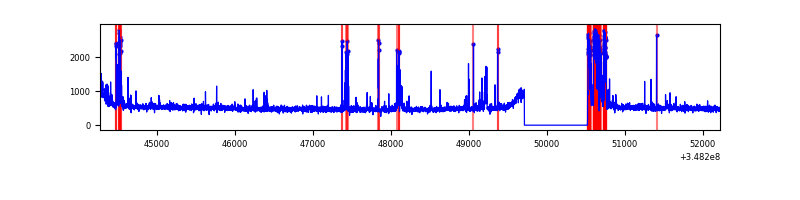 |
| C | 7947 | 7138 | 2 | 2 | 0.03% | 0.03% | 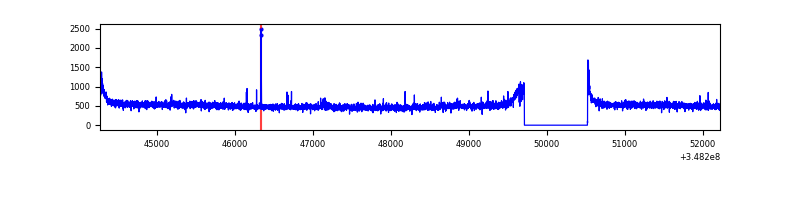 |
| D | 7947 | 7138 | 110 | 110 | 1.38% | 1.54% | 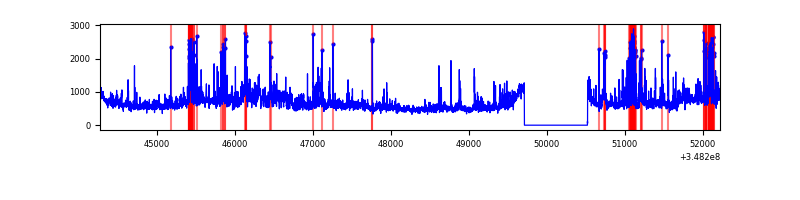 |
Top three noisy pixels from each quadrant. If the there are fewer than three noisy pixels in the level2.evt file, extra rows are filled as -1
| Pixel properties | Quadrant properties | ||||||
|---|---|---|---|---|---|---|---|
| Quadrant | DetID | PixID | Counts | Sigma | Mean | Median | Sigma |
| A | 15 | 174 | 133935 | 718.32 | 925 | 906 | 185.2 |
| A | 13 | 254 | 12521 | 62.72 | 925 | 906 | 185.2 |
| A | 3 | 137 | 8895 | 43.14 | 925 | 906 | 185.2 |
| B | 10 | 245 | 542589 | 3148.28 | 900 | 876 | 172.1 |
| B | 12 | 111 | 21378 | 119.15 | 900 | 876 | 172.1 |
| B | 11 | 111 | 19179 | 106.37 | 900 | 876 | 172.1 |
| C | 14 | 238 | 150492 | 711.89 | 891 | 897 | 210.1 |
| C | 0 | 10 | 27160 | 124.98 | 891 | 897 | 210.1 |
| C | 0 | 207 | 13873 | 61.75 | 891 | 897 | 210.1 |
| D | 8 | 195 | 868264 | 4074.6 | 899 | 878 | 212.9 |
| D | 1 | 52 | 589570 | 2765.42 | 899 | 878 | 212.9 |
| D | 2 | 250 | 157971 | 737.95 | 899 | 878 | 212.9 |
Histogram calculated using DETX and DETY for each event in the final _common_clean file
| Quadrant A |  |
 |
Quadrant B |
|---|---|---|---|
| Quadrant D |  |
 |
Quadrant C |
| Plot type | Count rate plots | Images |
|---|---|---|
| Comparison with Poisson distribution Blue bars denote a histogram of data divided into 1 sec bins. Red curve is a Poisson curve with rate = median count rate of data. |
 |
 |
| Quadrant-wise count rates Data is divided into 100 sec bins |
 |
|
| Module-wise count rates for Quadrant A Data is divided into 100 sec bins |
 |
 |
| Module-wise count rates for Quadrant B Data is divided into 100 sec bins |
 |
 |
| Module-wise count rates for Quadrant C Data is divided into 100 sec bins |
 |
 |
| Module-wise count rates for Quadrant D Data is divided into 100 sec bins |
 |
 |
| Parameter | Plot |
|---|---|
| CZT HV Monitor |  |
| D_VDD |  |
| Temperature 1 |  |
| Veto HV Monitor |  |
| Veto LLD |  |
| Alpha Counter |  |
| _CPM_Rate |  |
| CZT Counter |  |
| +2.5 Volts monitor |  |
| +5 Volts monitor |  |
| _ROLL_ROT |  |
| _Roll_DEC |  |
| _Roll_RA |  |
| Veto Counter |  |