| Param | Original file | Final file |
|---|---|---|
| Filename | modeM0/AS1A10_045T07_9000004110_28636cztM0_level2.evt | modeM0/AS1A10_045T07_9000004110_28636cztM0_level2_quad_clean.evt |
| Size (bytes) | 1,097,844,480 | 153,095,040 |
| Size | 1.0 GB | 146.0 MB |
| Events in quadrant A | 6,304,391 | 957,425 |
| Events in quadrant B | 7,030,137 | 961,197 |
| Events in quadrant C | 6,319,200 | 941,553 |
| Events in quadrant D | 12,730,029 | 891,164 |
| Mode SS | |||
|---|---|---|---|
| Quadrant | BADHDUFLAG | Total packets | Discarded packets |
| A | 0 | 258 | 0 |
| B | 0 | 258 | 0 |
| C | 0 | 258 | 0 |
| D | 0 | 258 | 0 |
| Mode M9 | |||
|---|---|---|---|
| Quadrant | BADHDUFLAG | Total packets | Discarded packets |
| A | 0 | 6 | 0 |
| B | 0 | 6 | 0 |
| C | 0 | 6 | 0 |
| D | 0 | 6 | 0 |
| Mode M0 | |||
|---|---|---|---|
| Quadrant | BADHDUFLAG | Total packets | Discarded packets |
| A | 0 | 26902 | 2 |
| B | 0 | 29074 | 2 |
| C | 0 | 26810 | 2 |
| D | 0 | 46782 | 2 |
| Quadrant | Total seconds | Saturated seconds | Saturation percentage |
|---|---|---|---|
| A | 12814 | 204 | 1.592009% |
| B | 12815 | 383 | 2.988685% |
| C | 12815 | 388 | 3.027702% |
| D | 12815 | 1486 | 11.595786% |
Noise dominated data is calculated using 1-second bins in cleaned event files. If a bin has >2000 counts, and if more than 50% of those come from <1% of pixels, then it is considered to be noise-dominated and hence unusable.
| Quadrant | # 1 sec bins | Bins with >0 counts | Bins with >2000 counts | High rate bins dominated by noise | Noise dominated (total time) | Noise dominated (detector-on time) | Marked lightcurve |
|---|---|---|---|---|---|---|---|
| A | 13354 | 12816 | 12 | 12 | 0.09% | 0.09% |  |
| B | 13355 | 12817 | 99 | 99 | 0.74% | 0.77% |  |
| C | 13355 | 12817 | 1 | 1 | 0.01% | 0.01% |  |
| D | 13355 | 12817 | 871 | 871 | 6.52% | 6.80% | 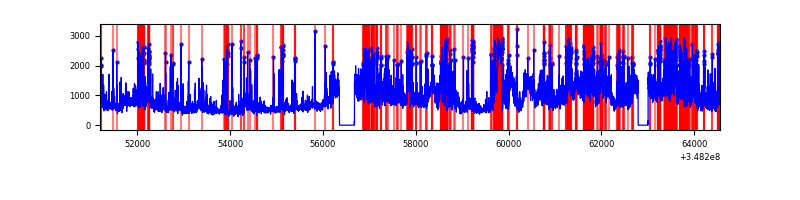 |
Top three noisy pixels from each quadrant. If the there are fewer than three noisy pixels in the level2.evt file, extra rows are filled as -1
| Pixel properties | Quadrant properties | ||||||
|---|---|---|---|---|---|---|---|
| Quadrant | DetID | PixID | Counts | Sigma | Mean | Median | Sigma |
| A | 5 | 98 | 47126 | 141.15 | 1599 | 1566 | 322.8 |
| A | 15 | 174 | 46033 | 137.76 | 1599 | 1566 | 322.8 |
| A | 13 | 6 | 23858 | 69.06 | 1599 | 1566 | 322.8 |
| B | 10 | 245 | 717640 | 2409.2 | 1565 | 1522 | 297.2 |
| B | 10 | 246 | 116526 | 386.9 | 1565 | 1522 | 297.2 |
| B | 12 | 111 | 37451 | 120.87 | 1565 | 1522 | 297.2 |
| C | 14 | 238 | 275289 | 764.71 | 1531 | 1545 | 358.0 |
| C | 14 | 254 | 45430 | 122.59 | 1531 | 1545 | 358.0 |
| C | 0 | 207 | 18517 | 47.41 | 1531 | 1545 | 358.0 |
| D | 1 | 52 | 2946045 | 8163.89 | 1496 | 1456 | 360.7 |
| D | 8 | 195 | 1758069 | 4870.22 | 1496 | 1456 | 360.7 |
| D | 13 | 104 | 1722644 | 4772.0 | 1496 | 1456 | 360.7 |
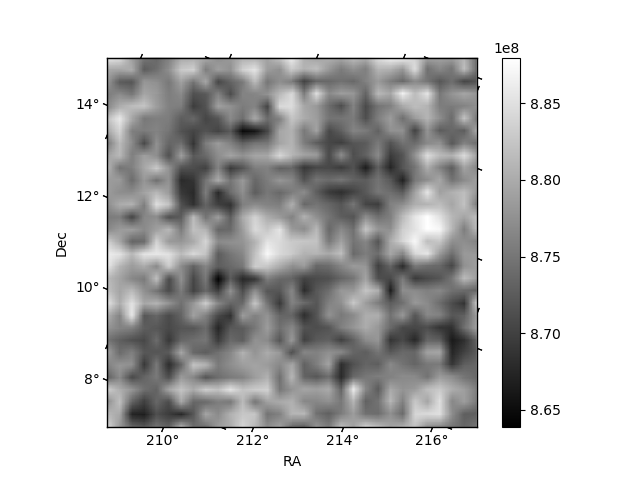
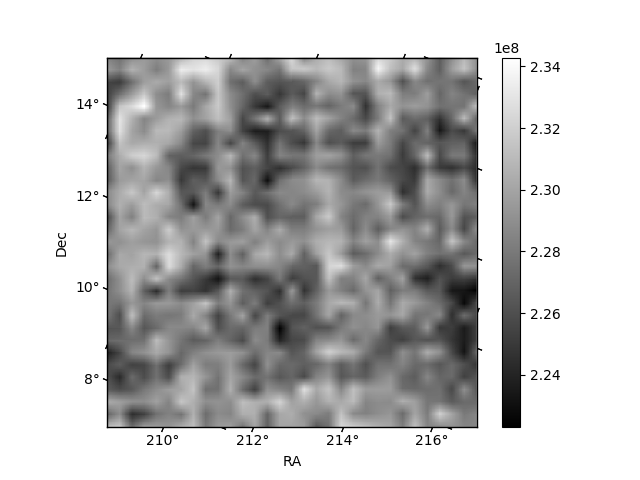
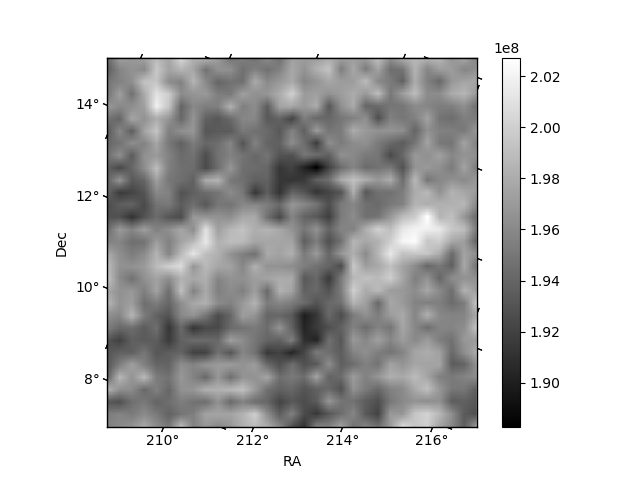
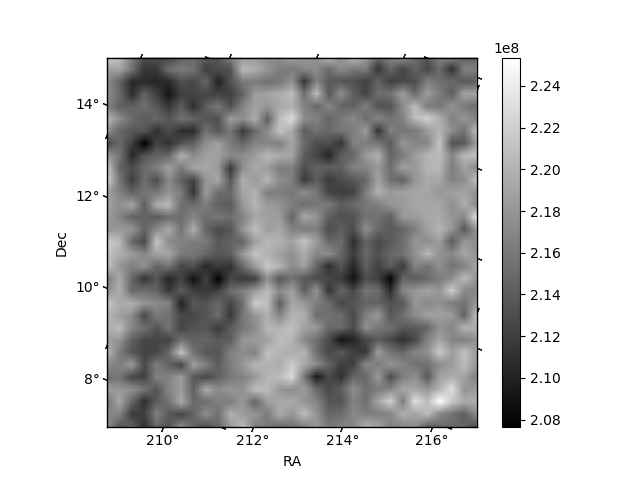
Histogram calculated using DETX and DETY for each event in the final _common_clean file
| Quadrant A | 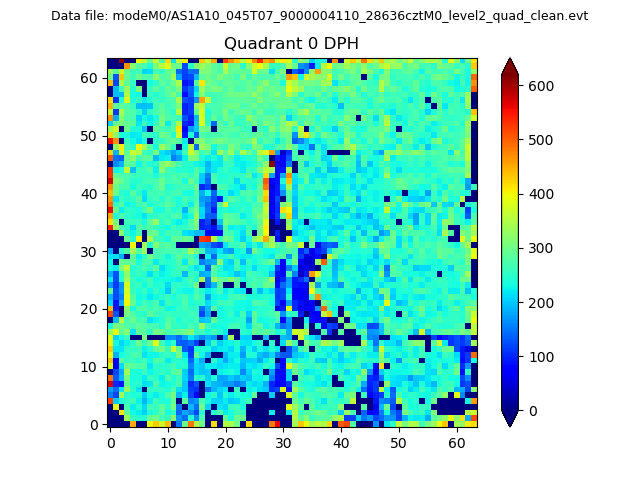 |
 |
Quadrant B |
|---|---|---|---|
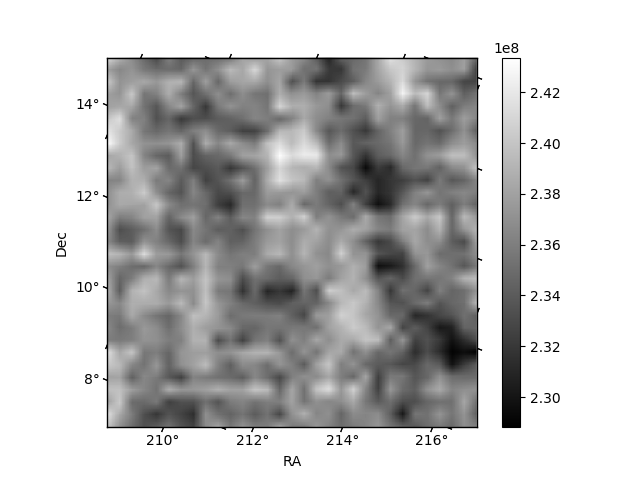
| Quadrant D | 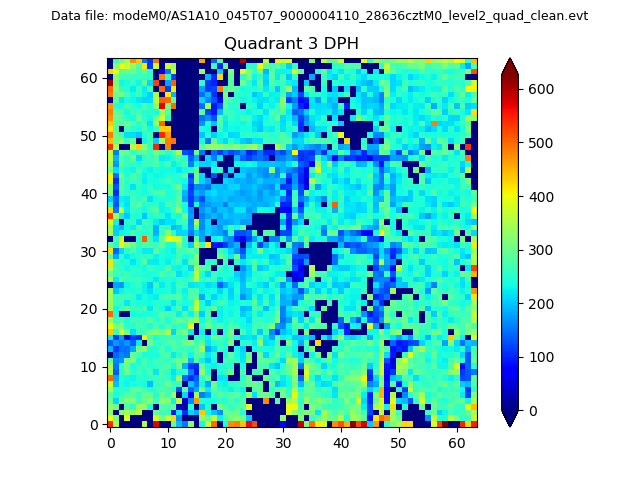 |
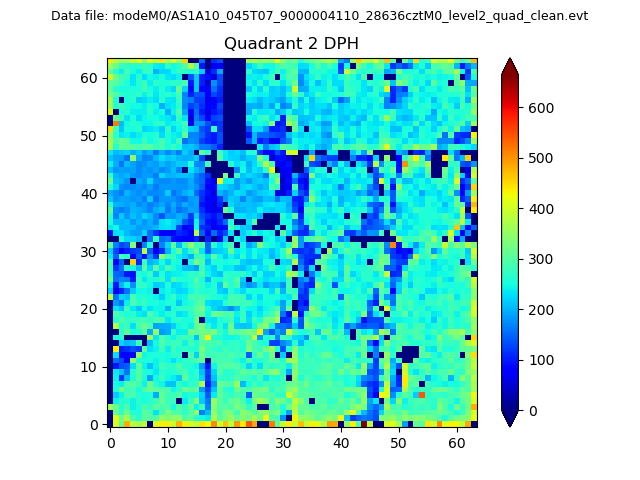 |
Quadrant C |
| Plot type | Count rate plots | Images |
|---|---|---|
| Comparison with Poisson distribution Blue bars denote a histogram of data divided into 1 sec bins. Red curve is a Poisson curve with rate = median count rate of data. |
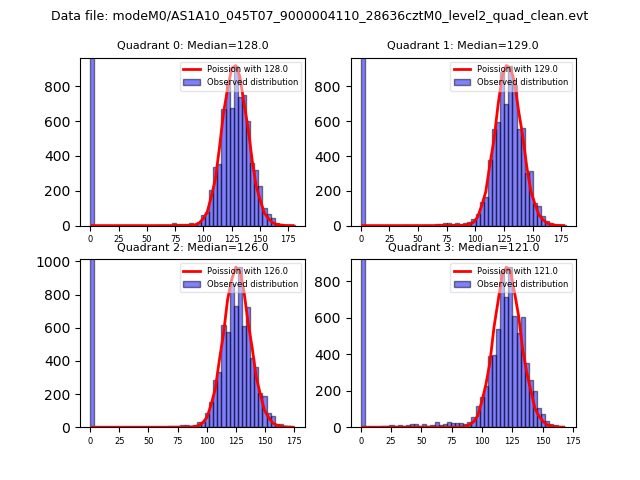 |
 |
| Quadrant-wise count rates Data is divided into 100 sec bins |
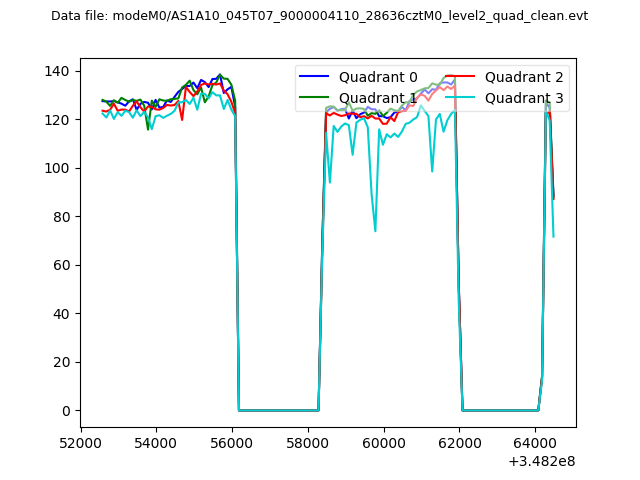 |
|
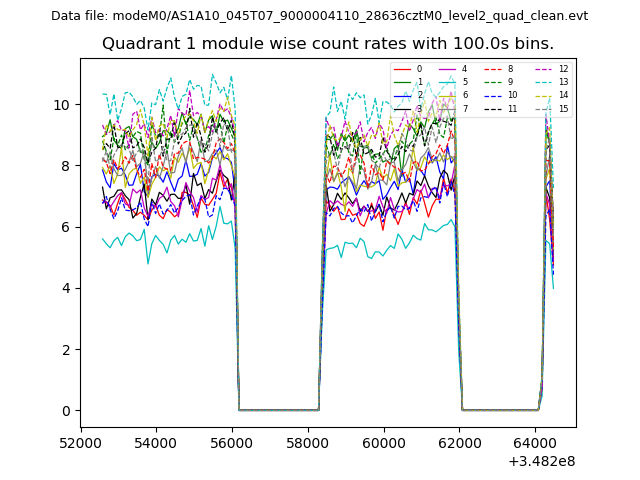
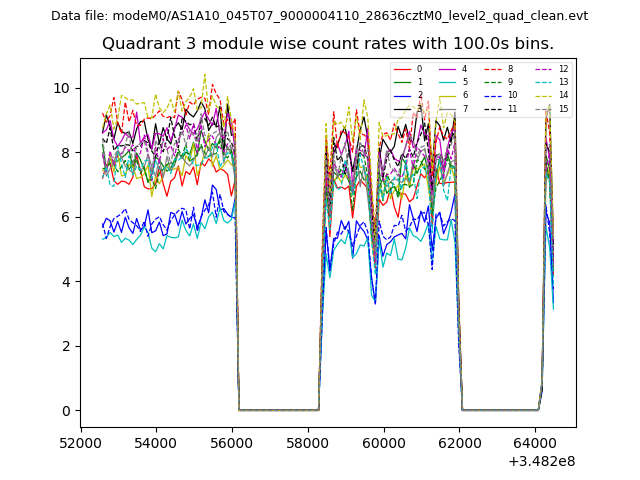
| Module-wise count rates for Quadrant A Data is divided into 100 sec bins |
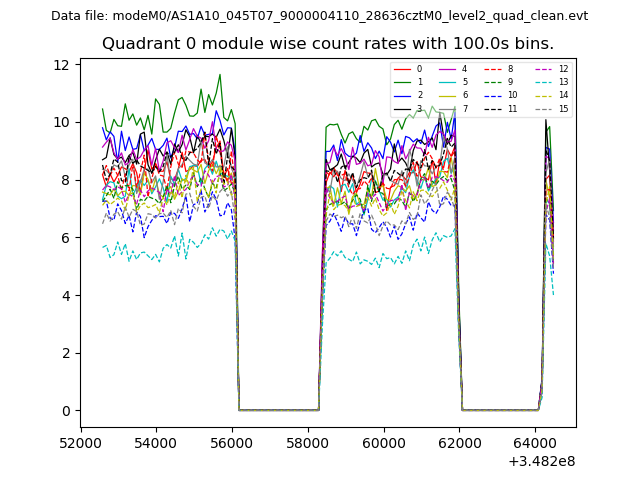 |
 |
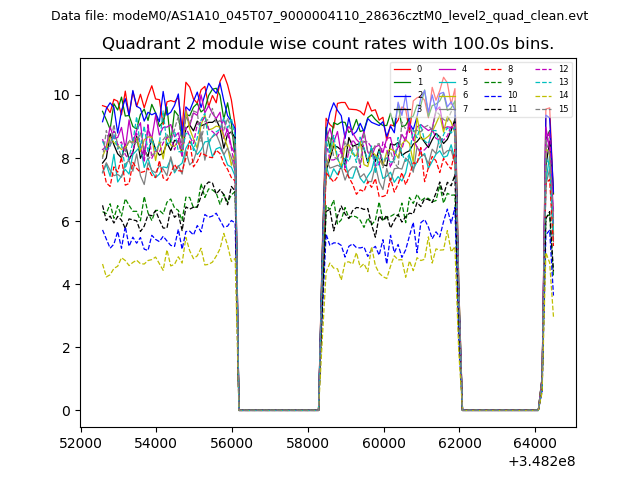
| Module-wise count rates for Quadrant B Data is divided into 100 sec bins |
 |
 |
| Module-wise count rates for Quadrant C Data is divided into 100 sec bins |
 |
 |
| Module-wise count rates for Quadrant D Data is divided into 100 sec bins |
 |
 |
| Parameter | Plot |
|---|---|
| CZT HV Monitor | 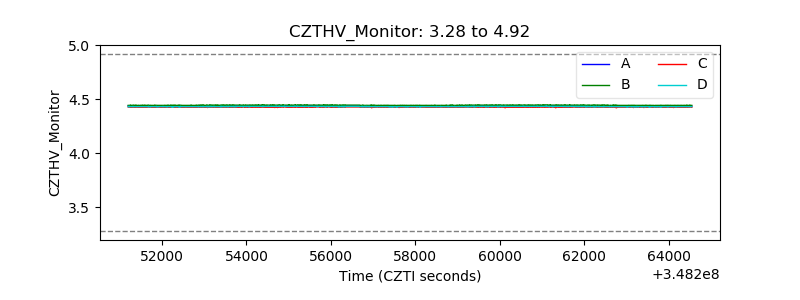 |
| D_VDD | 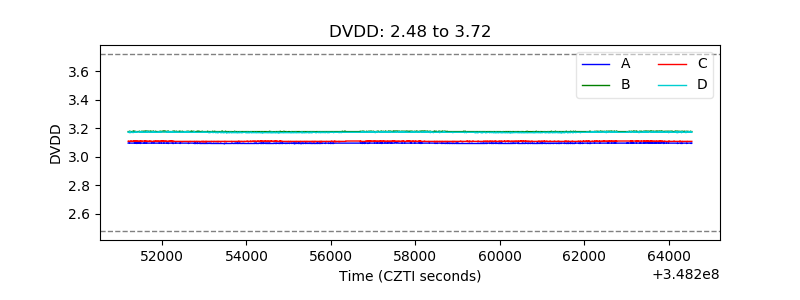 |
| Temperature 1 | 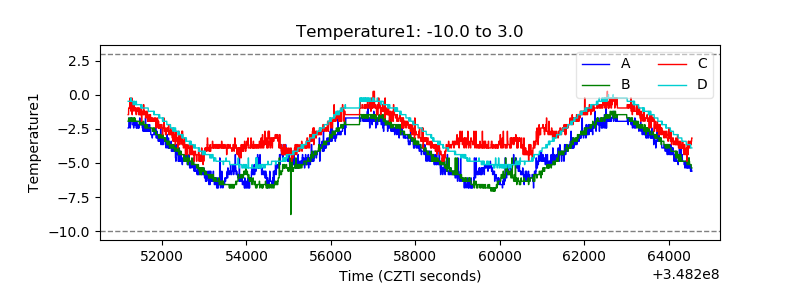 |
| Veto HV Monitor | 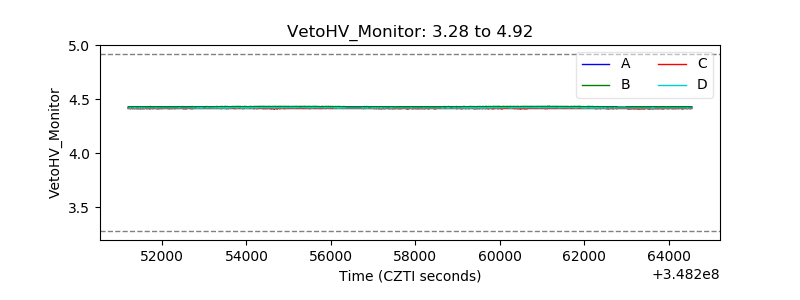 |
| Veto LLD | 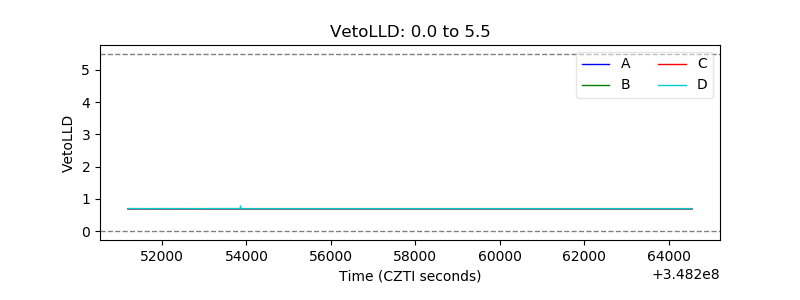 |
| Alpha Counter | 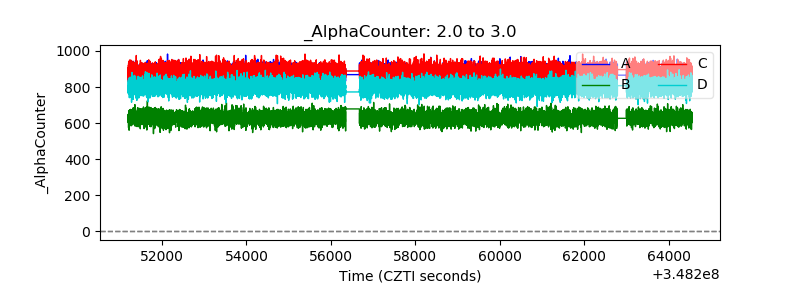 |
| _CPM_Rate | 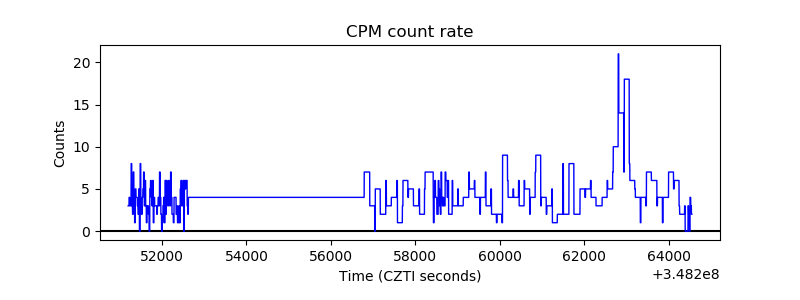 |
| CZT Counter | 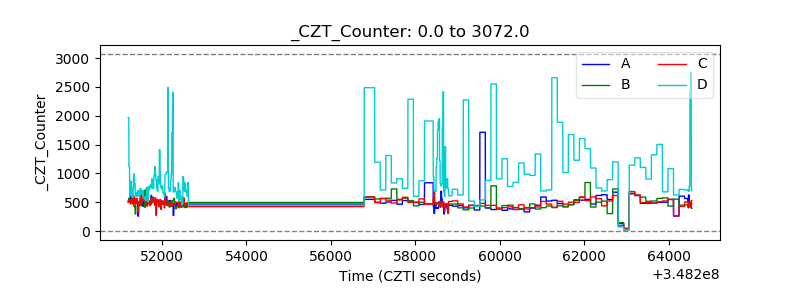 |
| +2.5 Volts monitor |  |
| +5 Volts monitor |  |
| _ROLL_ROT | 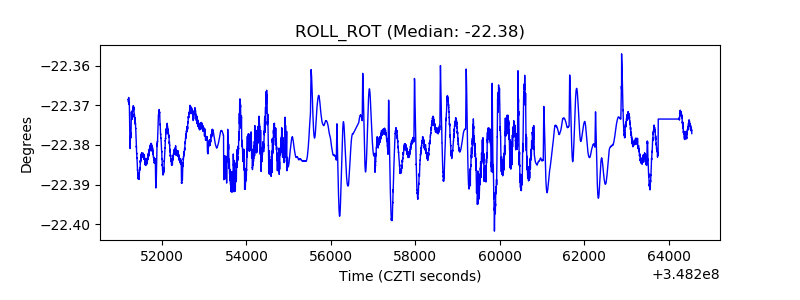 |
| _Roll_DEC | 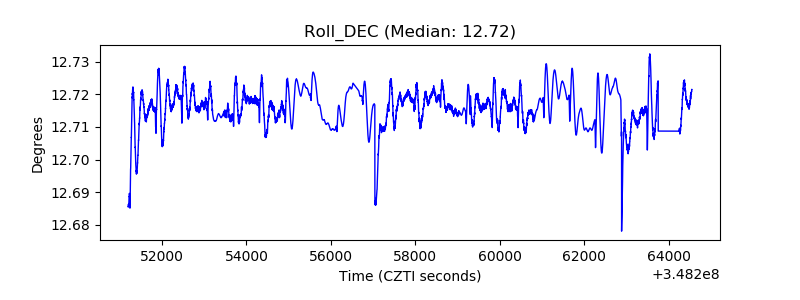 |
| _Roll_RA | 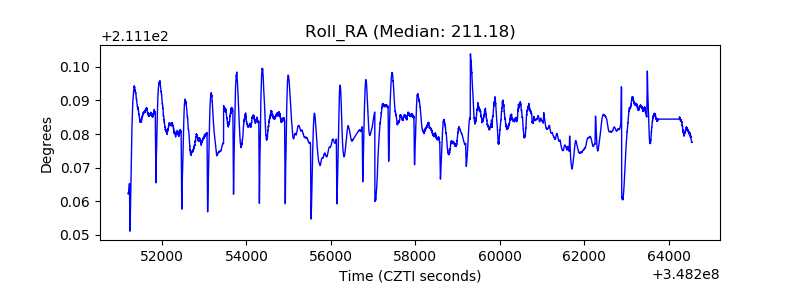 |
| Veto Counter | 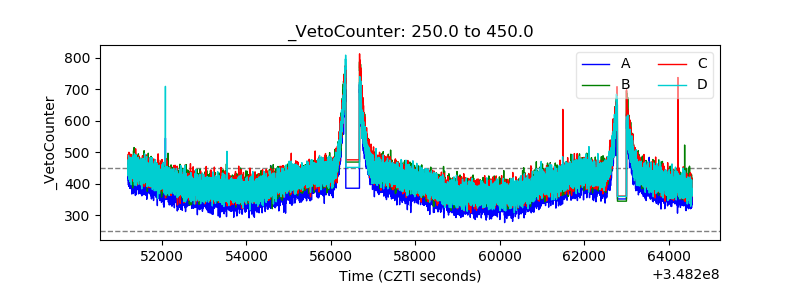 |