| Param | Original file | Final file |
|---|---|---|
| Filename | modeM0/AS1A10_045T07_9000004110_28640cztM0_level2.evt | modeM0/AS1A10_045T07_9000004110_28640cztM0_level2_quad_clean.evt |
| Size (bytes) | 869,279,040 | 139,556,160 |
| Size | 829.0 MB | 133.1 MB |
| Events in quadrant A | 5,246,961 | 885,621 |
| Events in quadrant B | 6,636,822 | 877,912 |
| Events in quadrant C | 5,235,817 | 871,025 |
| Events in quadrant D | 8,471,192 | 839,070 |
| Mode SS | |||
|---|---|---|---|
| Quadrant | BADHDUFLAG | Total packets | Discarded packets |
| A | 0 | 220 | 0 |
| B | 0 | 220 | 0 |
| C | 0 | 220 | 0 |
| D | 0 | 220 | 0 |
| Mode M9 | |||
|---|---|---|---|
| Quadrant | BADHDUFLAG | Total packets | Discarded packets |
| A | 0 | 9 | 0 |
| B | 0 | 9 | 0 |
| C | 0 | 9 | 0 |
| D | 0 | 9 | 0 |
| Mode M0 | |||
|---|---|---|---|
| Quadrant | BADHDUFLAG | Total packets | Discarded packets |
| A | 0 | 22901 | 2 |
| B | 0 | 27084 | 2 |
| C | 0 | 22564 | 2 |
| D | 0 | 32843 | 2 |
| Quadrant | Total seconds | Saturated seconds | Saturation percentage |
|---|---|---|---|
| A | 10880 | 138 | 1.268382% |
| B | 10880 | 580 | 5.330882% |
| C | 10880 | 256 | 2.352941% |
| D | 10880 | 531 | 4.880515% |
Noise dominated data is calculated using 1-second bins in cleaned event files. If a bin has >2000 counts, and if more than 50% of those come from <1% of pixels, then it is considered to be noise-dominated and hence unusable.
| Quadrant | # 1 sec bins | Bins with >0 counts | Bins with >2000 counts | High rate bins dominated by noise | Noise dominated (total time) | Noise dominated (detector-on time) | Marked lightcurve |
|---|---|---|---|---|---|---|---|
| A | 11730 | 10883 | 35 | 35 | 0.30% | 0.32% | 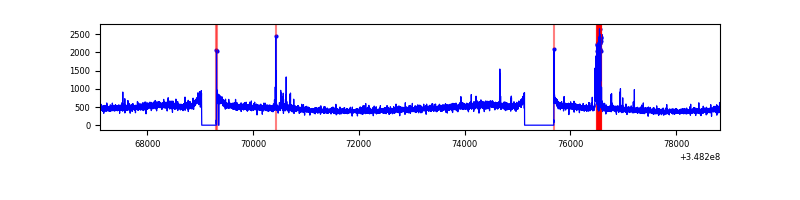 |
| B | 11730 | 10883 | 273 | 273 | 2.33% | 2.51% | 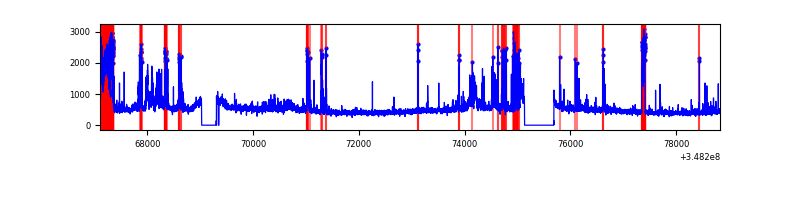 |
| C | 11730 | 10883 | 1 | 1 | 0.01% | 0.01% | 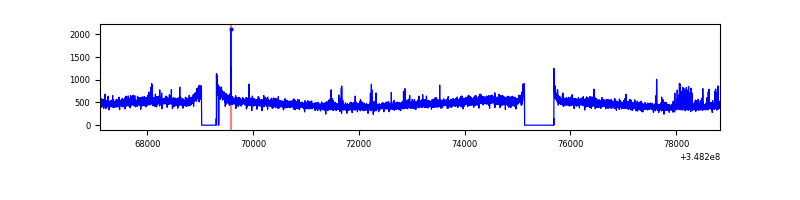 |
| D | 11730 | 10883 | 346 | 346 | 2.95% | 3.18% | 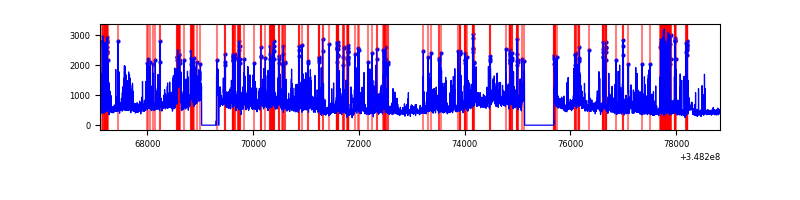 |
Top three noisy pixels from each quadrant. If the there are fewer than three noisy pixels in the level2.evt file, extra rows are filled as -1
| Pixel properties | Quadrant properties | ||||||
|---|---|---|---|---|---|---|---|
| Quadrant | DetID | PixID | Counts | Sigma | Mean | Median | Sigma |
| A | 15 | 174 | 158906 | 591.15 | 1315 | 1288 | 266.6 |
| A | 13 | 254 | 20019 | 70.25 | 1315 | 1288 | 266.6 |
| A | 3 | 137 | 13052 | 44.12 | 1315 | 1288 | 266.6 |
| B | 10 | 245 | 1301783 | 5259.4 | 1282 | 1249 | 247.3 |
| B | 10 | 246 | 245905 | 989.4 | 1282 | 1249 | 247.3 |
| B | 12 | 111 | 30971 | 120.2 | 1282 | 1249 | 247.3 |
| C | 14 | 238 | 238241 | 801.49 | 1259 | 1265 | 295.7 |
| C | 14 | 254 | 52652 | 173.8 | 1259 | 1265 | 295.7 |
| C | 8 | 128 | 11512 | 34.66 | 1259 | 1265 | 295.7 |
| D | 1 | 52 | 2765951 | 9397.41 | 1251 | 1219 | 294.2 |
| D | 8 | 195 | 562884 | 1909.12 | 1251 | 1219 | 294.2 |
| D | 2 | 250 | 122122 | 410.95 | 1251 | 1219 | 294.2 |
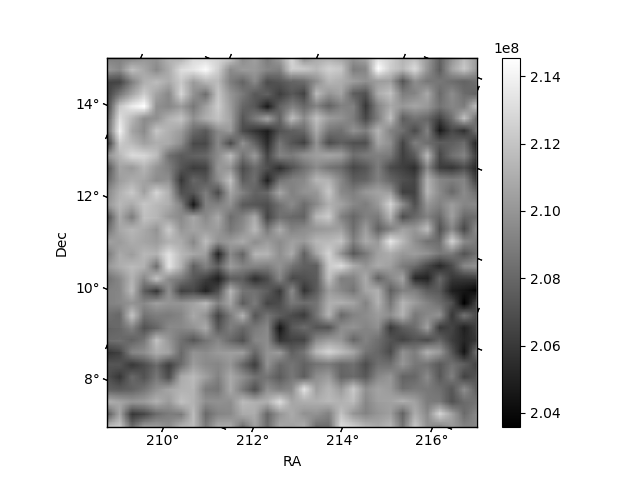
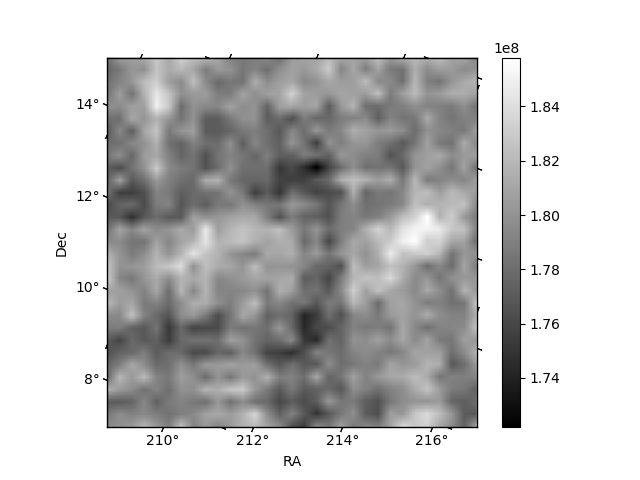
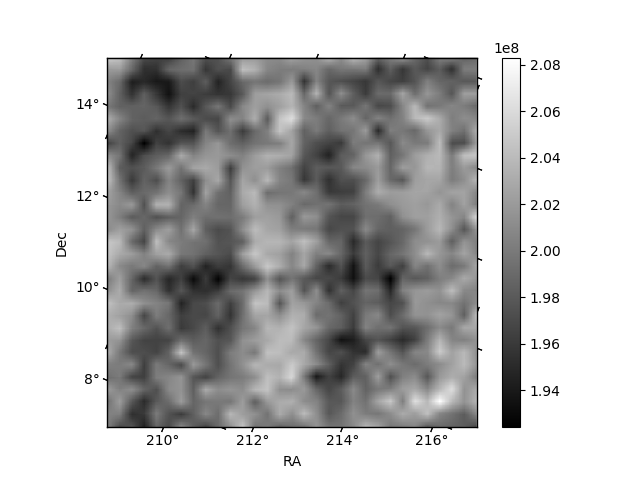
Histogram calculated using DETX and DETY for each event in the final _common_clean file
| Quadrant A |  |
 |
Quadrant B |
|---|---|---|---|
| Quadrant D |  |
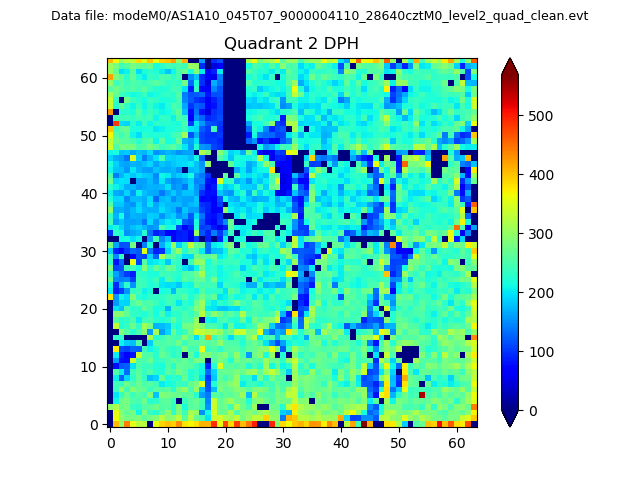 |
Quadrant C |
| Plot type | Count rate plots | Images |
|---|---|---|
| Comparison with Poisson distribution Blue bars denote a histogram of data divided into 1 sec bins. Red curve is a Poisson curve with rate = median count rate of data. |
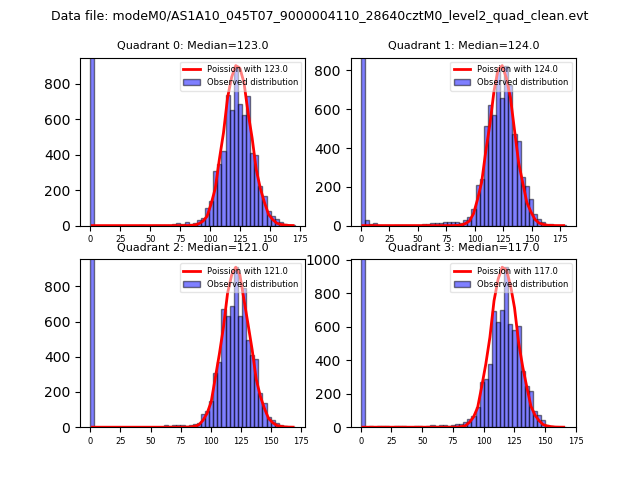 |
 |
| Quadrant-wise count rates Data is divided into 100 sec bins |
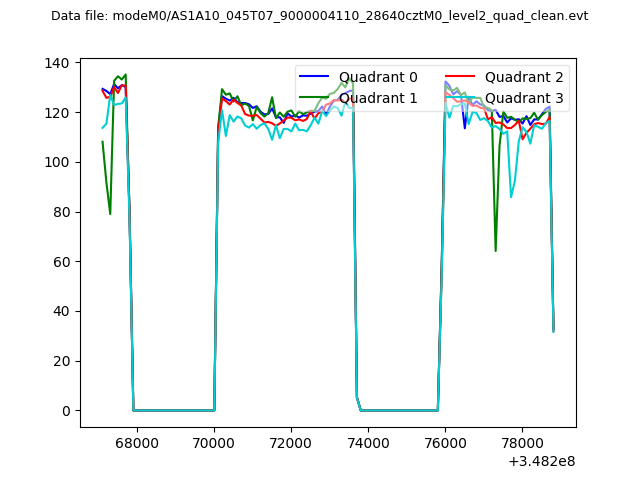 |
|
| Module-wise count rates for Quadrant A Data is divided into 100 sec bins |
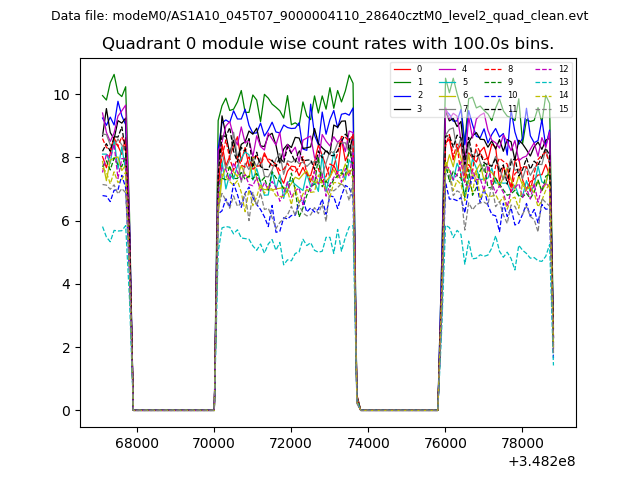 |
 |
| Module-wise count rates for Quadrant B Data is divided into 100 sec bins |
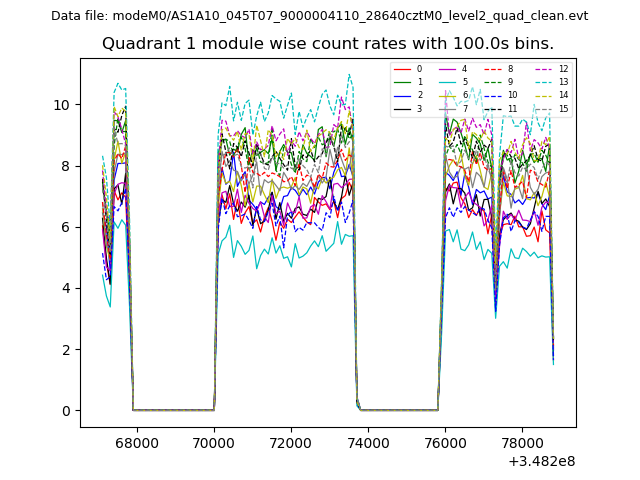 |
 |
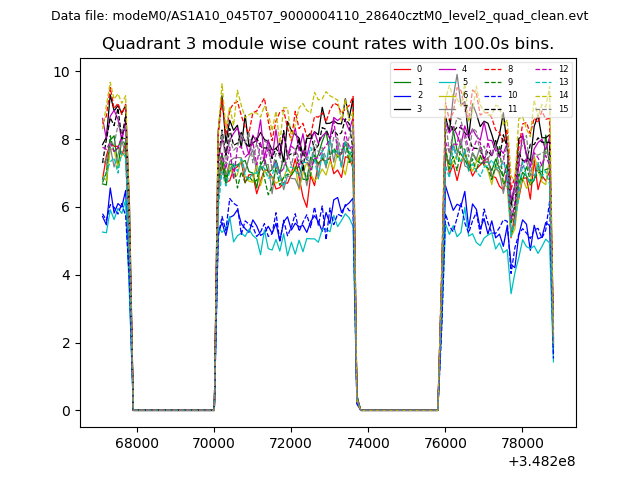
| Module-wise count rates for Quadrant C Data is divided into 100 sec bins |
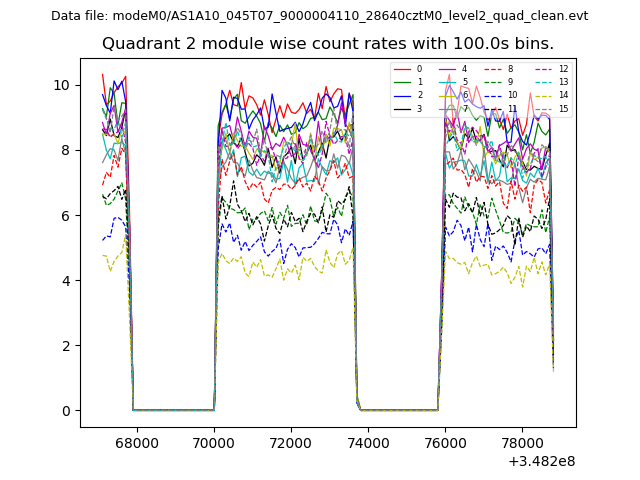 |
 |
| Module-wise count rates for Quadrant D Data is divided into 100 sec bins |
 |
 |
| Parameter | Plot |
|---|---|
| CZT HV Monitor | 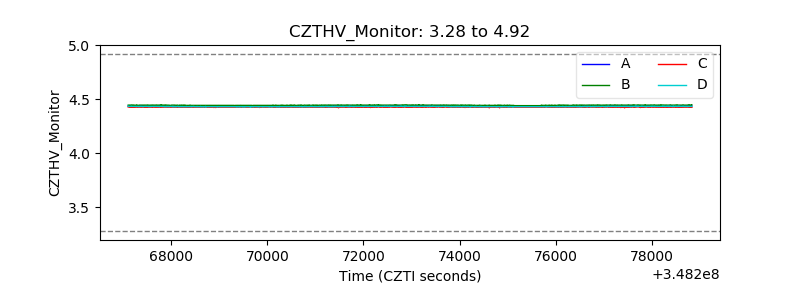 |
| D_VDD | 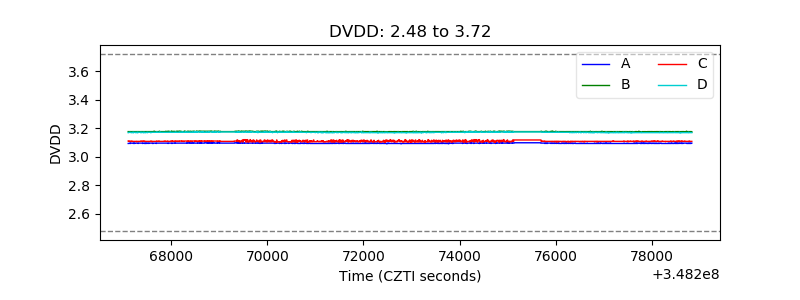 |
| Temperature 1 | 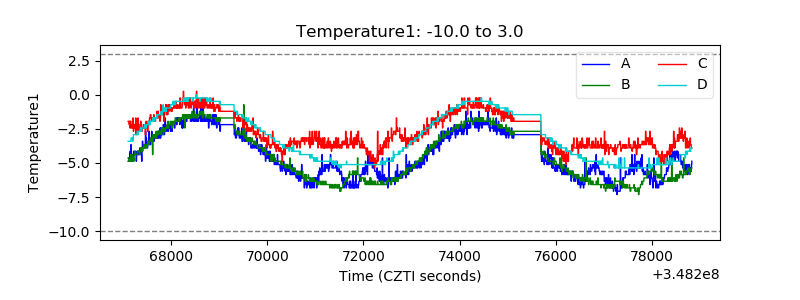 |
| Veto HV Monitor | 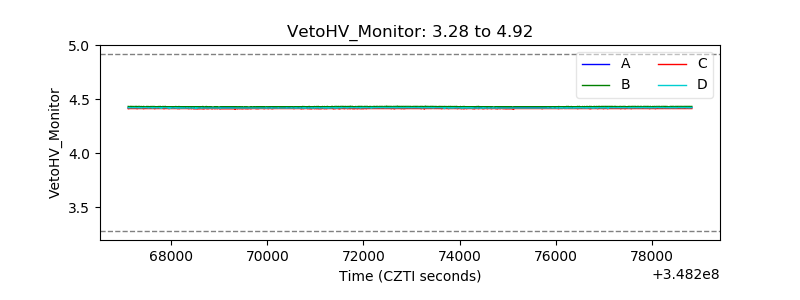 |
| Veto LLD | 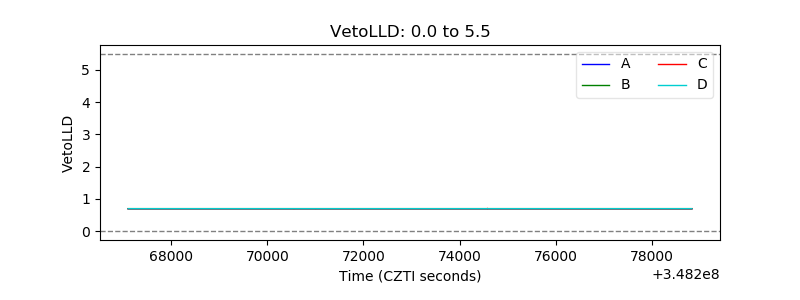 |
| Alpha Counter | 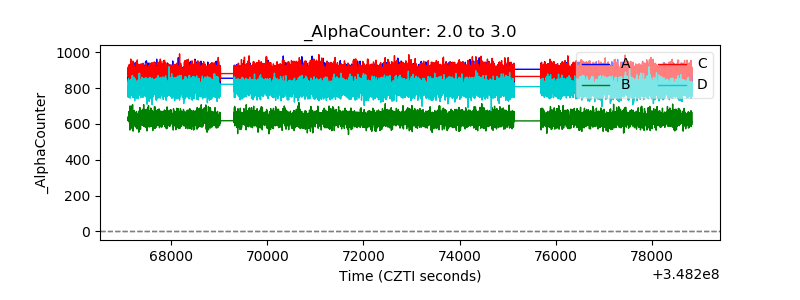 |
| _CPM_Rate | 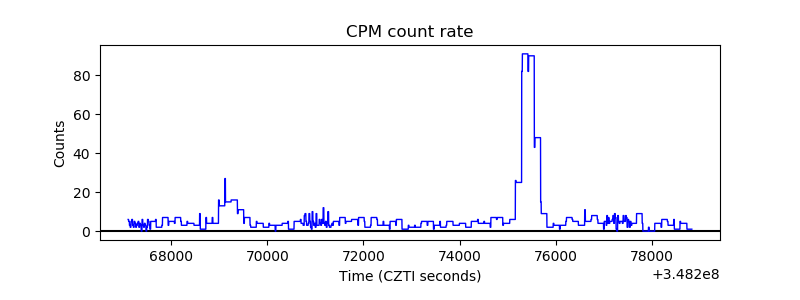 |
| CZT Counter | 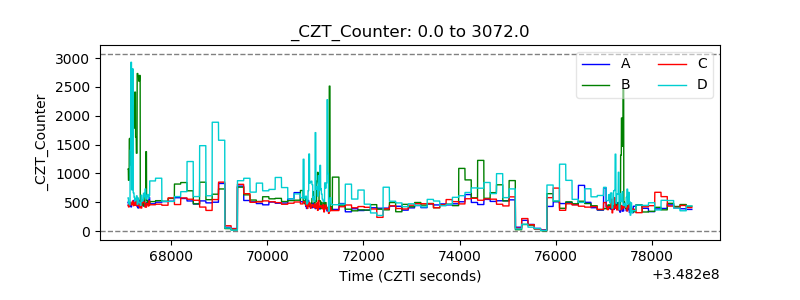 |
| +2.5 Volts monitor |  |
| +5 Volts monitor |  |
| _ROLL_ROT | 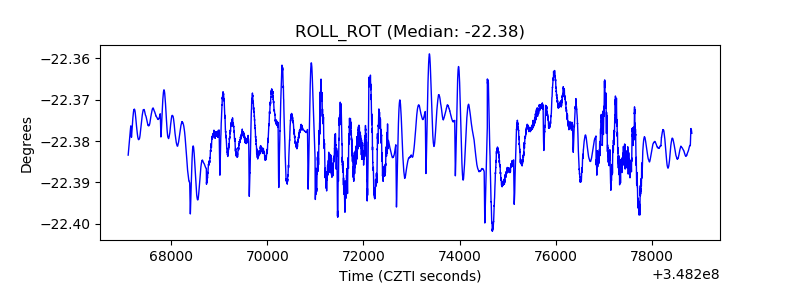 |
| _Roll_DEC | 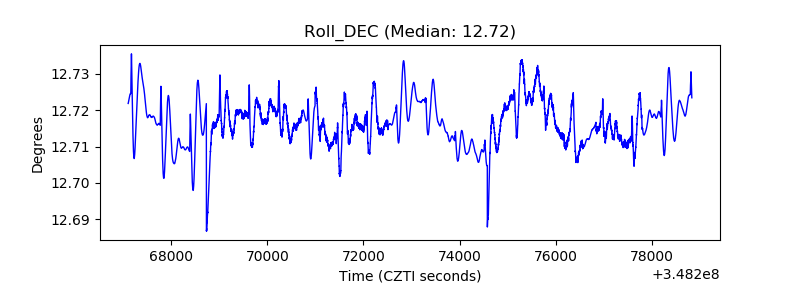 |
| _Roll_RA | 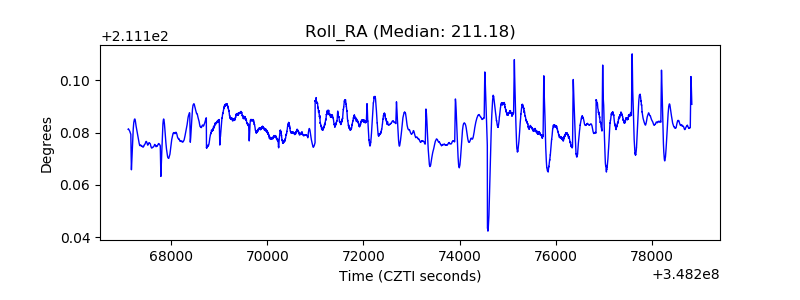 |
| Veto Counter | 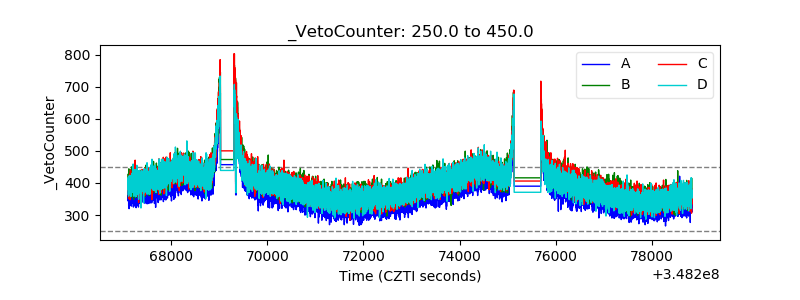 |