| Param | Original file | Final file |
|---|---|---|
| Filename | modeM0/AS1A10_045T07_9000004110_28641cztM0_level2.evt | modeM0/AS1A10_045T07_9000004110_28641cztM0_level2_quad_clean.evt |
| Size (bytes) | 1,130,330,880 | 180,072,000 |
| Size | 1.1 GB | 171.7 MB |
| Events in quadrant A | 7,196,729 | 1,122,718 |
| Events in quadrant B | 7,866,419 | 1,138,040 |
| Events in quadrant C | 7,099,563 | 1,103,410 |
| Events in quadrant D | 11,073,512 | 1,071,894 |
| Mode SS | |||
|---|---|---|---|
| Quadrant | BADHDUFLAG | Total packets | Discarded packets |
| A | 0 | 300 | 0 |
| B | 0 | 300 | 0 |
| C | 0 | 300 | 0 |
| D | 0 | 300 | 0 |
| Mode M9 | |||
|---|---|---|---|
| Quadrant | BADHDUFLAG | Total packets | Discarded packets |
| A | 0 | 26 | 0 |
| B | 0 | 26 | 0 |
| C | 0 | 26 | 0 |
| D | 0 | 26 | 0 |
| Mode M0 | |||
|---|---|---|---|
| Quadrant | BADHDUFLAG | Total packets | Discarded packets |
| A | 0 | 30956 | 3 |
| B | 0 | 32866 | 3 |
| C | 0 | 30487 | 3 |
| D | 0 | 42927 | 3 |
| Quadrant | Total seconds | Saturated seconds | Saturation percentage |
|---|---|---|---|
| A | 14743 | 138 | 0.936037% |
| B | 14743 | 287 | 1.946687% |
| C | 14744 | 227 | 1.539609% |
| D | 14744 | 627 | 4.252577% |
Noise dominated data is calculated using 1-second bins in cleaned event files. If a bin has >2000 counts, and if more than 50% of those come from <1% of pixels, then it is considered to be noise-dominated and hence unusable.
| Quadrant | # 1 sec bins | Bins with >0 counts | Bins with >2000 counts | High rate bins dominated by noise | Noise dominated (total time) | Noise dominated (detector-on time) | Marked lightcurve |
|---|---|---|---|---|---|---|---|
| A | 17328 | 14746 | 37 | 37 | 0.21% | 0.25% | 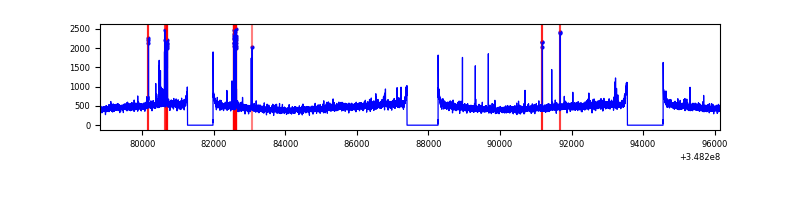 |
| B | 17328 | 14746 | 109 | 109 | 0.63% | 0.74% | 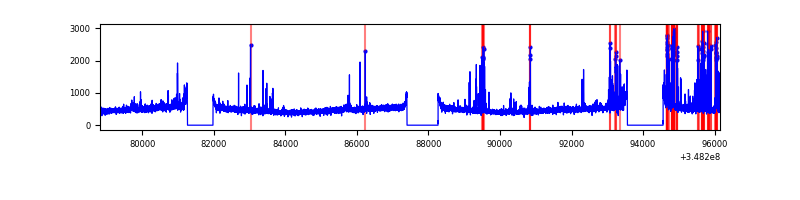 |
| C | 17329 | 14747 | 0 | 0 | 0.00% | 0.00% | 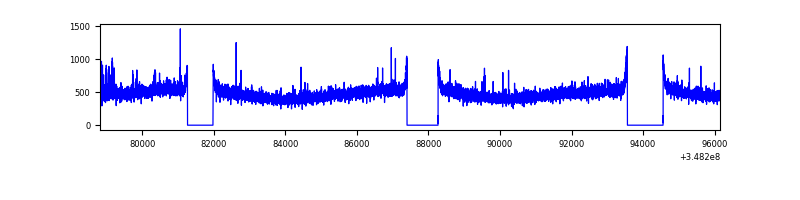 |
| D | 17329 | 14747 | 474 | 474 | 2.74% | 3.21% | 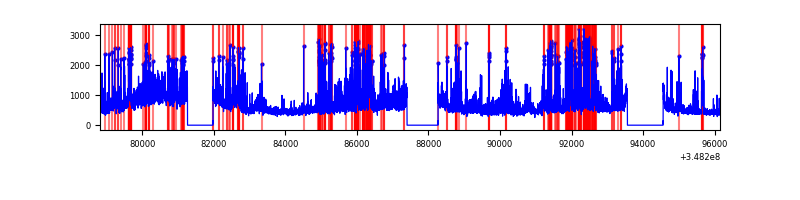 |
Top three noisy pixels from each quadrant. If the there are fewer than three noisy pixels in the level2.evt file, extra rows are filled as -1
| Pixel properties | Quadrant properties | ||||||
|---|---|---|---|---|---|---|---|
| Quadrant | DetID | PixID | Counts | Sigma | Mean | Median | Sigma |
| A | 15 | 174 | 179347 | 490.29 | 1804 | 1765 | 362.2 |
| A | 15 | 47 | 43729 | 115.86 | 1804 | 1765 | 362.2 |
| A | 13 | 254 | 25247 | 64.83 | 1804 | 1765 | 362.2 |
| B | 10 | 245 | 775306 | 2250.96 | 1780 | 1733 | 343.7 |
| B | 10 | 246 | 57422 | 162.05 | 1780 | 1733 | 343.7 |
| B | 12 | 111 | 43020 | 120.14 | 1780 | 1733 | 343.7 |
| C | 14 | 238 | 308508 | 760.44 | 1727 | 1736 | 403.4 |
| C | 14 | 254 | 47703 | 113.94 | 1727 | 1736 | 403.4 |
| C | 13 | 61 | 11895 | 25.18 | 1727 | 1736 | 403.4 |
| D | 1 | 52 | 3086800 | 7523.25 | 1723 | 1677 | 410.1 |
| D | 8 | 195 | 922195 | 2244.74 | 1723 | 1677 | 410.1 |
| D | 12 | 233 | 316837 | 768.54 | 1723 | 1677 | 410.1 |
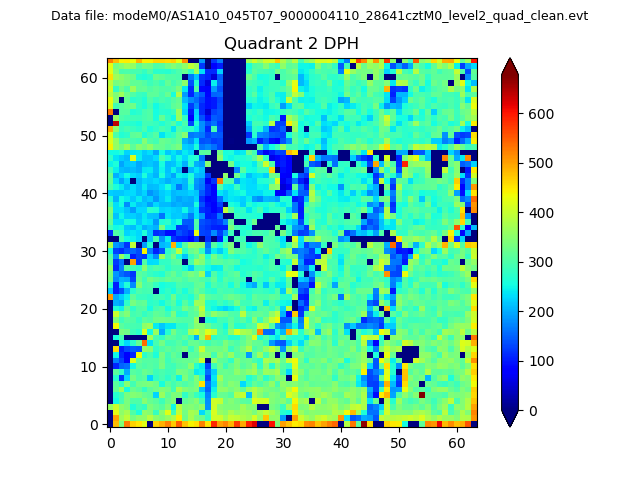
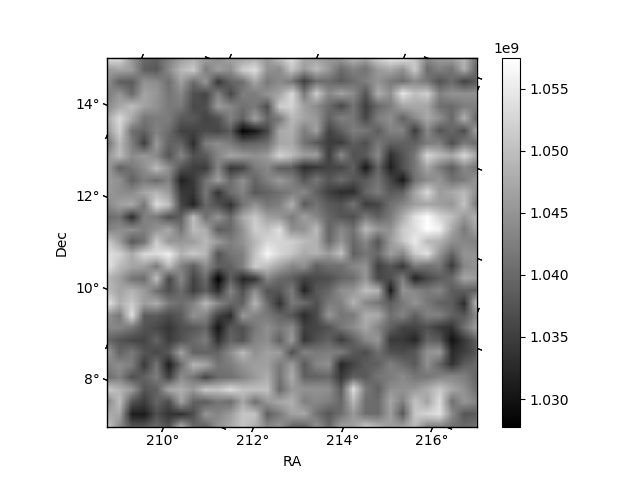
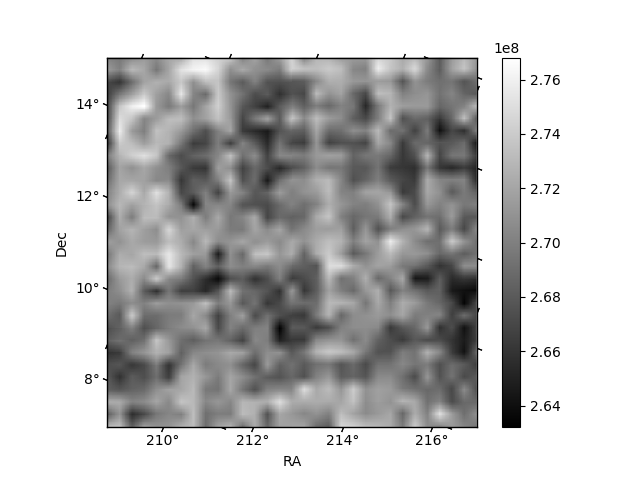
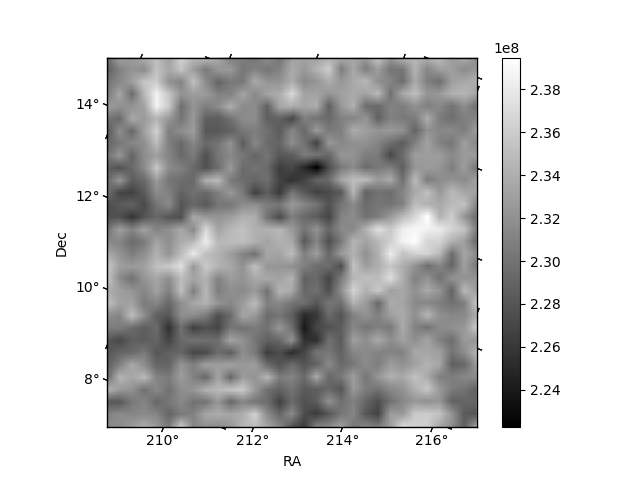
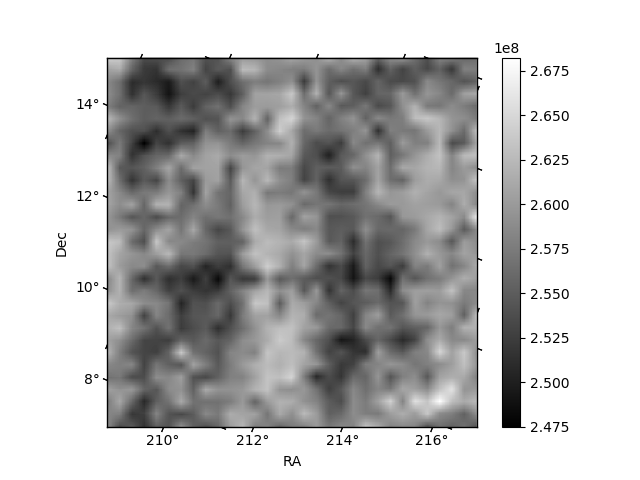
Histogram calculated using DETX and DETY for each event in the final _common_clean file
| Quadrant A | 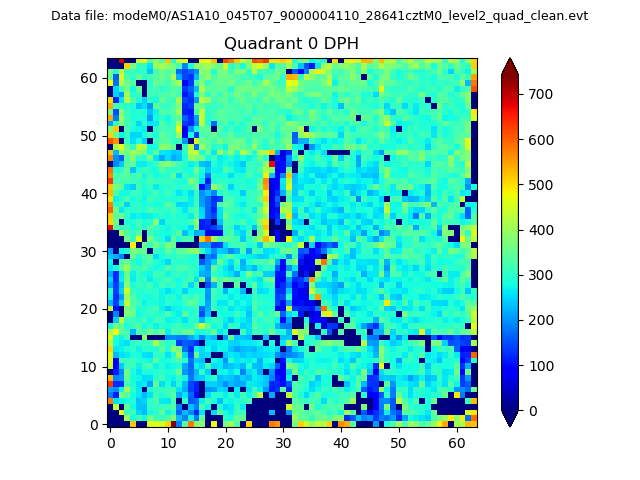 |
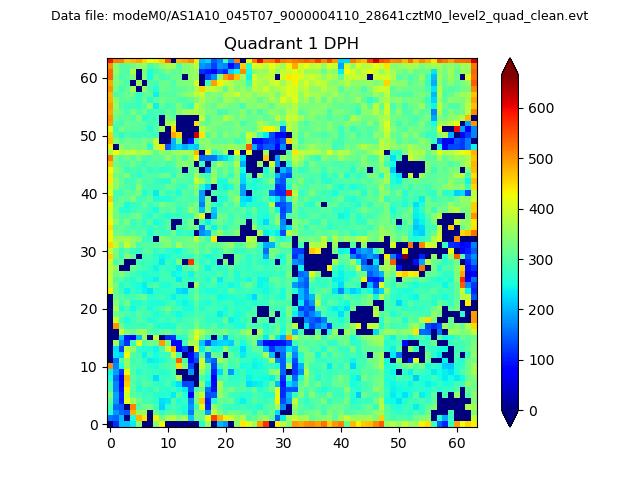 |
Quadrant B |
|---|---|---|---|
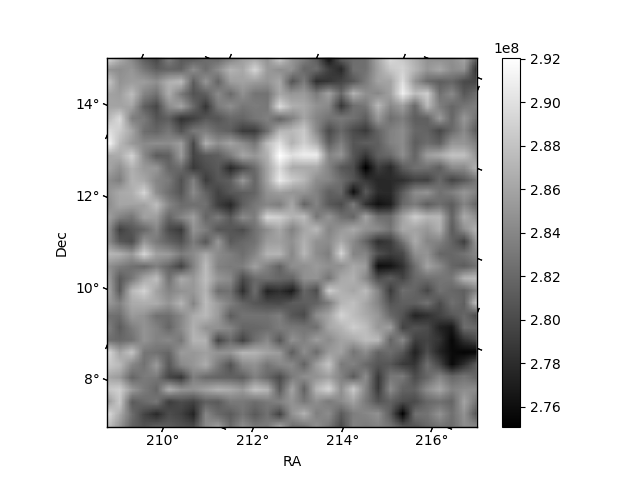
| Quadrant D | 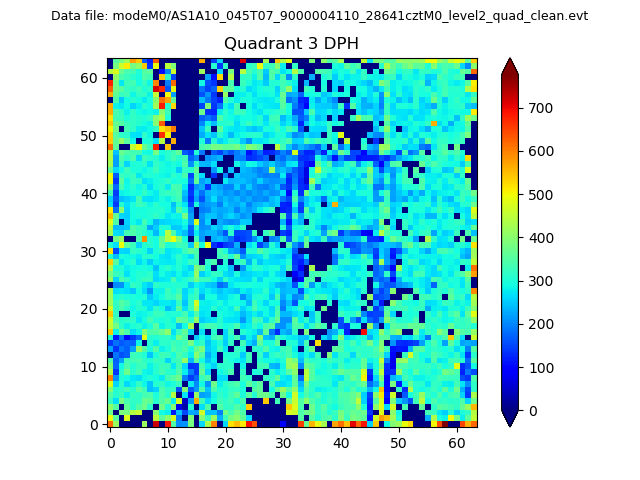 |
 |
Quadrant C |
| Plot type | Count rate plots | Images |
|---|---|---|
| Comparison with Poisson distribution Blue bars denote a histogram of data divided into 1 sec bins. Red curve is a Poisson curve with rate = median count rate of data. |
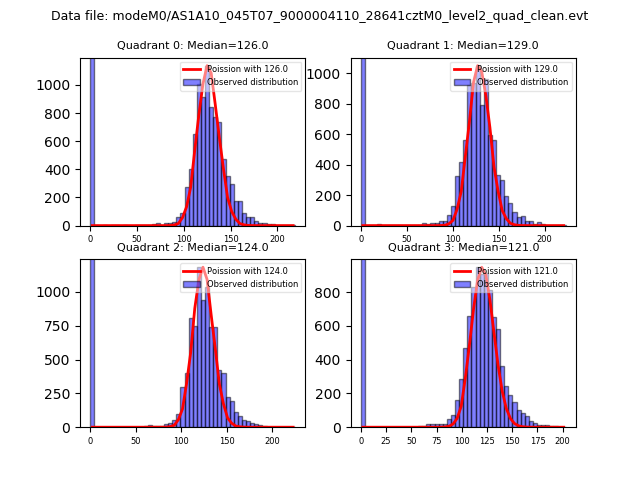 |
 |
| Quadrant-wise count rates Data is divided into 100 sec bins |
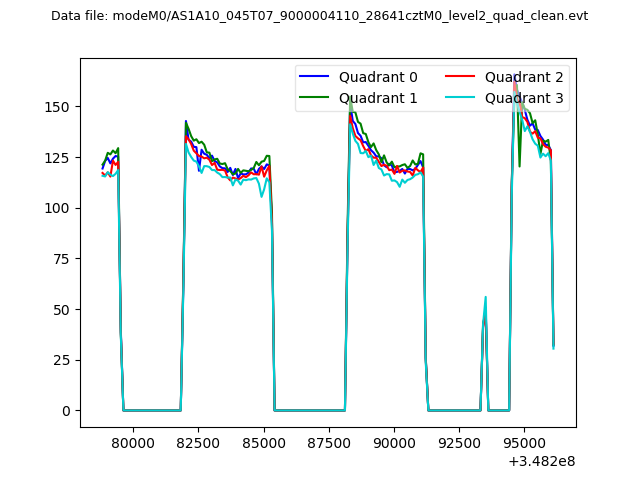 |
|
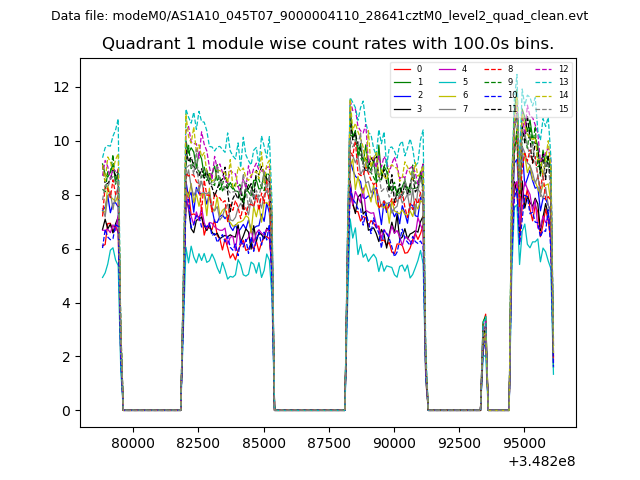
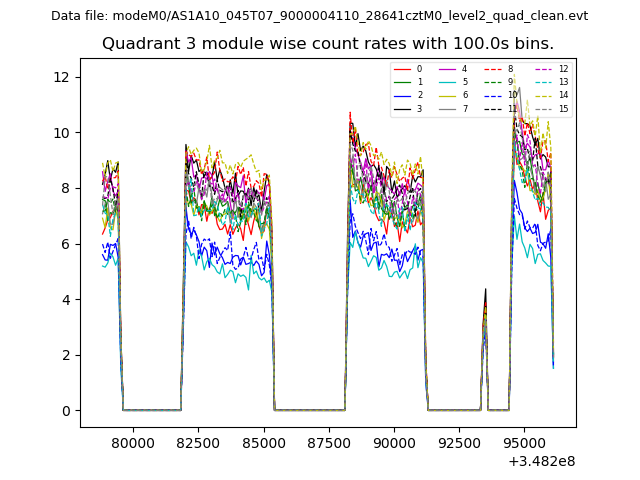
| Module-wise count rates for Quadrant A Data is divided into 100 sec bins |
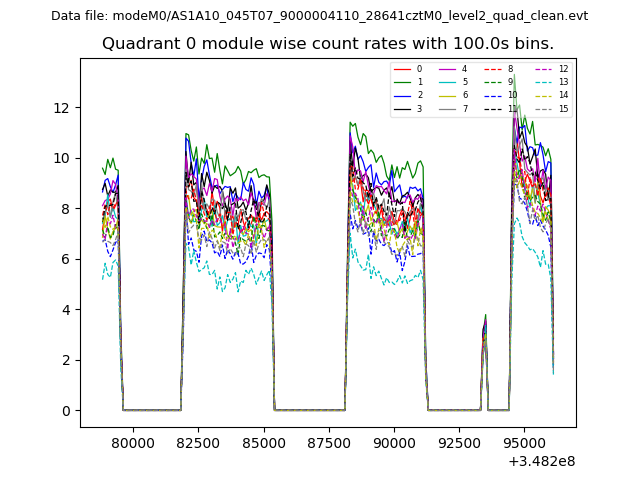 |
 |
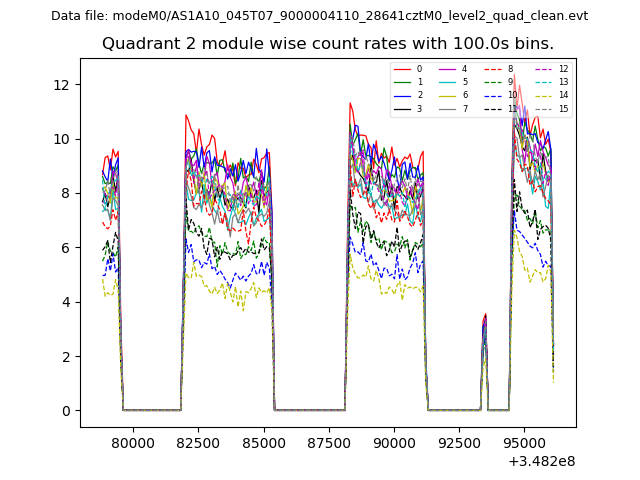
| Module-wise count rates for Quadrant B Data is divided into 100 sec bins |
 |
 |
| Module-wise count rates for Quadrant C Data is divided into 100 sec bins |
 |
 |
| Module-wise count rates for Quadrant D Data is divided into 100 sec bins |
 |
 |
| Parameter | Plot |
|---|---|
| CZT HV Monitor | 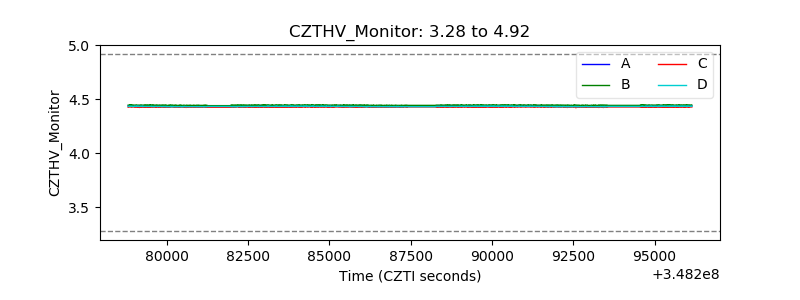 |
| D_VDD |  |
| Temperature 1 | 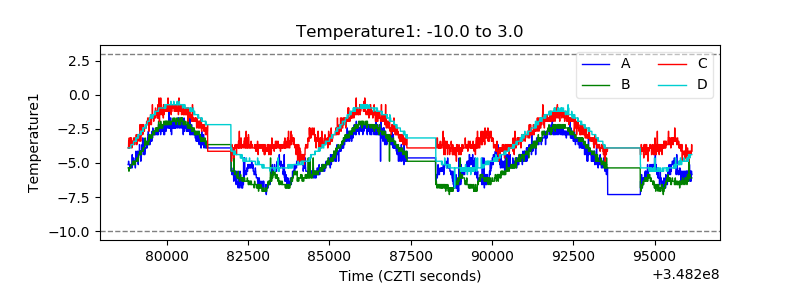 |
| Veto HV Monitor | 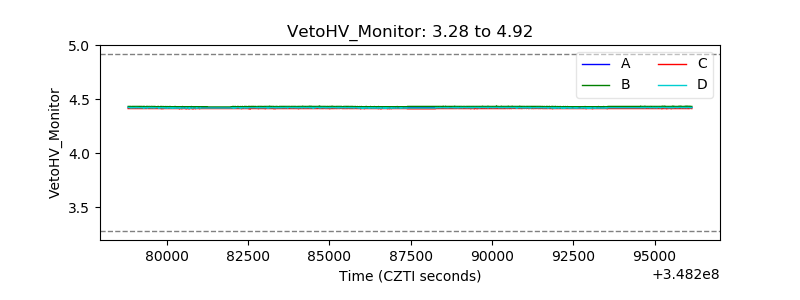 |
| Veto LLD | 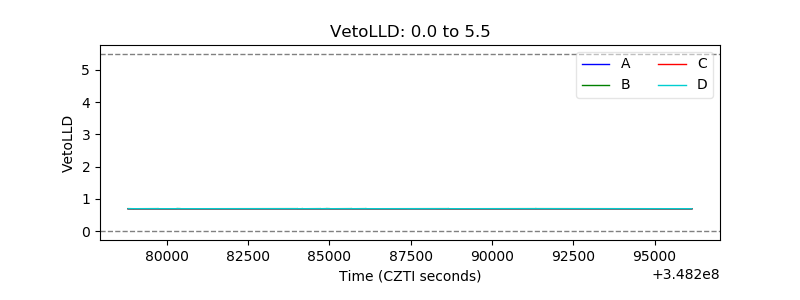 |
| Alpha Counter | 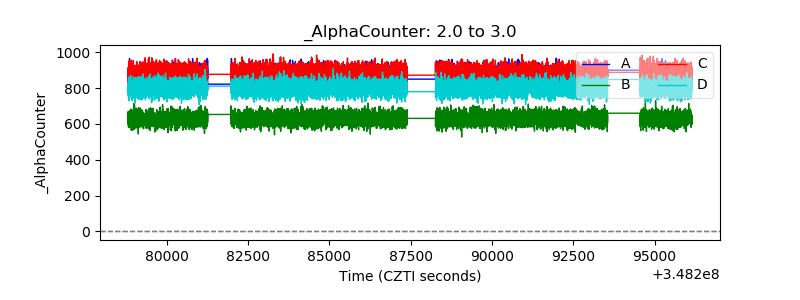 |
| _CPM_Rate | 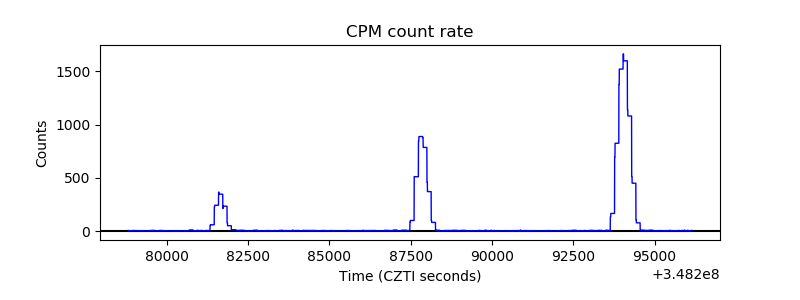 |
| CZT Counter | 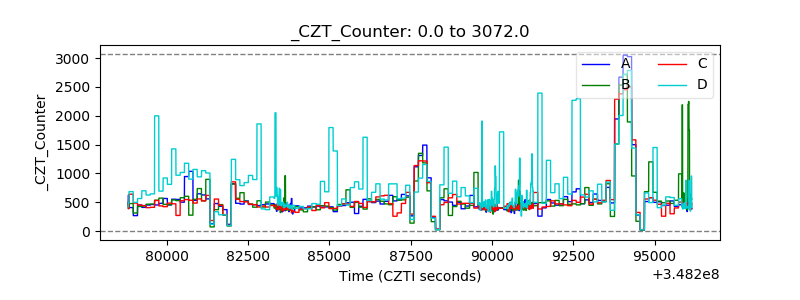 |
| +2.5 Volts monitor |  |
| +5 Volts monitor |  |
| _ROLL_ROT | 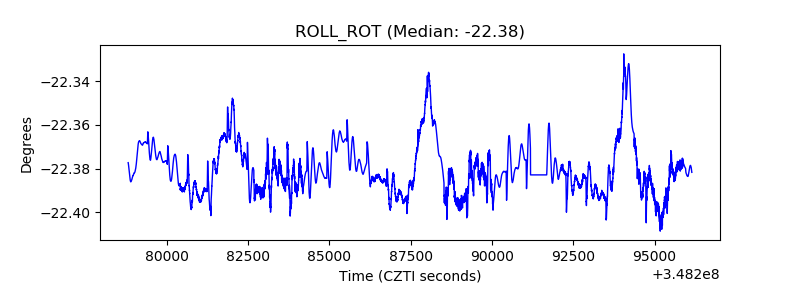 |
| _Roll_DEC | 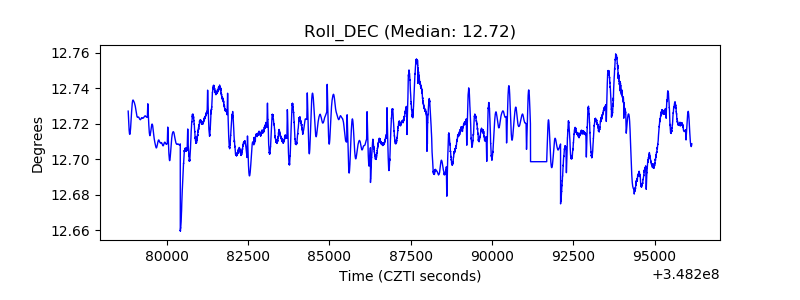 |
| _Roll_RA | 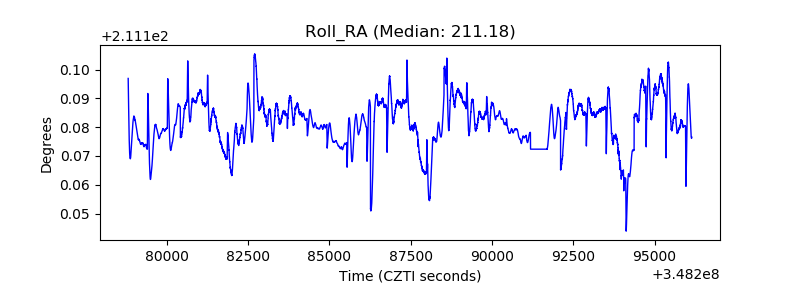 |
| Veto Counter | 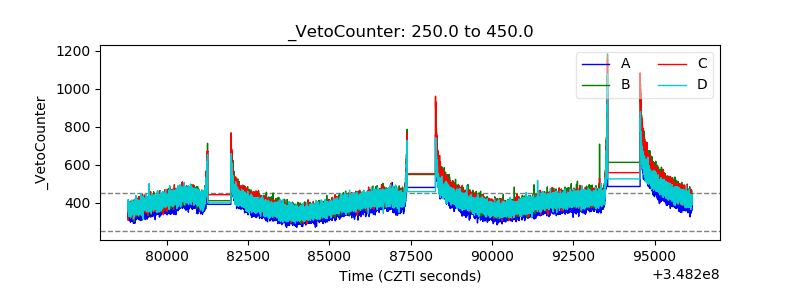 |