| Param | Original file | Final file |
|---|---|---|
| Filename | modeM0/AS1A10_045T07_9000004110_28645cztM0_level2.evt | modeM0/AS1A10_045T07_9000004110_28645cztM0_level2_quad_clean.evt |
| Size (bytes) | 665,965,440 | 92,836,800 |
| Size | 635.1 MB | 88.5 MB |
| Events in quadrant A | 3,331,448 | 643,926 |
| Events in quadrant B | 3,317,955 | 657,060 |
| Events in quadrant C | 3,381,941 | 632,862 |
| Events in quadrant D | 9,722,064 | 448,549 |
| Mode SS | |||
|---|---|---|---|
| Quadrant | BADHDUFLAG | Total packets | Discarded packets |
| A | 0 | 124 | 0 |
| B | 0 | 124 | 0 |
| C | 0 | 124 | 0 |
| D | 0 | 124 | 0 |
| Mode M9 | |||
|---|---|---|---|
| Quadrant | BADHDUFLAG | Total packets | Discarded packets |
| A | 0 | 13 | 0 |
| B | 0 | 13 | 0 |
| C | 0 | 13 | 0 |
| D | 0 | 13 | 0 |
| Mode M0 | |||
|---|---|---|---|
| Quadrant | BADHDUFLAG | Total packets | Discarded packets |
| A | 0 | 13308 | 1 |
| B | 0 | 13289 | 1 |
| C | 0 | 13530 | 2 |
| D | 0 | 32990 | 1 |
| Quadrant | Total seconds | Saturated seconds | Saturation percentage |
|---|---|---|---|
| A | 6137 | 71 | 1.156917% |
| B | 6138 | 69 | 1.124145% |
| C | 6137 | 124 | 2.020531% |
| D | 6137 | 2773 | 45.184944% |
Noise dominated data is calculated using 1-second bins in cleaned event files. If a bin has >2000 counts, and if more than 50% of those come from <1% of pixels, then it is considered to be noise-dominated and hence unusable.
| Quadrant | # 1 sec bins | Bins with >0 counts | Bins with >2000 counts | High rate bins dominated by noise | Noise dominated (total time) | Noise dominated (detector-on time) | Marked lightcurve |
|---|---|---|---|---|---|---|---|
| A | 7422 | 6138 | 0 | 0 | 0.00% | 0.00% | 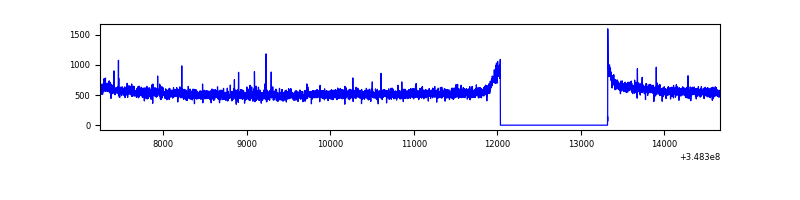 |
| B | 7423 | 6139 | 4 | 4 | 0.05% | 0.07% | 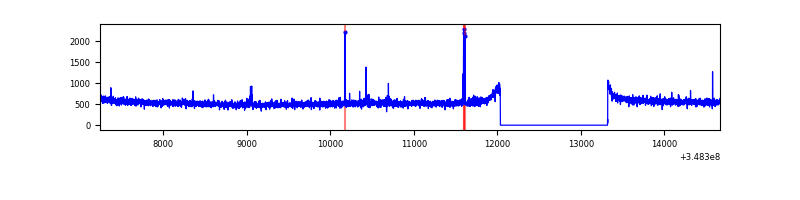 |
| C | 7422 | 6138 | 0 | 0 | 0.00% | 0.00% |  |
| D | 7422 | 6138 | 2691 | 2691 | 36.26% | 43.84% | 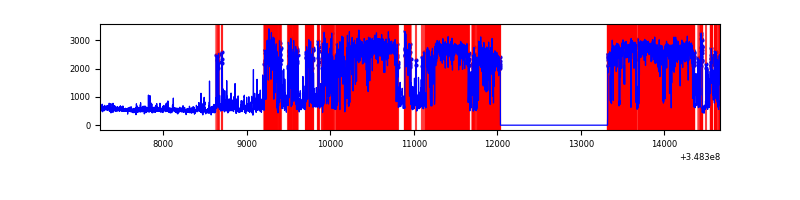 |
Top three noisy pixels from each quadrant. If the there are fewer than three noisy pixels in the level2.evt file, extra rows are filled as -1
| Pixel properties | Quadrant properties | ||||||
|---|---|---|---|---|---|---|---|
| Quadrant | DetID | PixID | Counts | Sigma | Mean | Median | Sigma |
| A | 13 | 254 | 10496 | 57.5 | 856 | 843 | 167.9 |
| A | 12 | 96 | 8858 | 47.74 | 856 | 843 | 167.9 |
| A | 3 | 137 | 7573 | 40.09 | 856 | 843 | 167.9 |
| B | 12 | 111 | 18196 | 111.35 | 838 | 819 | 156.1 |
| B | 11 | 111 | 16971 | 103.5 | 838 | 819 | 156.1 |
| B | 14 | 111 | 15997 | 97.26 | 838 | 819 | 156.1 |
| C | 14 | 238 | 135015 | 706.29 | 823 | 833 | 190.0 |
| C | 2 | 16 | 18698 | 94.04 | 823 | 833 | 190.0 |
| C | 0 | 10 | 17133 | 85.8 | 823 | 833 | 190.0 |
| D | 1 | 52 | 7026513 | 49104.73 | 607 | 594 | 143.1 |
| D | 8 | 195 | 262380 | 1829.64 | 607 | 594 | 143.1 |
| D | 2 | 250 | 126486 | 879.87 | 607 | 594 | 143.1 |
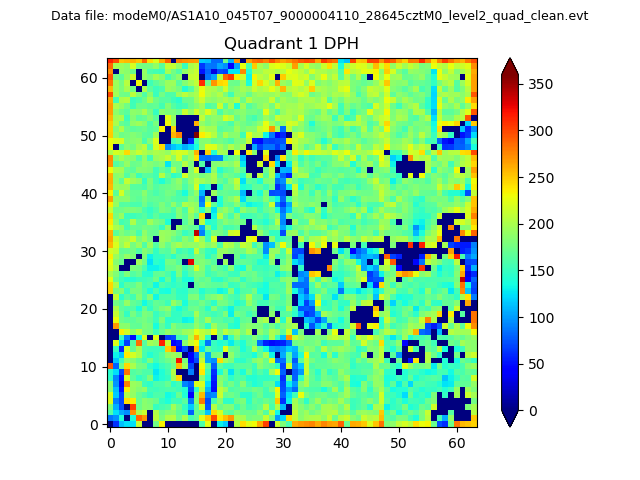
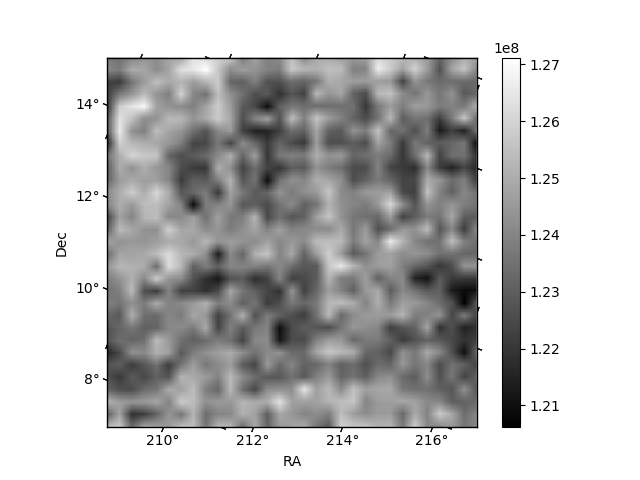
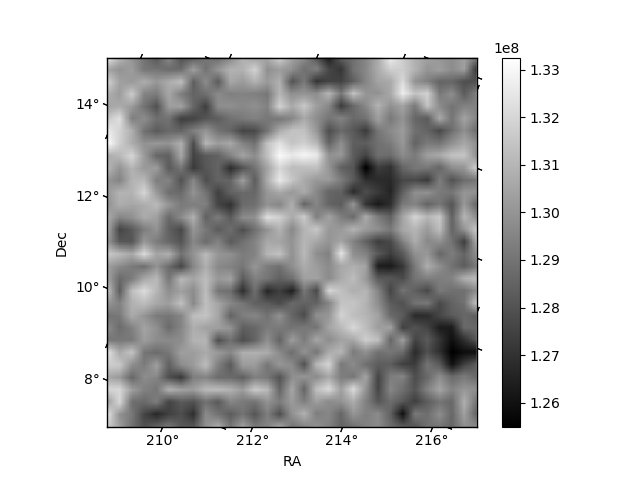
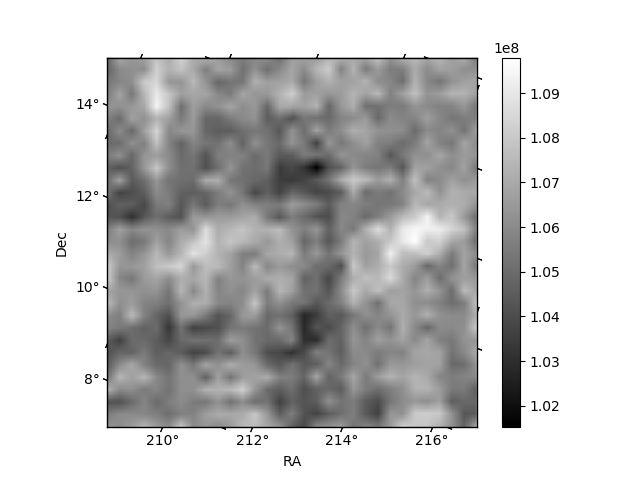
Histogram calculated using DETX and DETY for each event in the final _common_clean file
| Quadrant A | 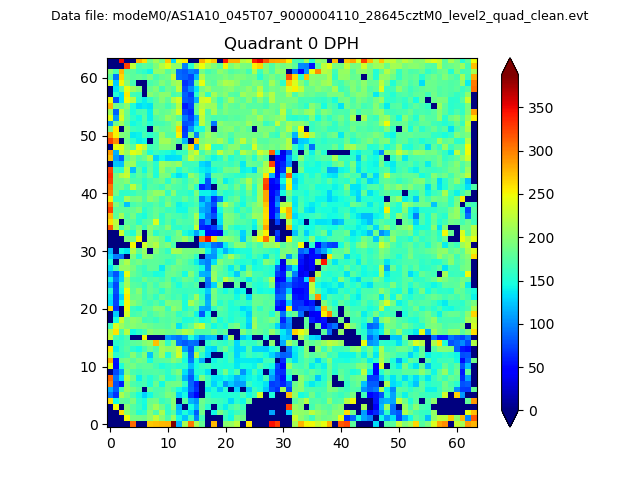 |
 |
Quadrant B |
|---|---|---|---|
| Quadrant D |  |
 |
Quadrant C |
| Plot type | Count rate plots | Images |
|---|---|---|
| Comparison with Poisson distribution Blue bars denote a histogram of data divided into 1 sec bins. Red curve is a Poisson curve with rate = median count rate of data. |
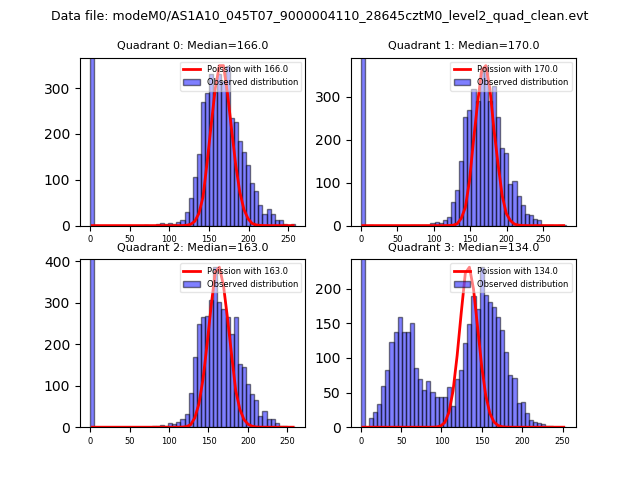 |
 |
| Quadrant-wise count rates Data is divided into 100 sec bins |
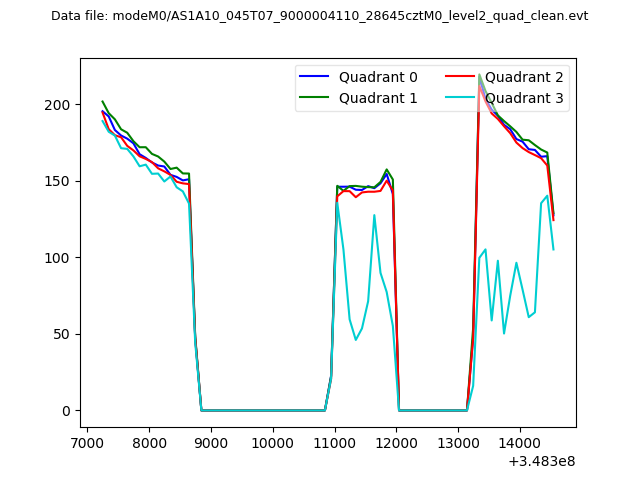 |
|
| Module-wise count rates for Quadrant A Data is divided into 100 sec bins |
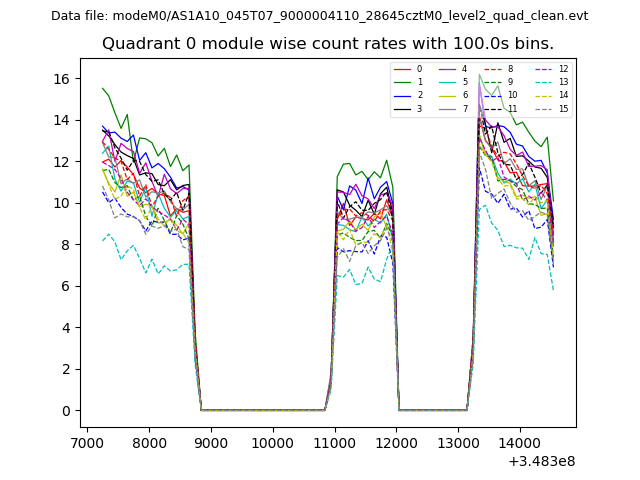 |
 |
| Module-wise count rates for Quadrant B Data is divided into 100 sec bins |
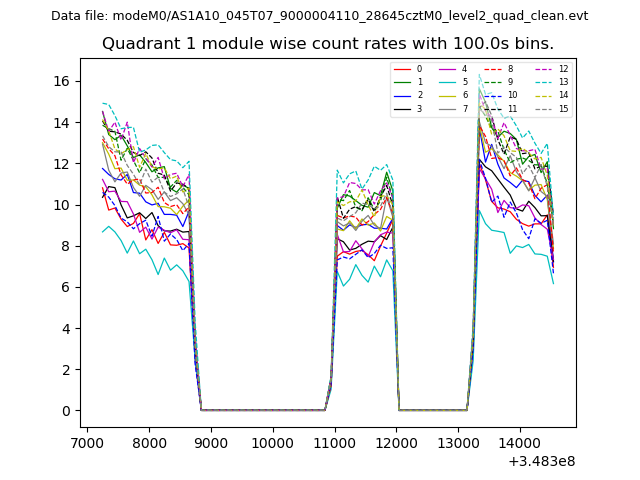 |
 |
| Module-wise count rates for Quadrant C Data is divided into 100 sec bins |
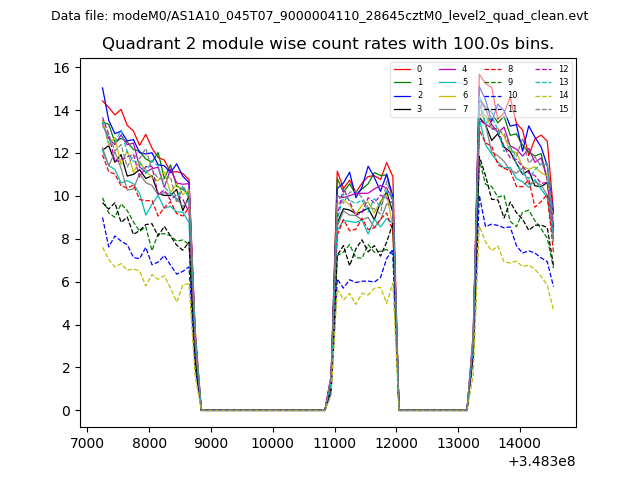 |
 |
| Module-wise count rates for Quadrant D Data is divided into 100 sec bins |
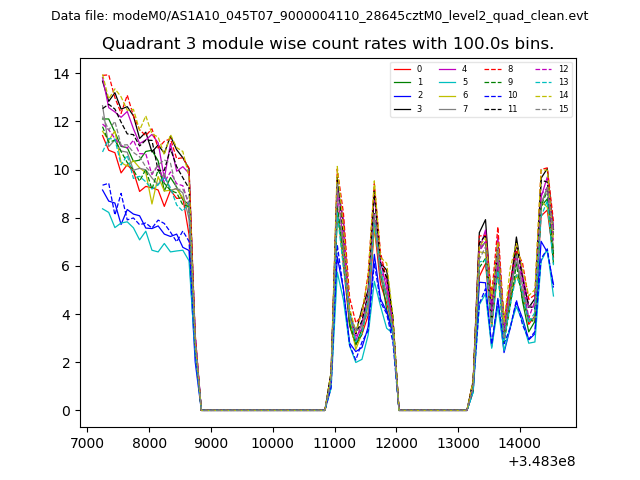 |
 |
| Parameter | Plot |
|---|---|
| CZT HV Monitor | 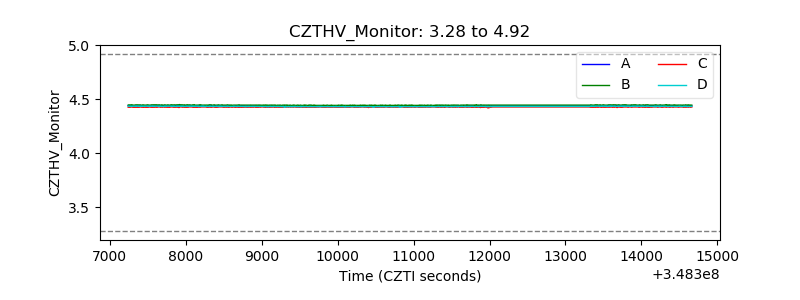 |
| D_VDD | 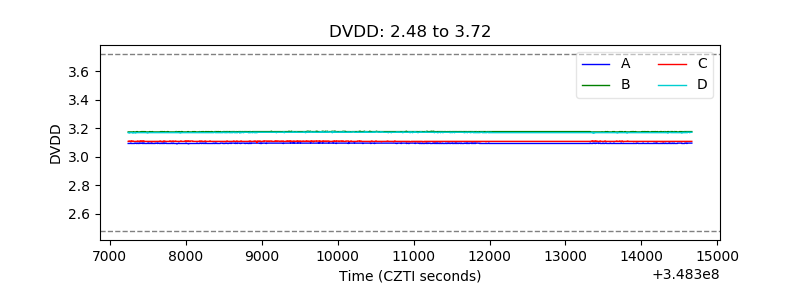 |
| Temperature 1 | 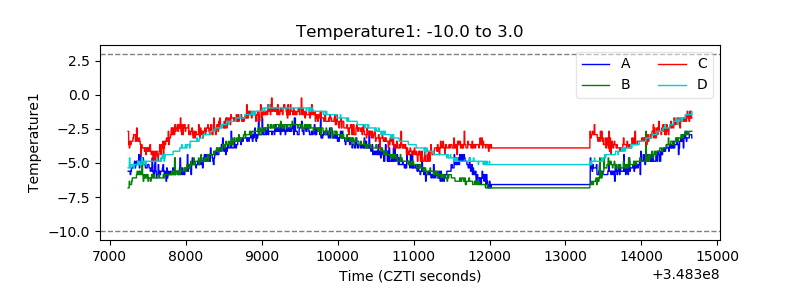 |
| Veto HV Monitor | 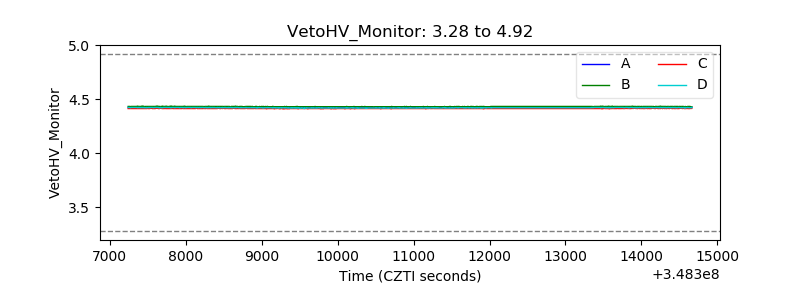 |
| Veto LLD | 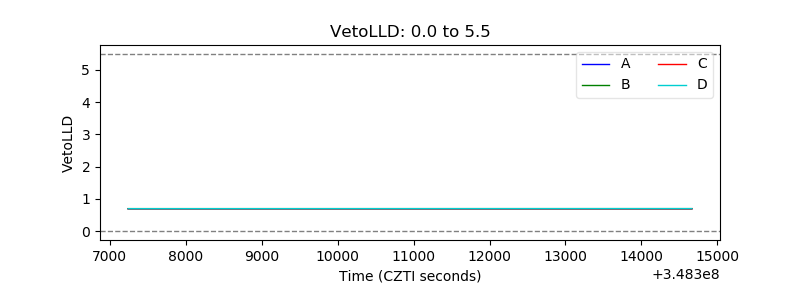 |
| Alpha Counter | 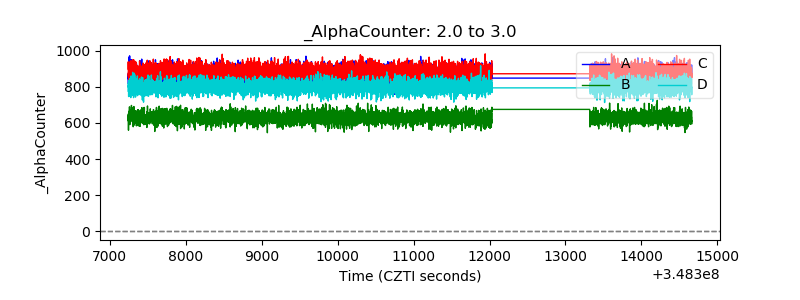 |
| _CPM_Rate | 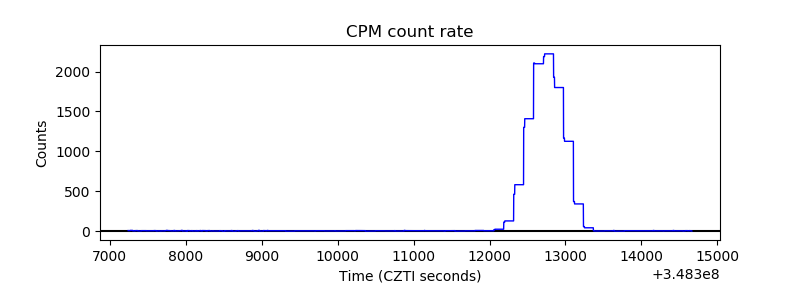 |
| CZT Counter |  |
| +2.5 Volts monitor |  |
| +5 Volts monitor | 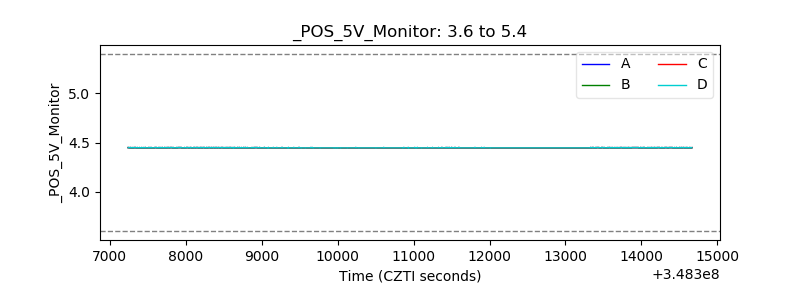 |
| _ROLL_ROT | 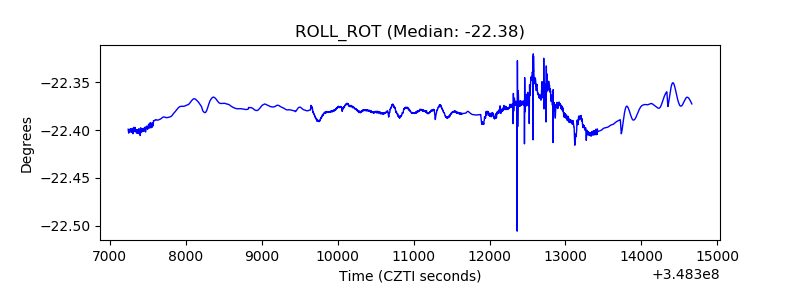 |
| _Roll_DEC | 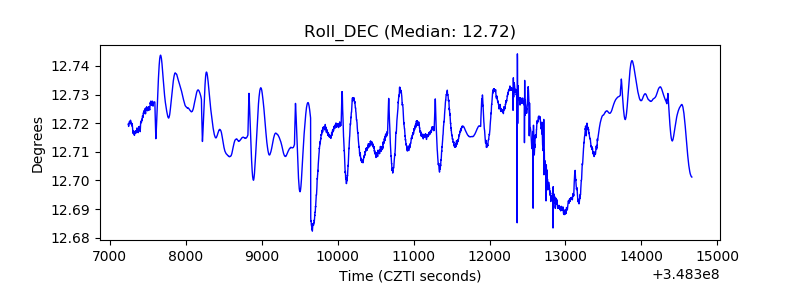 |
| _Roll_RA | 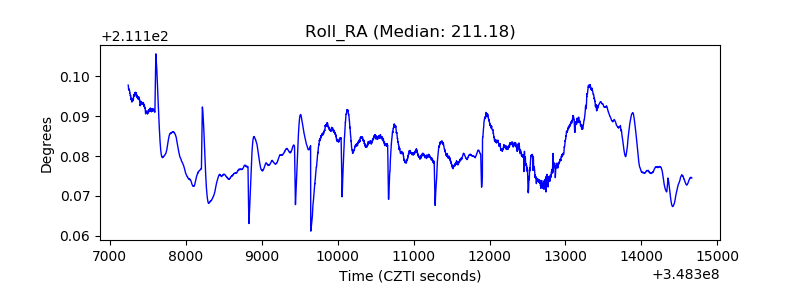 |
| Veto Counter | 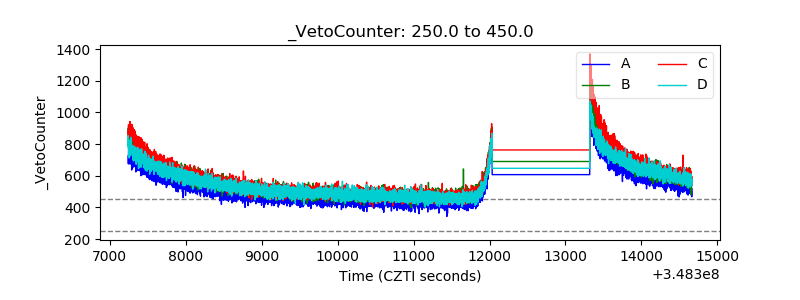 |