| Param | Original file | Final file |
|---|---|---|
| Filename | modeM0/AS1A10_045T07_9000004110_28646cztM0_level2.evt | modeM0/AS1A10_045T07_9000004110_28646cztM0_level2_quad_clean.evt |
| Size (bytes) | 447,298,560 | 63,696,960 |
| Size | 426.6 MB | 60.7 MB |
| Events in quadrant A | 2,776,012 | 407,719 |
| Events in quadrant B | 2,730,290 | 413,520 |
| Events in quadrant C | 2,759,089 | 399,803 |
| Events in quadrant D | 4,933,069 | 348,039 |
| Mode SS | |||
|---|---|---|---|
| Quadrant | BADHDUFLAG | Total packets | Discarded packets |
| A | 0 | 104 | 0 |
| B | 0 | 106 | 2 |
| C | 0 | 104 | 0 |
| D | 0 | 105 | 1 |
| Mode M9 | |||
|---|---|---|---|
| Quadrant | BADHDUFLAG | Total packets | Discarded packets |
| A | 0 | 8 | 1 |
| B | 0 | 8 | 1 |
| C | 0 | 9 | 2 |
| D | 0 | 8 | 1 |
| Mode M0 | |||
|---|---|---|---|
| Quadrant | BADHDUFLAG | Total packets | Discarded packets |
| A | 0 | 11048 | 64 |
| B | 0 | 10923 | 79 |
| C | 0 | 10995 | 65 |
| D | 0 | 18338 | 86 |
| Quadrant | Total seconds | Saturated seconds | Saturation percentage |
|---|---|---|---|
| A | 5132 | 60 | 1.169135% |
| B | 5126 | 58 | 1.131487% |
| C | 5130 | 79 | 1.539961% |
| D | 5129 | 586 | 11.425229% |
Noise dominated data is calculated using 1-second bins in cleaned event files. If a bin has >2000 counts, and if more than 50% of those come from <1% of pixels, then it is considered to be noise-dominated and hence unusable.
| Quadrant | # 1 sec bins | Bins with >0 counts | Bins with >2000 counts | High rate bins dominated by noise | Noise dominated (total time) | Noise dominated (detector-on time) | Marked lightcurve |
|---|---|---|---|---|---|---|---|
| A | 6793 | 5136 | 0 | 0 | 0.00% | 0.00% | 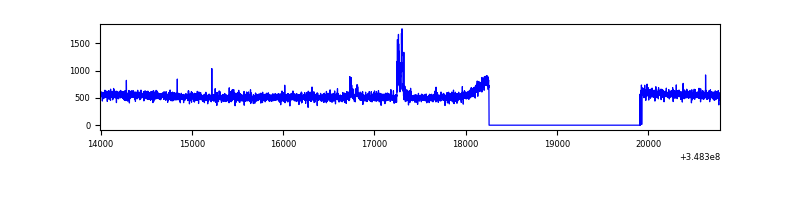 |
| B | 6793 | 5131 | 0 | 0 | 0.00% | 0.00% | 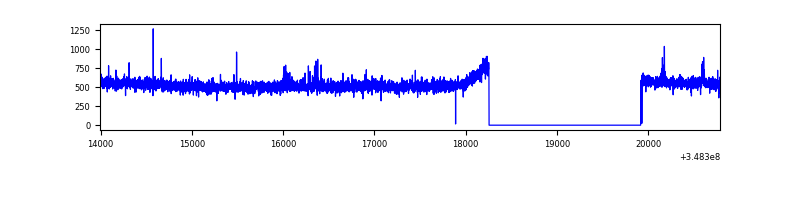 |
| C | 6793 | 5135 | 0 | 0 | 0.00% | 0.00% | 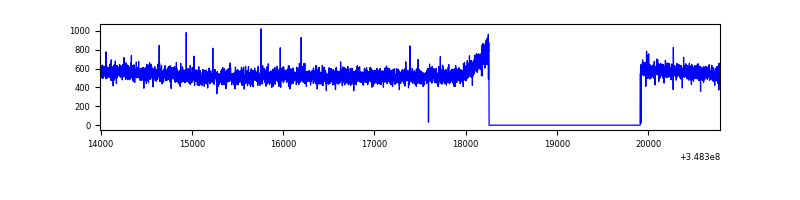 |
| D | 6792 | 5131 | 537 | 537 | 7.91% | 10.47% |  |
Top three noisy pixels from each quadrant. If the there are fewer than three noisy pixels in the level2.evt file, extra rows are filled as -1
| Pixel properties | Quadrant properties | ||||||
|---|---|---|---|---|---|---|---|
| Quadrant | DetID | PixID | Counts | Sigma | Mean | Median | Sigma |
| A | 15 | 174 | 51488 | 360.42 | 704 | 691 | 140.9 |
| A | 13 | 254 | 9121 | 59.81 | 704 | 691 | 140.9 |
| A | 3 | 137 | 6343 | 40.1 | 704 | 691 | 140.9 |
| B | 12 | 111 | 15369 | 113.62 | 689 | 675 | 129.3 |
| B | 11 | 111 | 13891 | 102.19 | 689 | 675 | 129.3 |
| B | 14 | 111 | 12662 | 92.69 | 689 | 675 | 129.3 |
| C | 14 | 238 | 111512 | 703.23 | 677 | 684 | 157.6 |
| C | 7 | 247 | 5453 | 30.26 | 677 | 684 | 157.6 |
| C | 13 | 61 | 4632 | 25.05 | 677 | 684 | 157.6 |
| D | 1 | 52 | 1983661 | 12689.48 | 653 | 636 | 156.3 |
| D | 8 | 195 | 345673 | 2207.91 | 653 | 636 | 156.3 |
| D | 13 | 104 | 72648 | 460.81 | 653 | 636 | 156.3 |
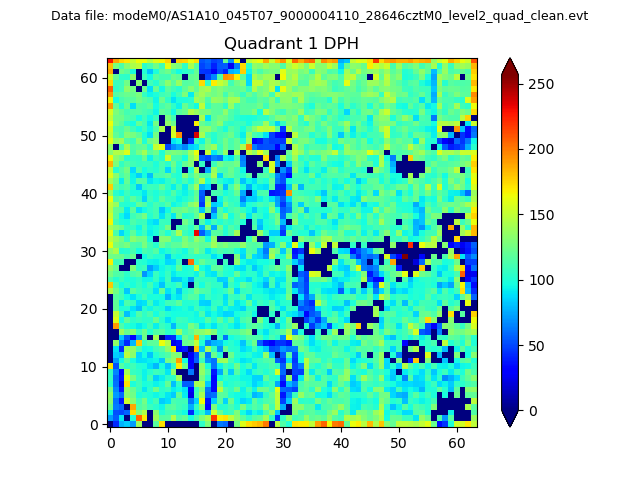
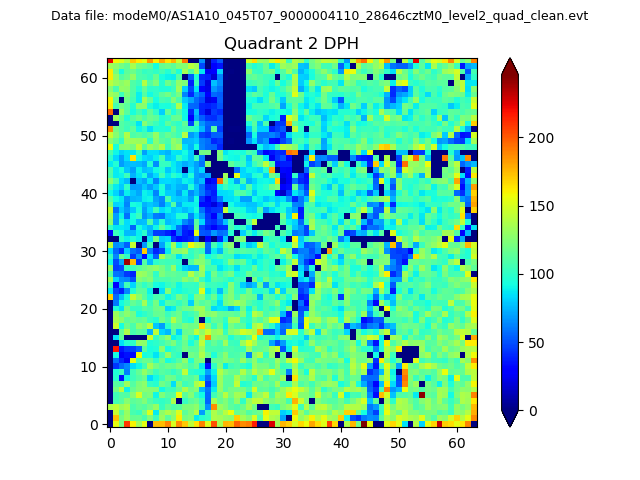
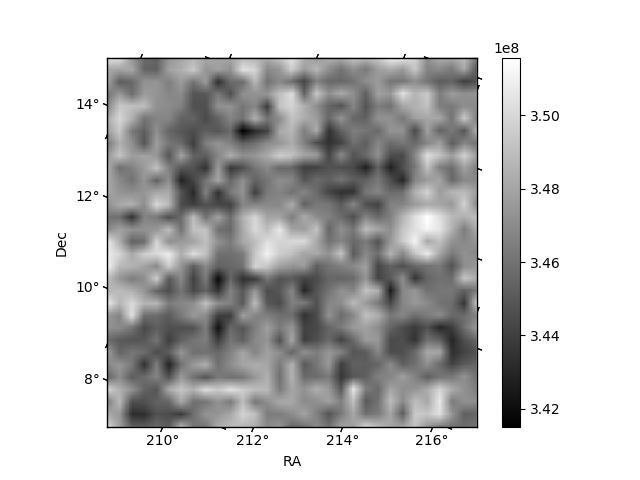
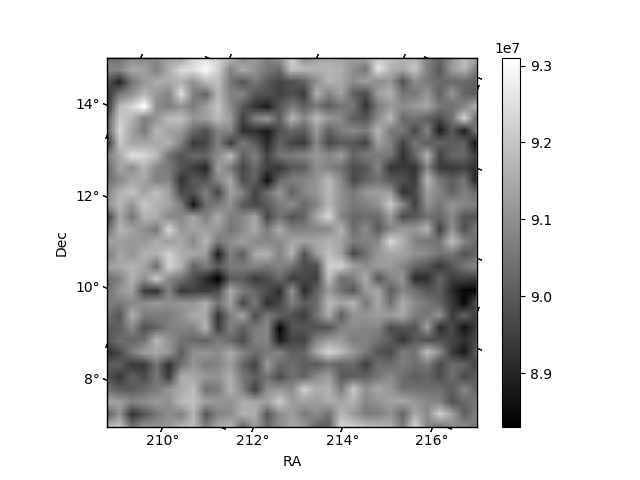
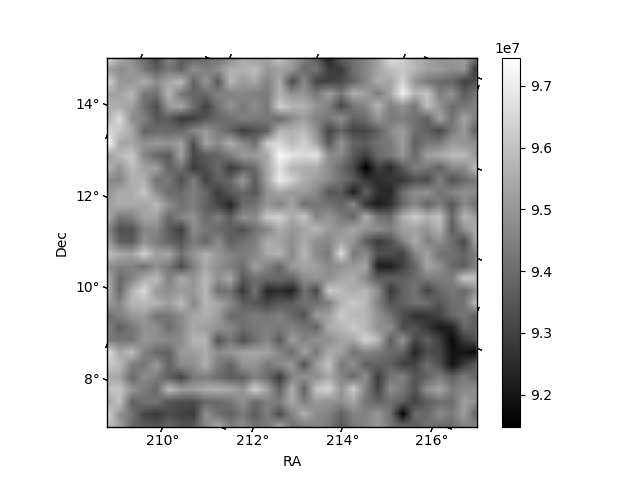
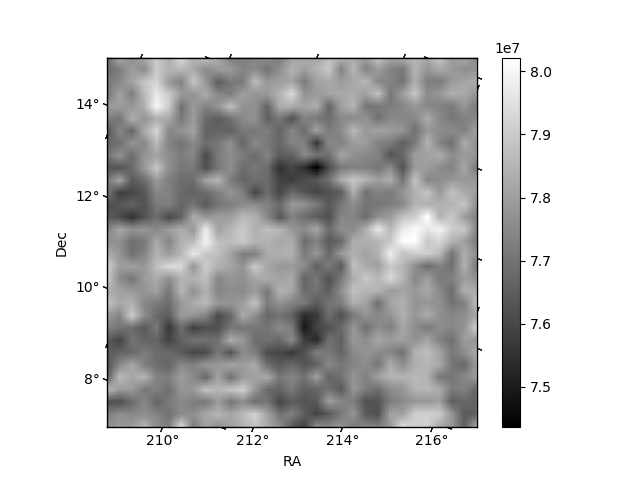
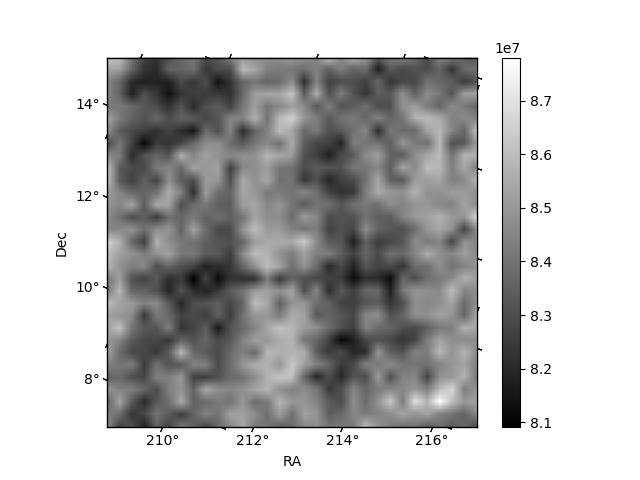
Histogram calculated using DETX and DETY for each event in the final _common_clean file
| Quadrant A | 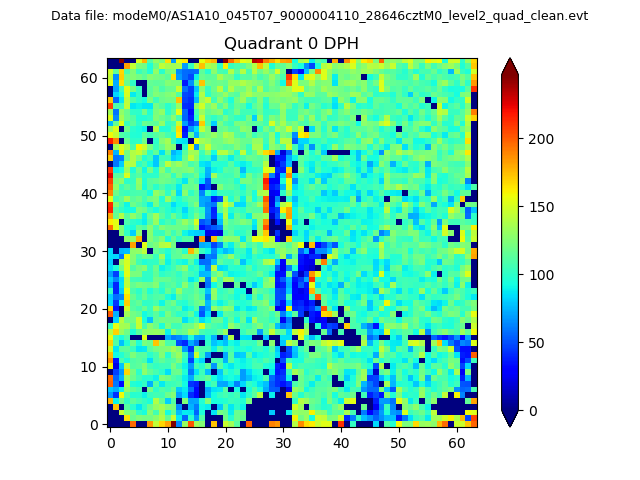 |
 |
Quadrant B |
|---|---|---|---|
| Quadrant D | 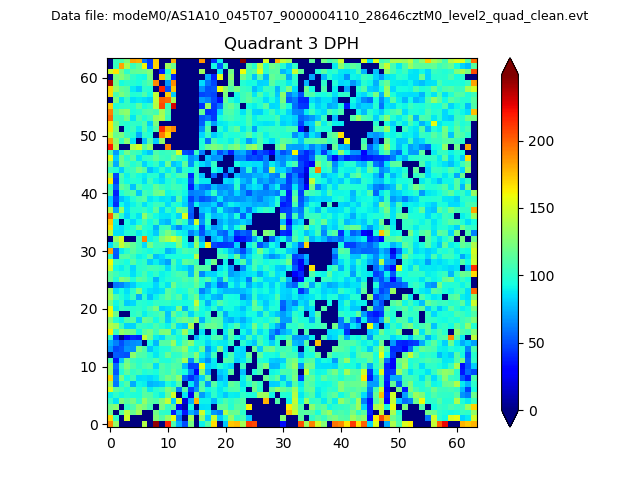 |
 |
Quadrant C |
| Plot type | Count rate plots | Images |
|---|---|---|
| Comparison with Poisson distribution Blue bars denote a histogram of data divided into 1 sec bins. Red curve is a Poisson curve with rate = median count rate of data. |
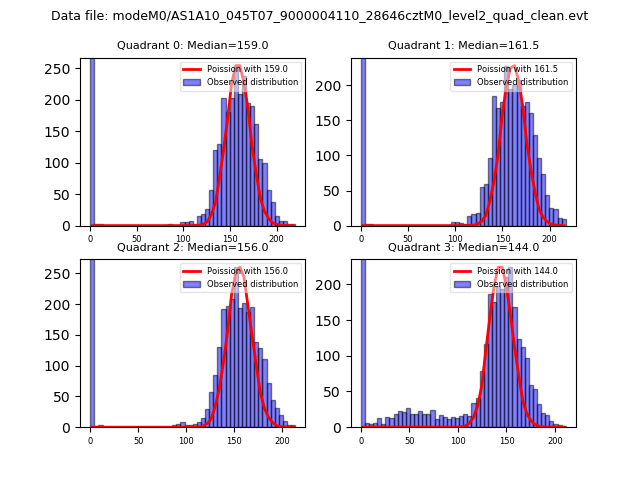 |
 |
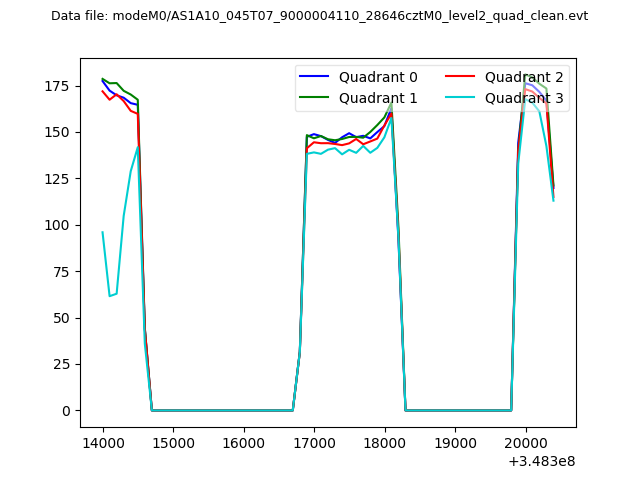
| Quadrant-wise count rates Data is divided into 100 sec bins |
 |
|
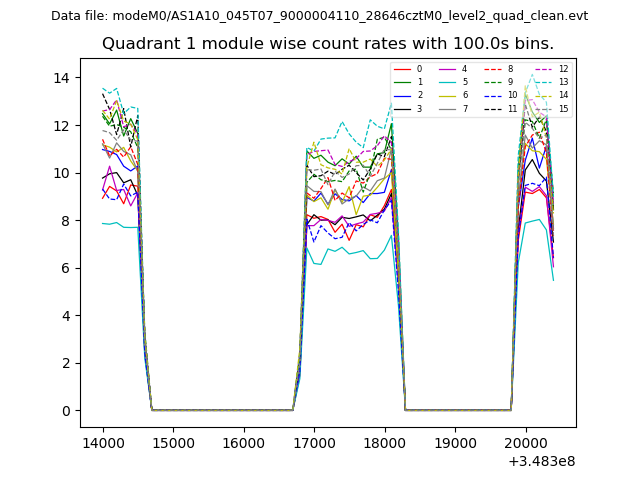
| Module-wise count rates for Quadrant A Data is divided into 100 sec bins |
 |
 |
| Module-wise count rates for Quadrant B Data is divided into 100 sec bins |
 |
 |
| Module-wise count rates for Quadrant C Data is divided into 100 sec bins |
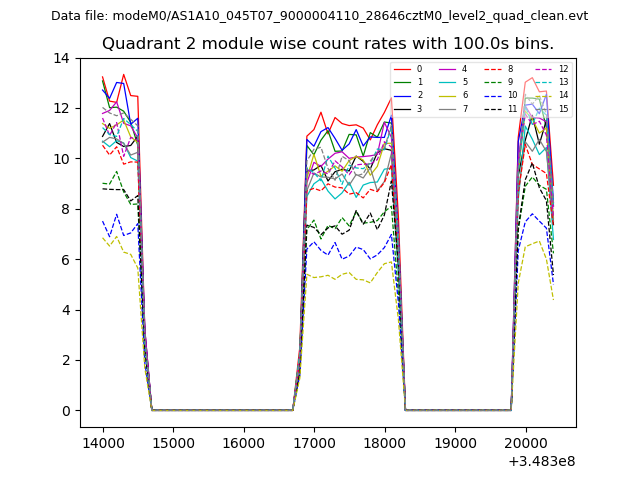 |
 |
| Module-wise count rates for Quadrant D Data is divided into 100 sec bins |
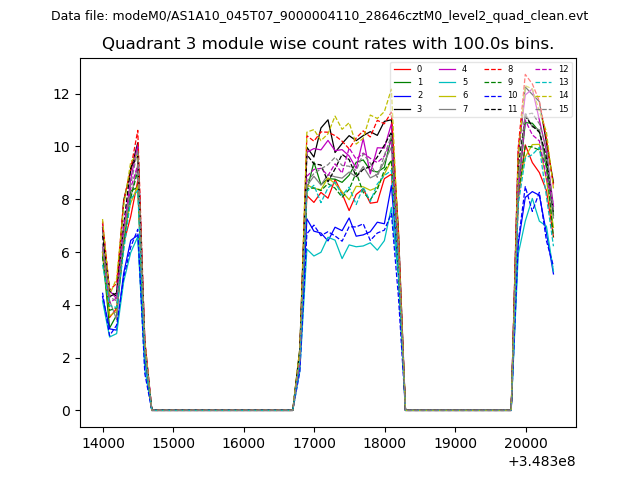 |
 |
| Parameter | Plot |
|---|---|
| CZT HV Monitor | 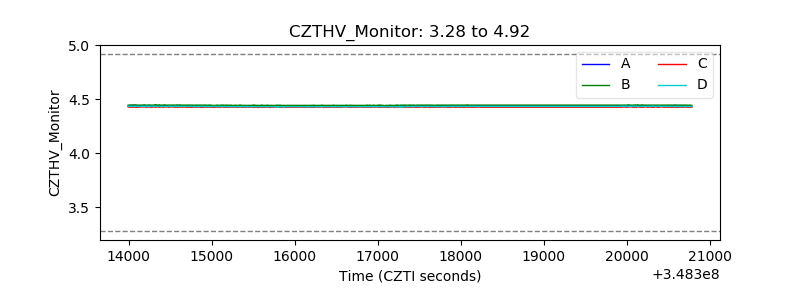 |
| D_VDD | 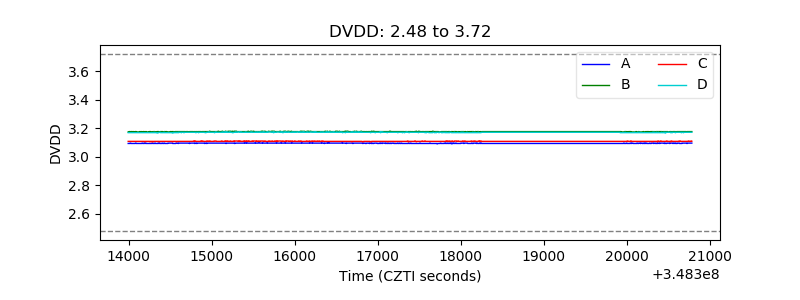 |
| Temperature 1 | 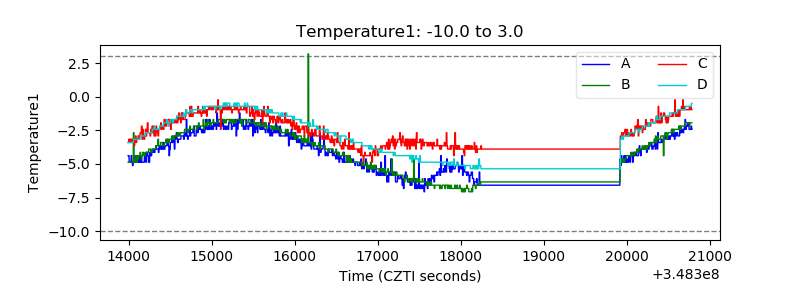 |
| Veto HV Monitor | 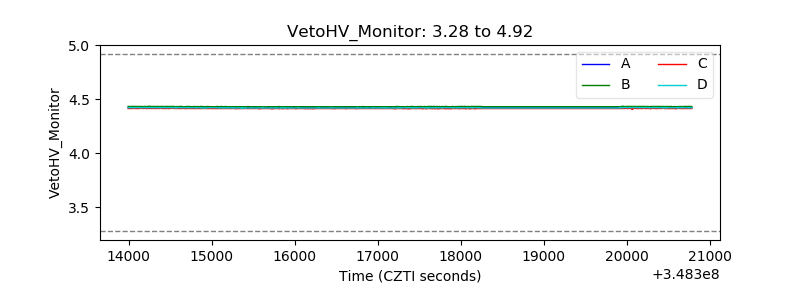 |
| Veto LLD | 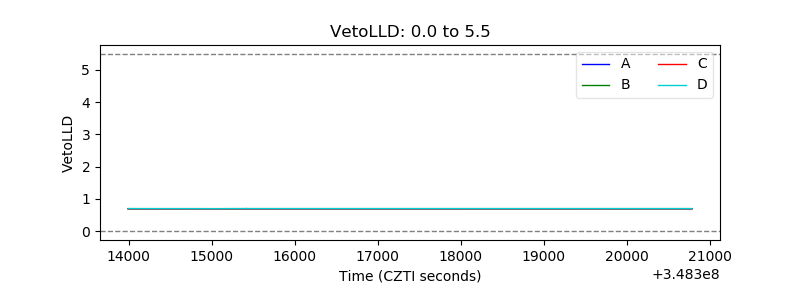 |
| Alpha Counter | 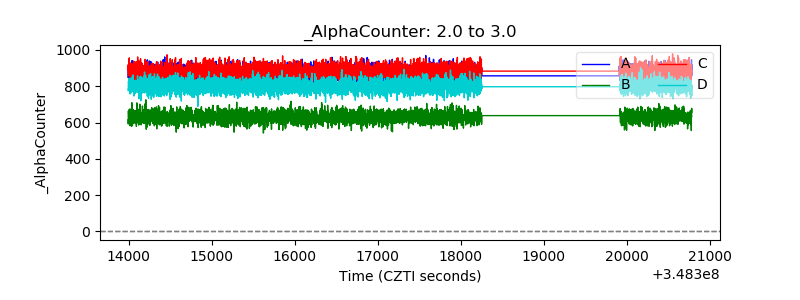 |
| _CPM_Rate | 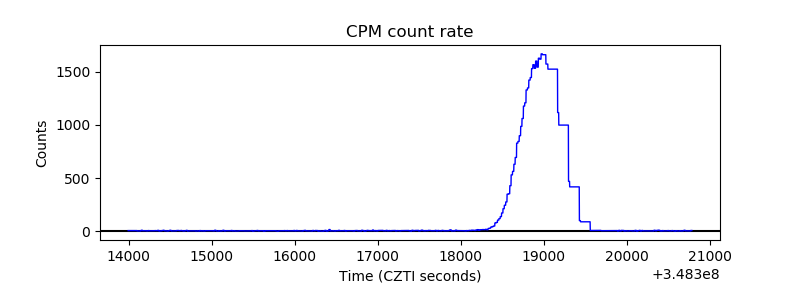 |
| CZT Counter | 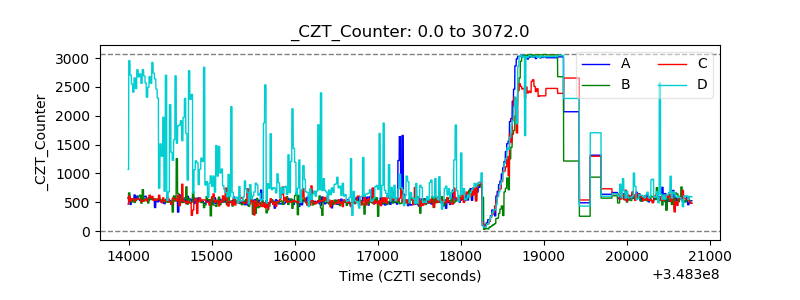 |
| +2.5 Volts monitor |  |
| +5 Volts monitor |  |
| _ROLL_ROT | 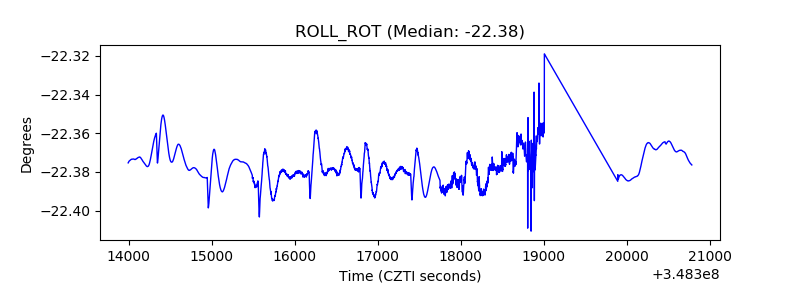 |
| _Roll_DEC | 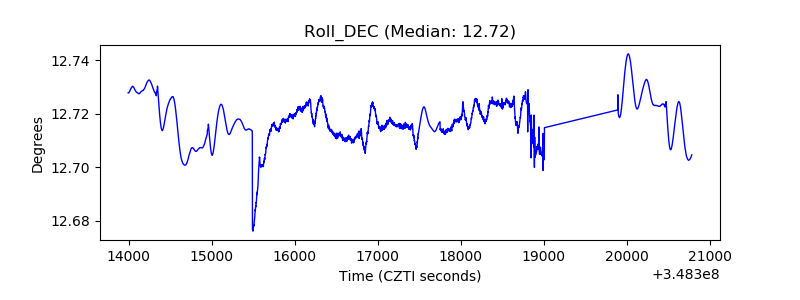 |
| _Roll_RA | 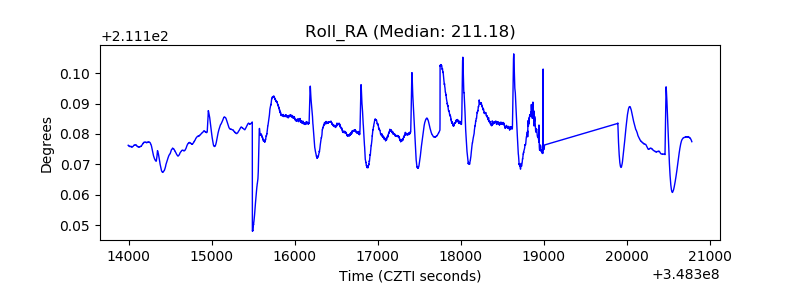 |
| Veto Counter | 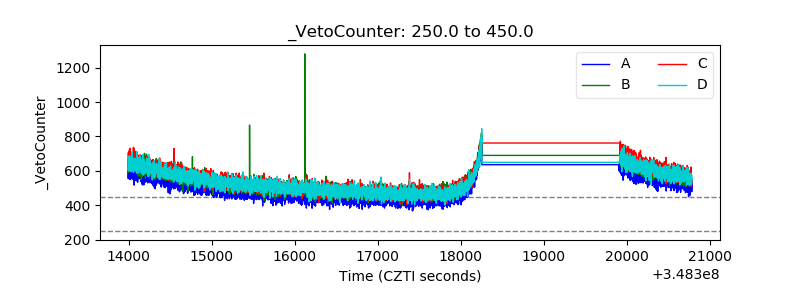 |