| Param | Original file | Final file |
|---|---|---|
| Filename | modeM0/AS1A10_045T07_9000004110_28647cztM0_level2.evt | modeM0/AS1A10_045T07_9000004110_28647cztM0_level2_quad_clean.evt |
| Size (bytes) | 576,457,920 | 78,796,800 |
| Size | 549.8 MB | 75.1 MB |
| Events in quadrant A | 3,355,352 | 498,744 |
| Events in quadrant B | 3,338,166 | 506,392 |
| Events in quadrant C | 3,406,840 | 488,700 |
| Events in quadrant D | 6,935,644 | 456,634 |
| Mode SS | |||
|---|---|---|---|
| Quadrant | BADHDUFLAG | Total packets | Discarded packets |
| A | 0 | 126 | 0 |
| B | 0 | 126 | 0 |
| C | 0 | 126 | 0 |
| D | 0 | 126 | 0 |
| Mode M9 | |||
|---|---|---|---|
| Quadrant | BADHDUFLAG | Total packets | Discarded packets |
| A | 0 | 13 | 0 |
| B | 0 | 13 | 0 |
| C | 0 | 13 | 0 |
| D | 0 | 13 | 0 |
| Mode M0 | |||
|---|---|---|---|
| Quadrant | BADHDUFLAG | Total packets | Discarded packets |
| A | 0 | 13460 | 1 |
| B | 0 | 13405 | 1 |
| C | 0 | 13702 | 1 |
| D | 0 | 25137 | 1 |
| Quadrant | Total seconds | Saturated seconds | Saturation percentage |
|---|---|---|---|
| A | 6242 | 50 | 0.801025% |
| B | 6242 | 58 | 0.929189% |
| C | 6243 | 129 | 2.066314% |
| D | 6243 | 659 | 10.555823% |
Noise dominated data is calculated using 1-second bins in cleaned event files. If a bin has >2000 counts, and if more than 50% of those come from <1% of pixels, then it is considered to be noise-dominated and hence unusable.
| Quadrant | # 1 sec bins | Bins with >0 counts | Bins with >2000 counts | High rate bins dominated by noise | Noise dominated (total time) | Noise dominated (detector-on time) | Marked lightcurve |
|---|---|---|---|---|---|---|---|
| A | 7502 | 6243 | 3 | 3 | 0.04% | 0.05% | 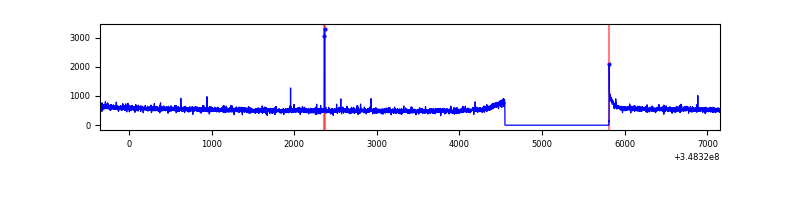 |
| B | 7502 | 6243 | 0 | 0 | 0.00% | 0.00% | 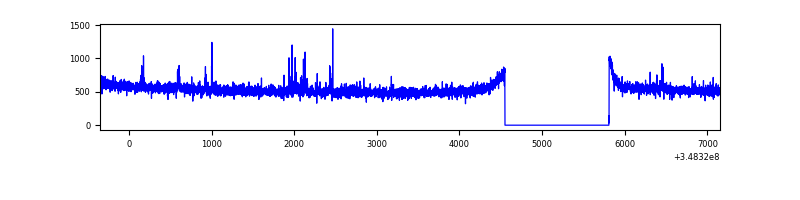 |
| C | 7503 | 6244 | 0 | 0 | 0.00% | 0.00% | 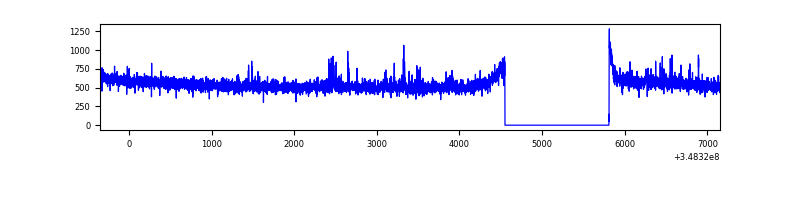 |
| D | 7503 | 6244 | 554 | 554 | 7.38% | 8.87% | 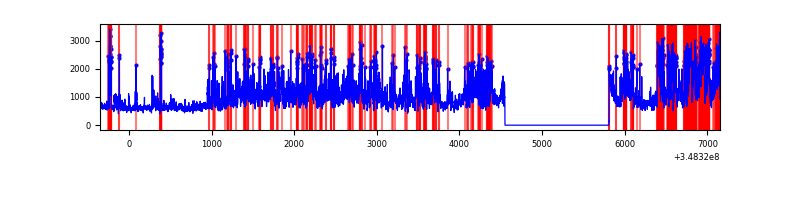 |
Top three noisy pixels from each quadrant. If the there are fewer than three noisy pixels in the level2.evt file, extra rows are filled as -1
| Pixel properties | Quadrant properties | ||||||
|---|---|---|---|---|---|---|---|
| Quadrant | DetID | PixID | Counts | Sigma | Mean | Median | Sigma |
| A | 13 | 254 | 12474 | 68.22 | 859 | 843 | 170.5 |
| A | 12 | 16 | 10914 | 59.07 | 859 | 843 | 170.5 |
| A | 12 | 96 | 10665 | 57.61 | 859 | 843 | 170.5 |
| B | 12 | 111 | 18700 | 113.16 | 840 | 823 | 158.0 |
| B | 11 | 111 | 17112 | 103.1 | 840 | 823 | 158.0 |
| B | 14 | 111 | 15794 | 94.76 | 840 | 823 | 158.0 |
| C | 14 | 238 | 154041 | 815.05 | 823 | 832 | 188.0 |
| C | 14 | 254 | 30796 | 159.4 | 823 | 832 | 188.0 |
| C | 7 | 247 | 8945 | 43.16 | 823 | 832 | 188.0 |
| D | 1 | 52 | 2427148 | 12698.46 | 806 | 786 | 191.1 |
| D | 8 | 195 | 1165305 | 6094.55 | 806 | 786 | 191.1 |
| D | 13 | 104 | 123943 | 644.55 | 806 | 786 | 191.1 |
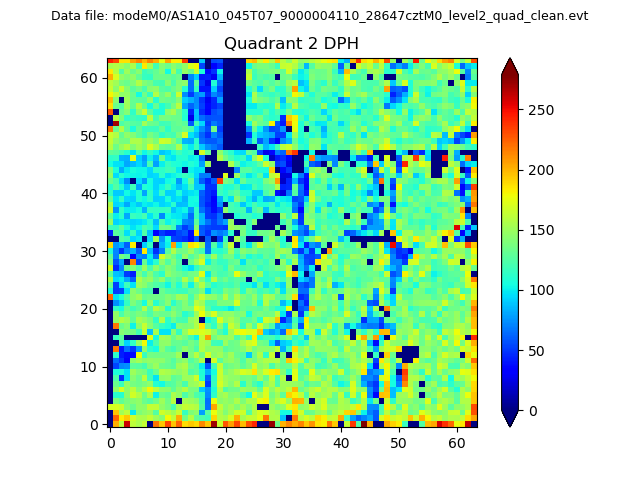
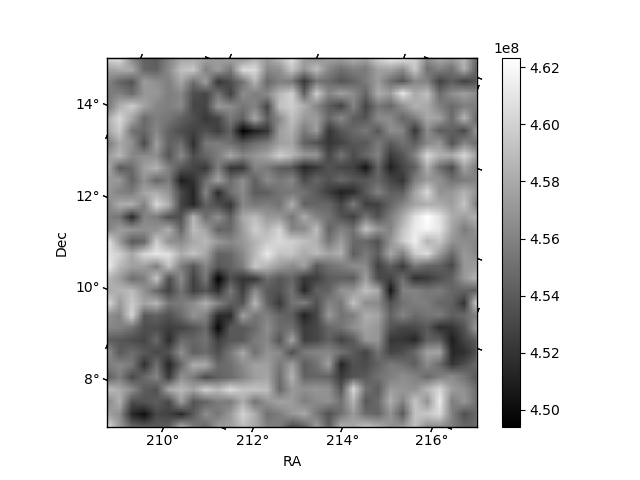
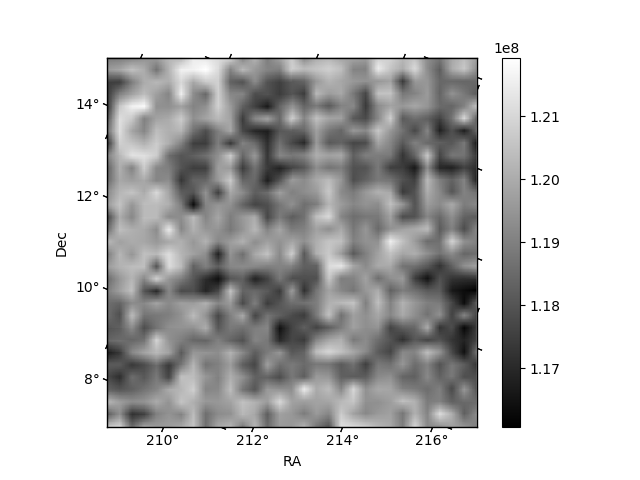
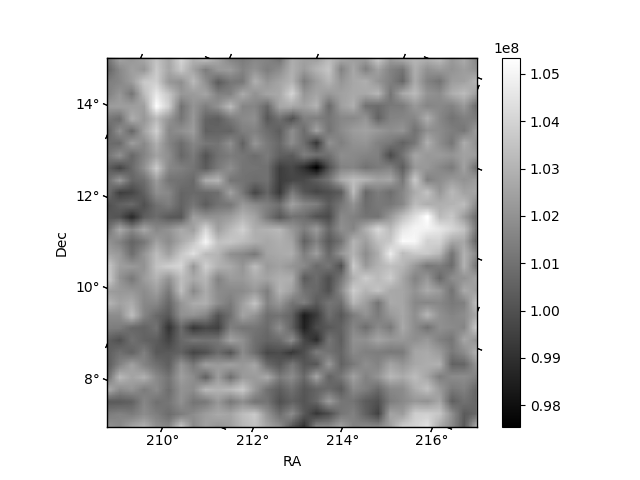
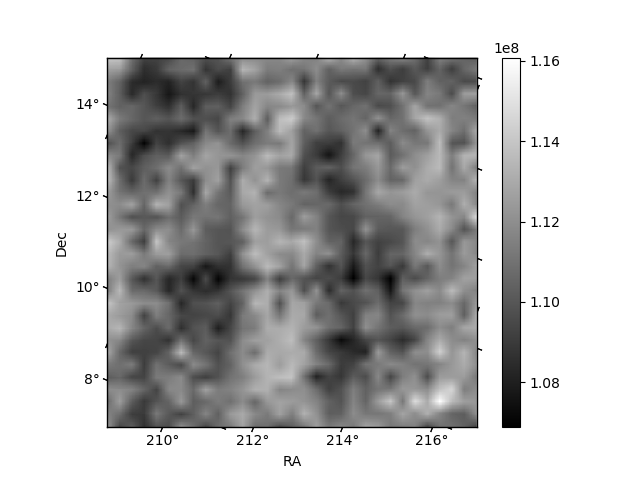
Histogram calculated using DETX and DETY for each event in the final _common_clean file
| Quadrant A | 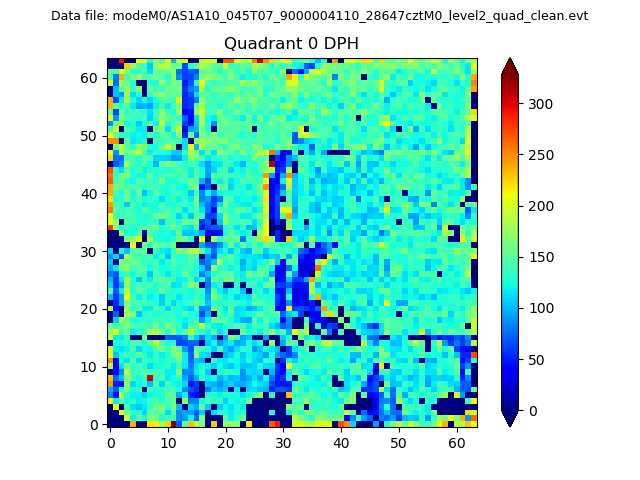 |
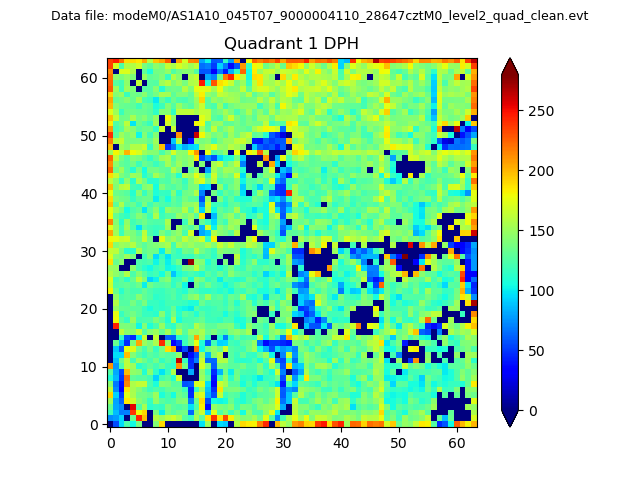 |
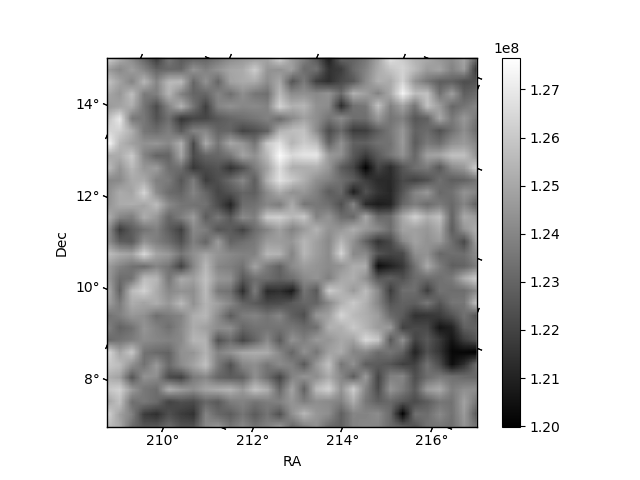
Quadrant B |
|---|---|---|---|
| Quadrant D | 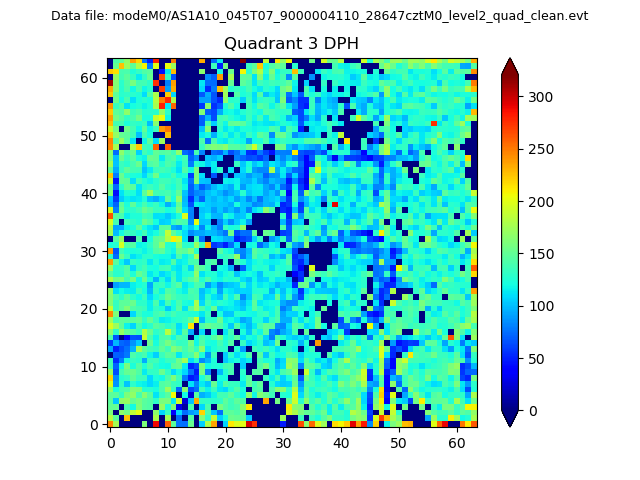 |
 |
Quadrant C |
| Plot type | Count rate plots | Images |
|---|---|---|
| Comparison with Poisson distribution Blue bars denote a histogram of data divided into 1 sec bins. Red curve is a Poisson curve with rate = median count rate of data. |
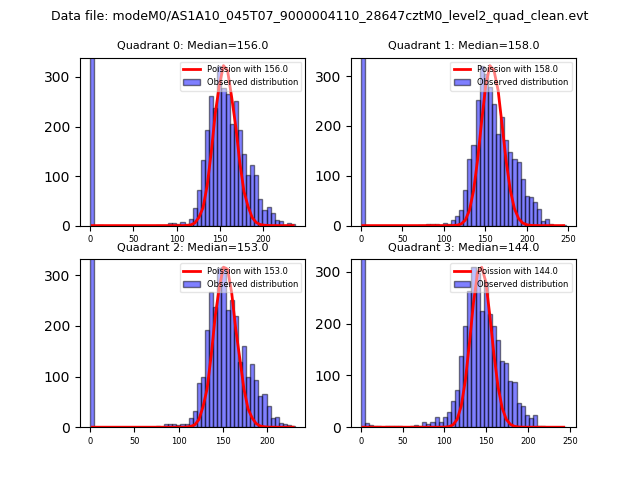 |
 |
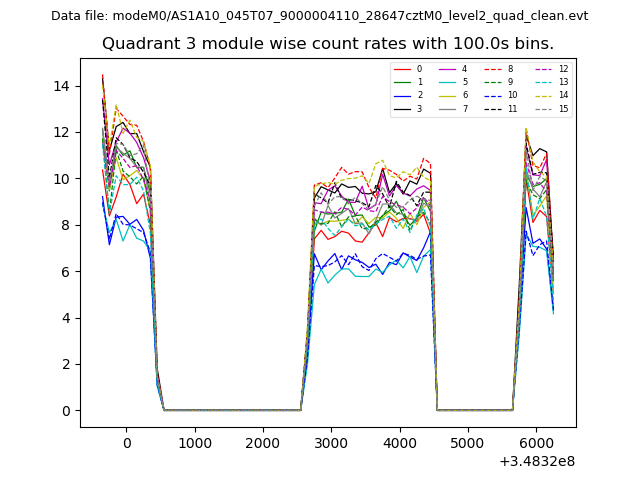
| Quadrant-wise count rates Data is divided into 100 sec bins |
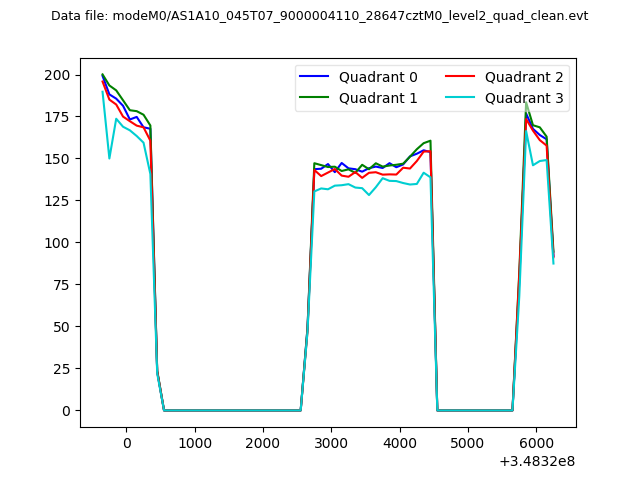 |
|
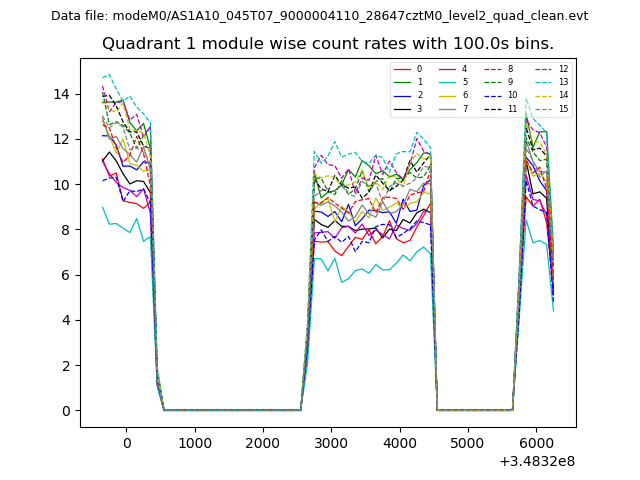
| Module-wise count rates for Quadrant A Data is divided into 100 sec bins |
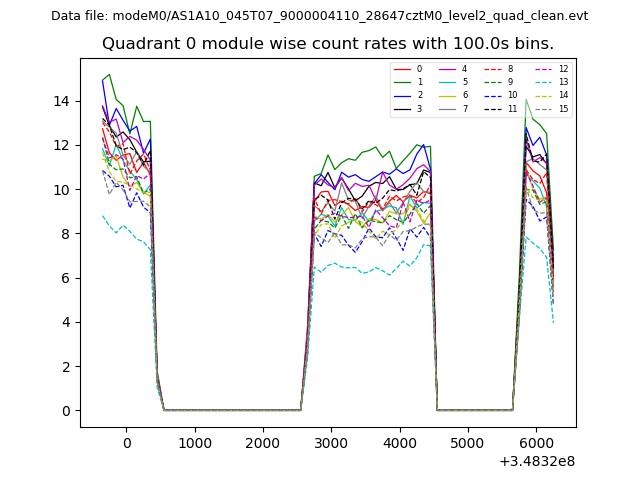 |
 |
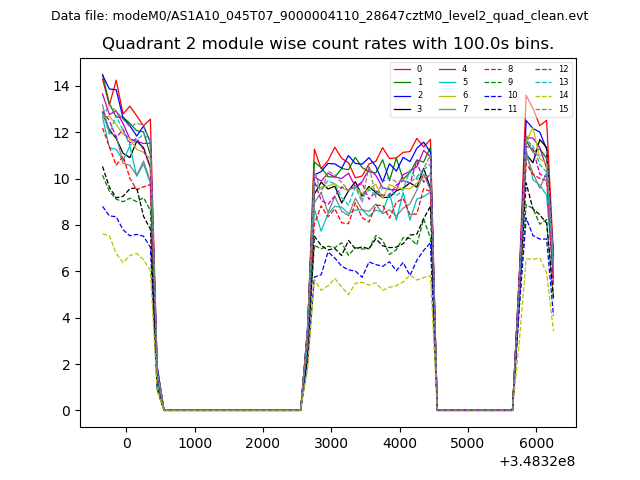
| Module-wise count rates for Quadrant B Data is divided into 100 sec bins |
 |
 |
| Module-wise count rates for Quadrant C Data is divided into 100 sec bins |
 |
 |
| Module-wise count rates for Quadrant D Data is divided into 100 sec bins |
 |
 |
| Parameter | Plot |
|---|---|
| CZT HV Monitor | 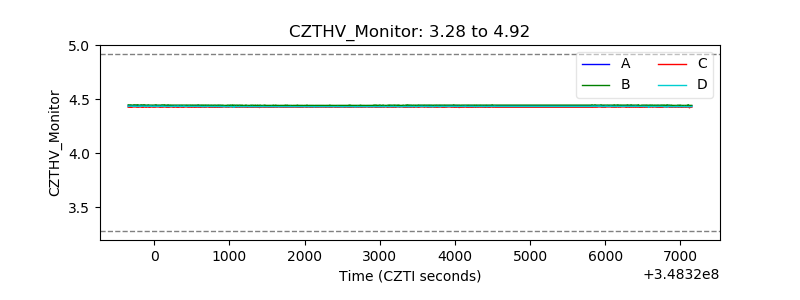 |
| D_VDD | 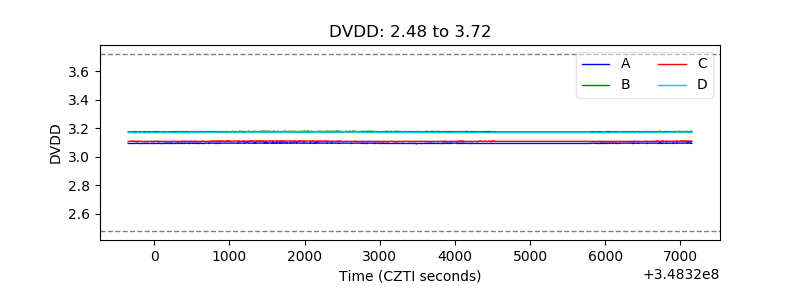 |
| Temperature 1 | 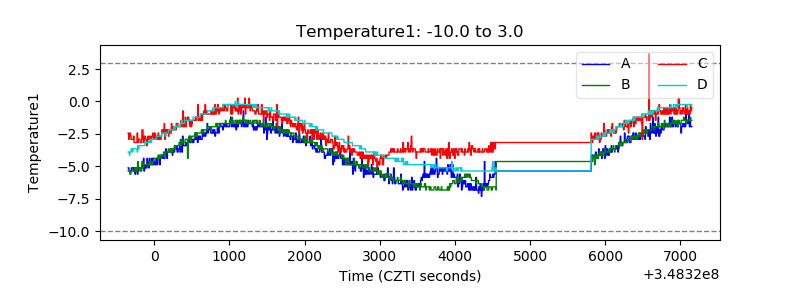 |
| Veto HV Monitor | 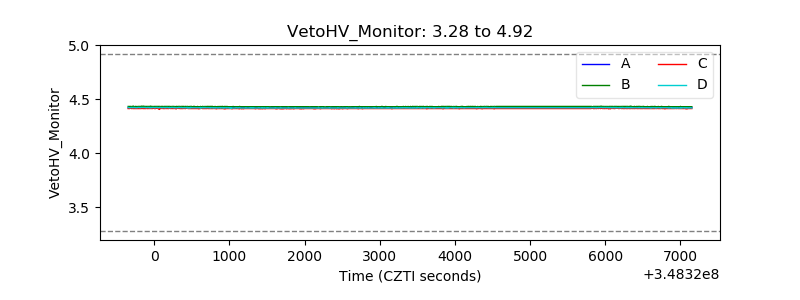 |
| Veto LLD | 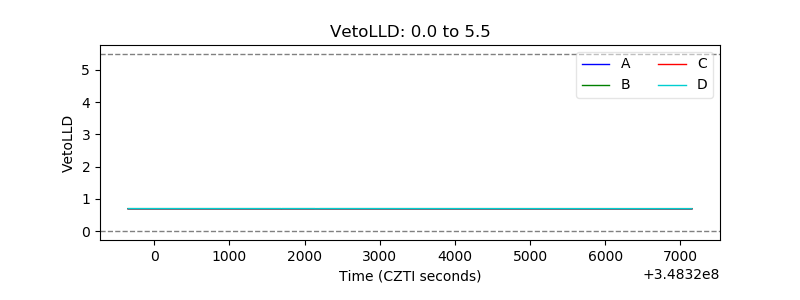 |
| Alpha Counter | 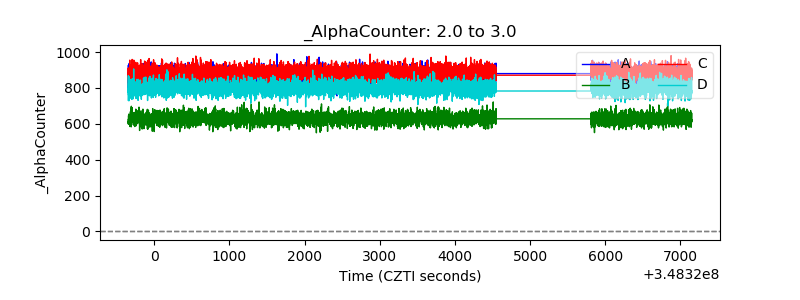 |
| _CPM_Rate | 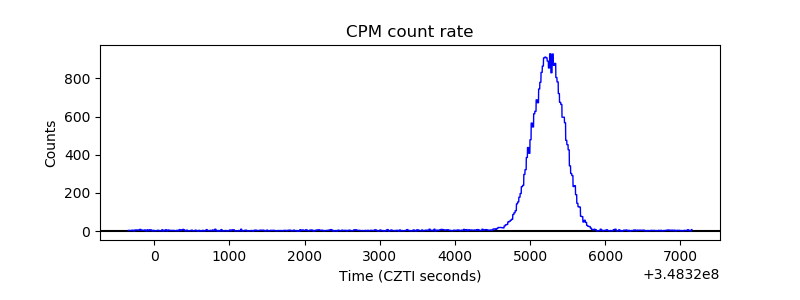 |
| CZT Counter | 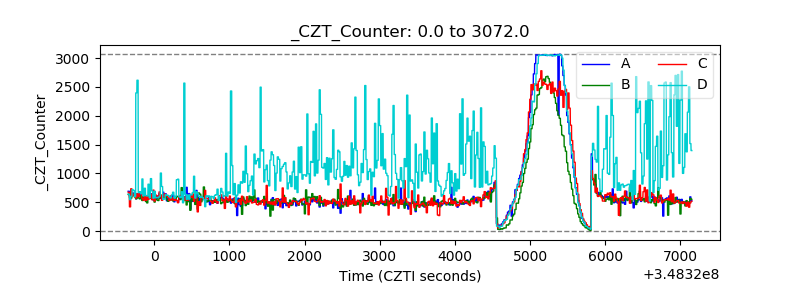 |
| +2.5 Volts monitor |  |
| +5 Volts monitor |  |
| _ROLL_ROT | 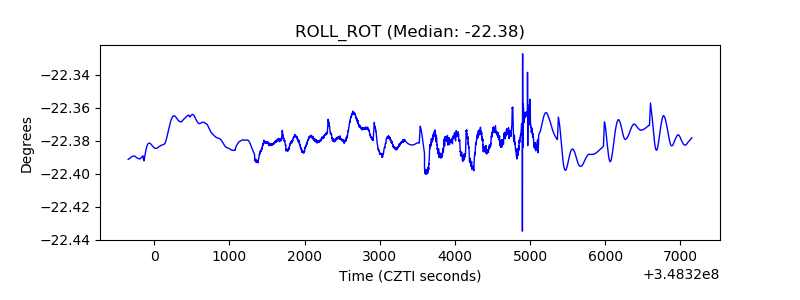 |
| _Roll_DEC | 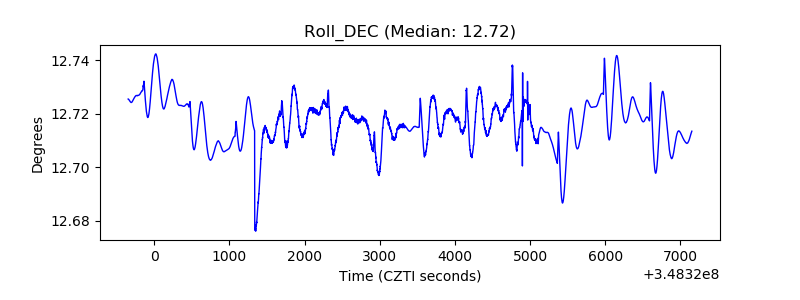 |
| _Roll_RA | 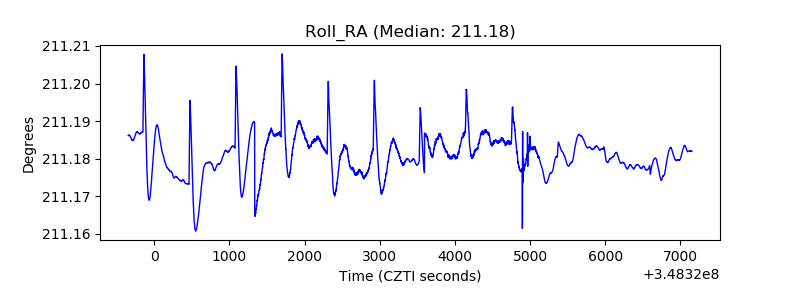 |
| Veto Counter | 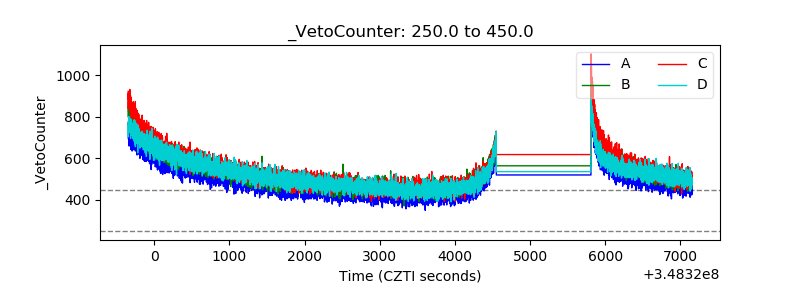 |