| Param | Original file | Final file |
|---|---|---|
| Filename | modeM0/AS1A10_045T07_9000004110_28648cztM0_level2.evt | modeM0/AS1A10_045T07_9000004110_28648cztM0_level2_quad_clean.evt |
| Size (bytes) | 1,181,914,560 | 145,362,240 |
| Size | 1.1 GB | 138.6 MB |
| Events in quadrant A | 6,692,066 | 912,976 |
| Events in quadrant B | 6,677,538 | 924,191 |
| Events in quadrant C | 6,755,810 | 894,995 |
| Events in quadrant D | 14,819,722 | 798,568 |
| Mode SS | |||
|---|---|---|---|
| Quadrant | BADHDUFLAG | Total packets | Discarded packets |
| A | 0 | 254 | 0 |
| B | 0 | 254 | 0 |
| C | 0 | 254 | 0 |
| D | 0 | 254 | 0 |
| Mode M9 | |||
|---|---|---|---|
| Quadrant | BADHDUFLAG | Total packets | Discarded packets |
| A | 0 | 26 | 0 |
| B | 0 | 26 | 0 |
| C | 0 | 26 | 0 |
| D | 0 | 26 | 0 |
| Mode M0 | |||
|---|---|---|---|
| Quadrant | BADHDUFLAG | Total packets | Discarded packets |
| A | 0 | 26878 | 2 |
| B | 0 | 26840 | 2 |
| C | 0 | 27089 | 2 |
| D | 0 | 52973 | 2 |
| Quadrant | Total seconds | Saturated seconds | Saturation percentage |
|---|---|---|---|
| A | 12605 | 129 | 1.023403% |
| B | 12606 | 146 | 1.158179% |
| C | 12606 | 248 | 1.967317% |
| D | 12606 | 2038 | 16.166905% |
Noise dominated data is calculated using 1-second bins in cleaned event files. If a bin has >2000 counts, and if more than 50% of those come from <1% of pixels, then it is considered to be noise-dominated and hence unusable.
| Quadrant | # 1 sec bins | Bins with >0 counts | Bins with >2000 counts | High rate bins dominated by noise | Noise dominated (total time) | Noise dominated (detector-on time) | Marked lightcurve |
|---|---|---|---|---|---|---|---|
| A | 15165 | 12607 | 3 | 3 | 0.02% | 0.02% | 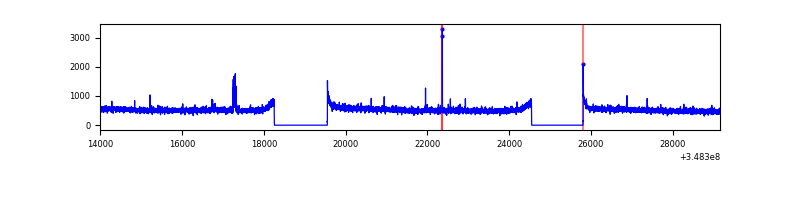 |
| B | 15166 | 12608 | 5 | 5 | 0.03% | 0.04% | 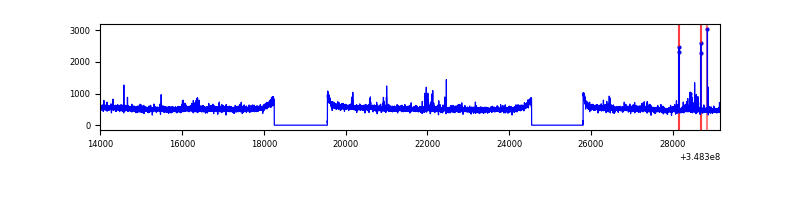 |
| C | 15166 | 12608 | 0 | 0 | 0.00% | 0.00% | 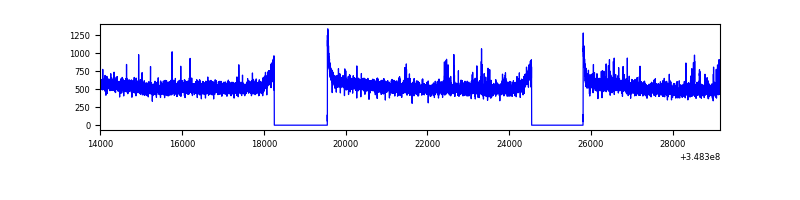 |
| D | 15166 | 12608 | 1871 | 1871 | 12.34% | 14.84% | 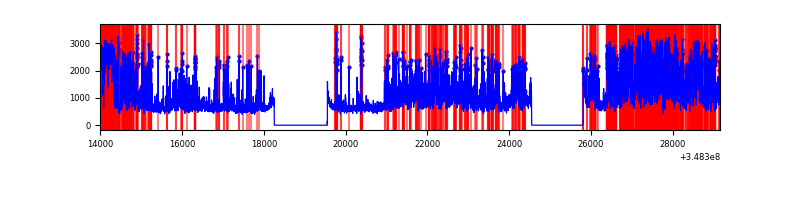 |
Top three noisy pixels from each quadrant. If the there are fewer than three noisy pixels in the level2.evt file, extra rows are filled as -1
| Pixel properties | Quadrant properties | ||||||
|---|---|---|---|---|---|---|---|
| Quadrant | DetID | PixID | Counts | Sigma | Mean | Median | Sigma |
| A | 15 | 174 | 59200 | 169.65 | 1707 | 1675 | 339.1 |
| A | 13 | 254 | 24657 | 67.78 | 1707 | 1675 | 339.1 |
| A | 12 | 16 | 19869 | 53.66 | 1707 | 1675 | 339.1 |
| B | 10 | 247 | 37856 | 116.78 | 1672 | 1636 | 310.2 |
| B | 12 | 111 | 37120 | 114.41 | 1672 | 1636 | 310.2 |
| B | 11 | 111 | 33851 | 103.87 | 1672 | 1636 | 310.2 |
| C | 14 | 238 | 293031 | 772.35 | 1640 | 1655 | 377.3 |
| C | 14 | 254 | 41276 | 105.02 | 1640 | 1655 | 377.3 |
| C | 7 | 247 | 16340 | 38.93 | 1640 | 1655 | 377.3 |
| D | 1 | 52 | 6355762 | 17298.83 | 1557 | 1518 | 367.3 |
| D | 8 | 195 | 2112522 | 5747.01 | 1557 | 1518 | 367.3 |
| D | 2 | 250 | 185326 | 500.4 | 1557 | 1518 | 367.3 |
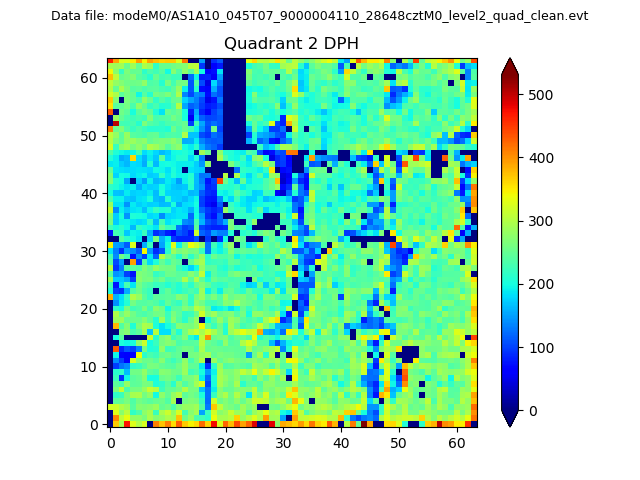
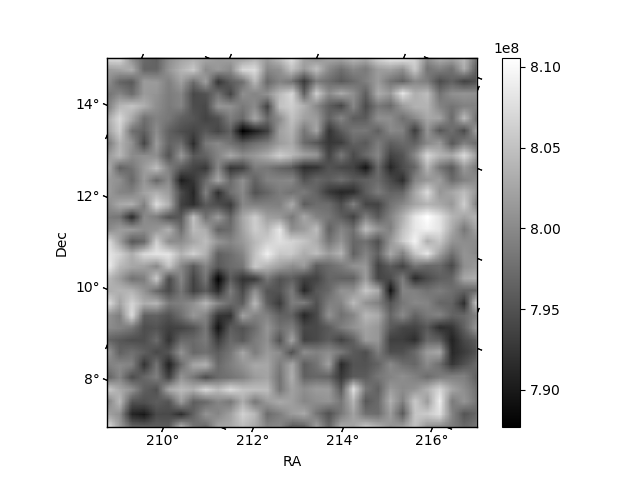
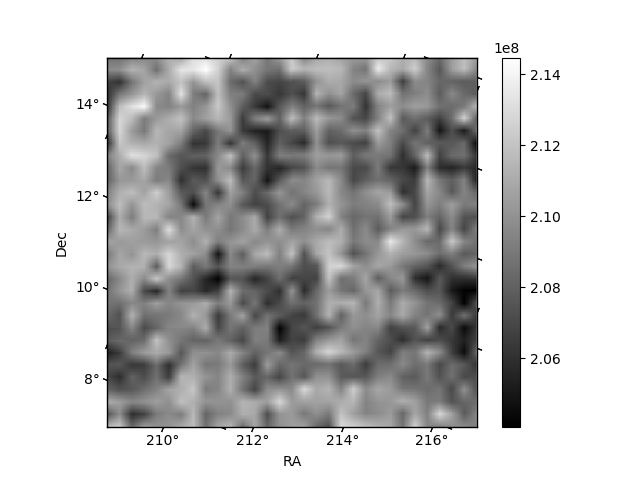
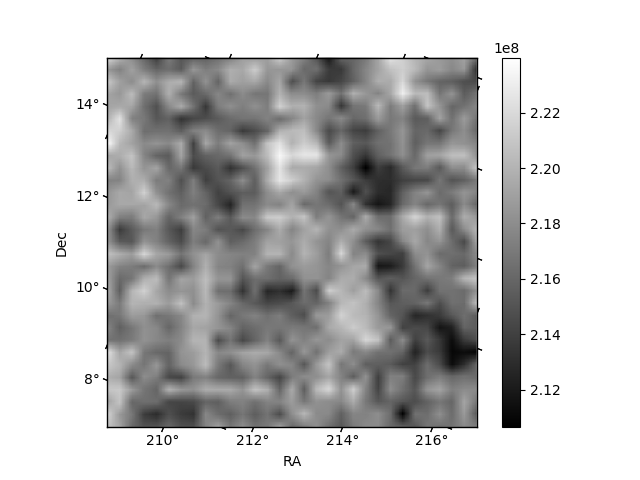
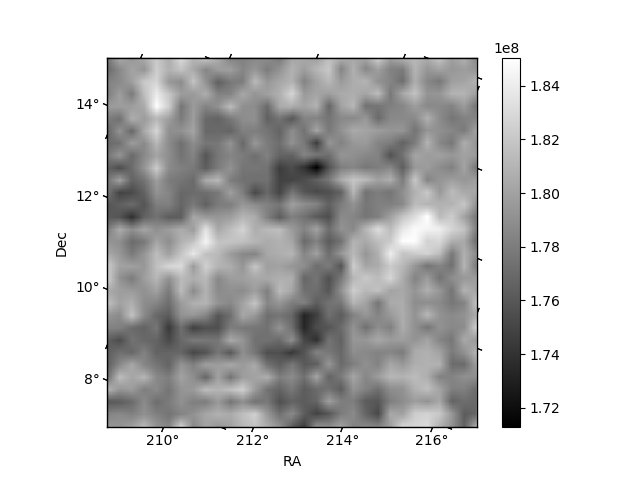
Histogram calculated using DETX and DETY for each event in the final _common_clean file
| Quadrant A | 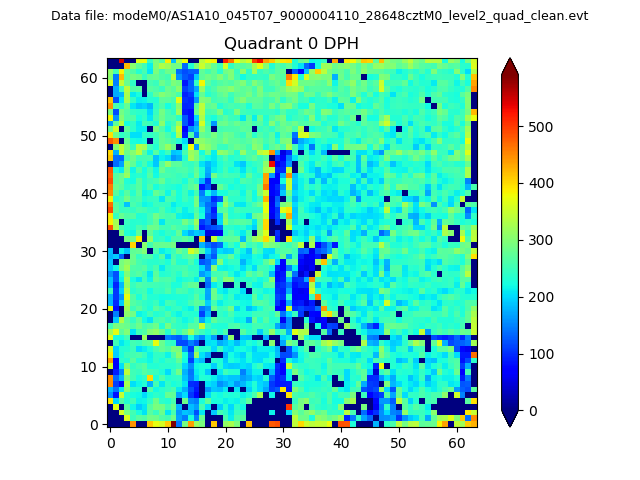 |
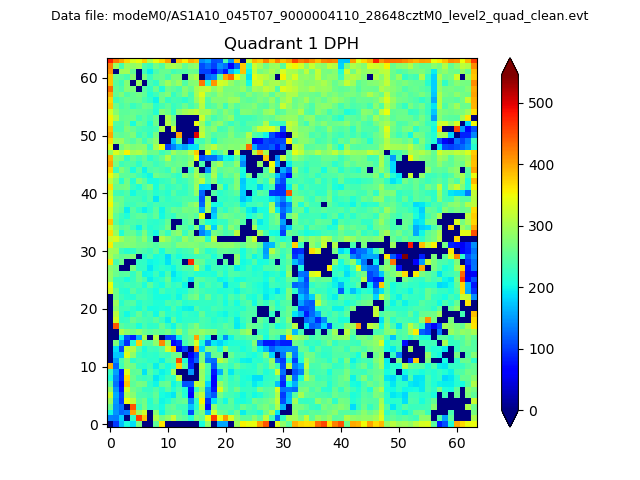 |
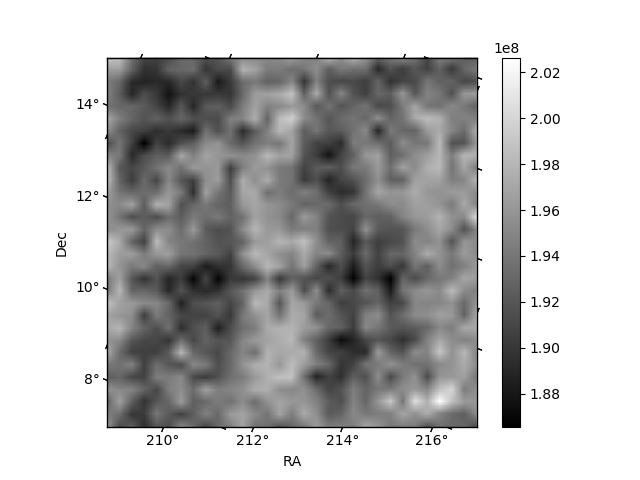
Quadrant B |
|---|---|---|---|
| Quadrant D | 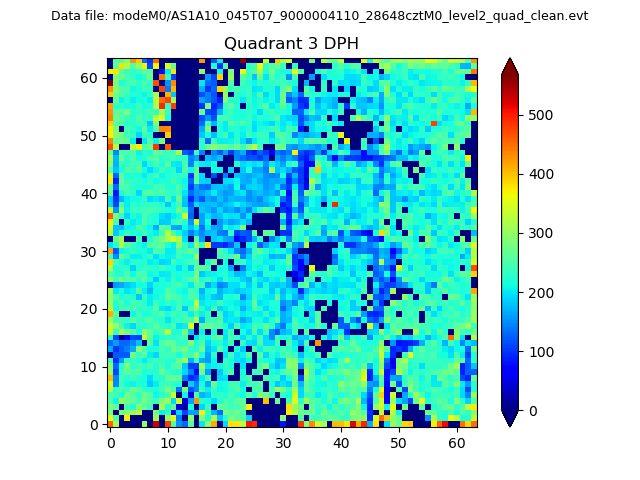 |
 |
Quadrant C |
| Plot type | Count rate plots | Images |
|---|---|---|
| Comparison with Poisson distribution Blue bars denote a histogram of data divided into 1 sec bins. Red curve is a Poisson curve with rate = median count rate of data. |
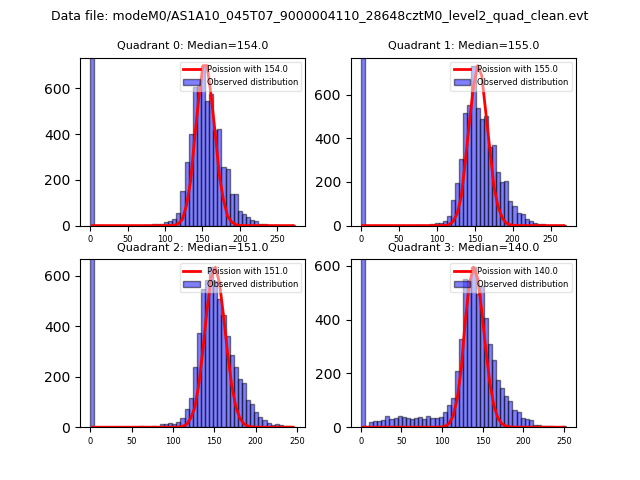 |
 |
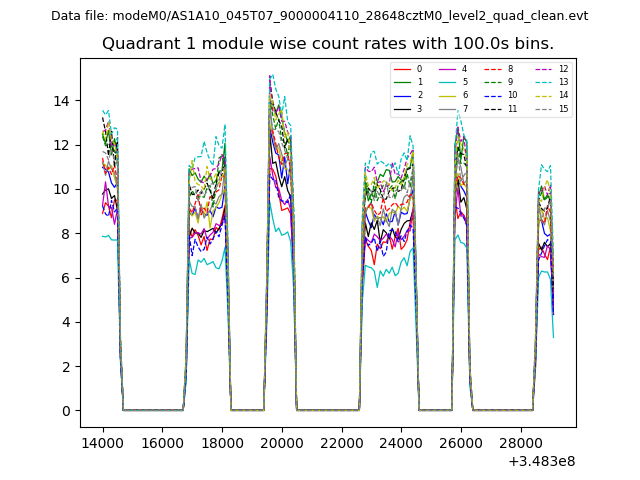
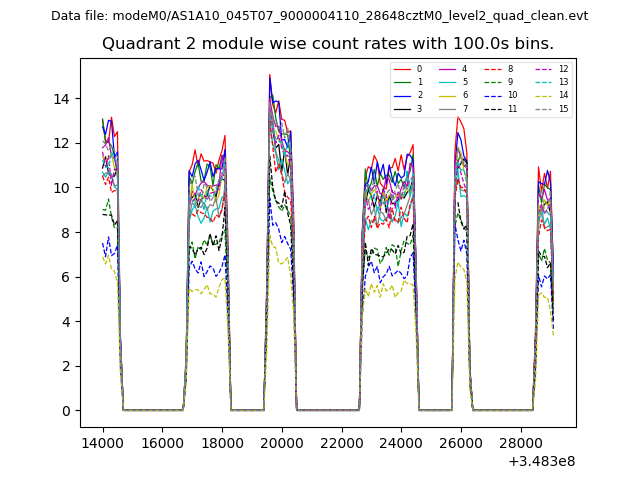
| Quadrant-wise count rates Data is divided into 100 sec bins |
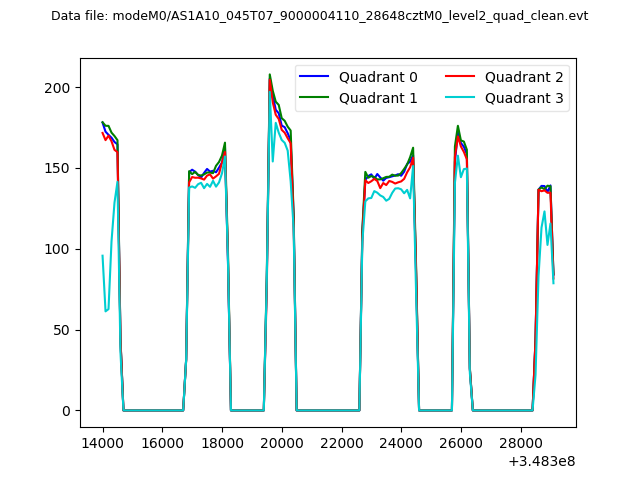 |
|
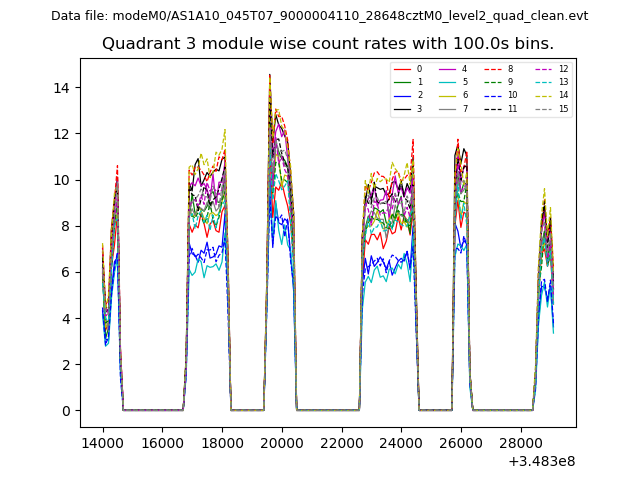
| Module-wise count rates for Quadrant A Data is divided into 100 sec bins |
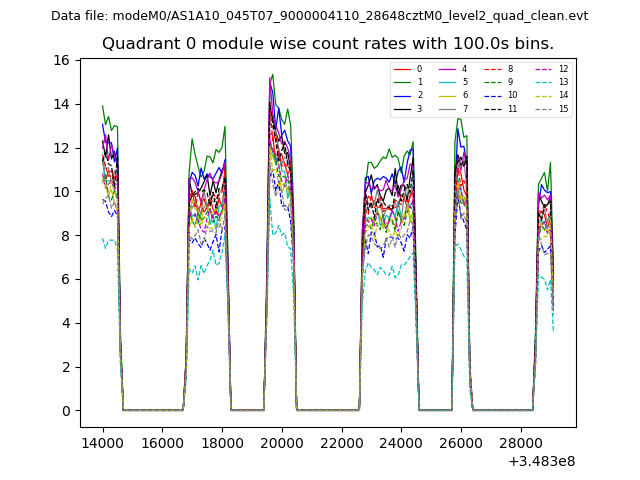 |
 |
| Module-wise count rates for Quadrant B Data is divided into 100 sec bins |
 |
 |
| Module-wise count rates for Quadrant C Data is divided into 100 sec bins |
 |
 |
| Module-wise count rates for Quadrant D Data is divided into 100 sec bins |
 |
 |
| Parameter | Plot |
|---|---|
| CZT HV Monitor | 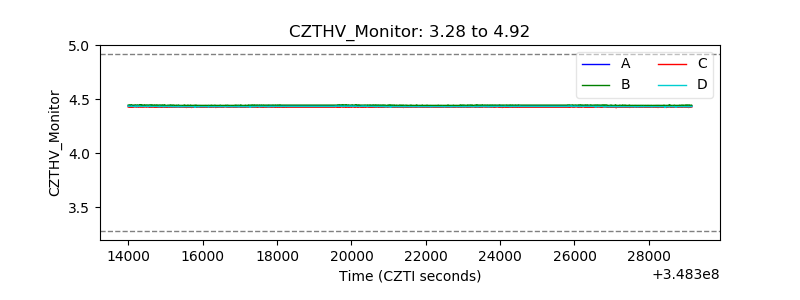 |
| D_VDD | 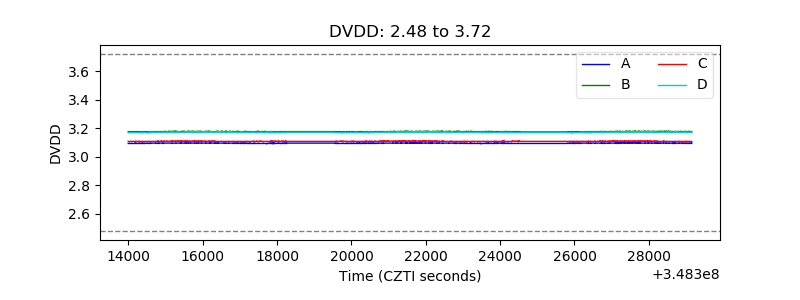 |
| Temperature 1 | 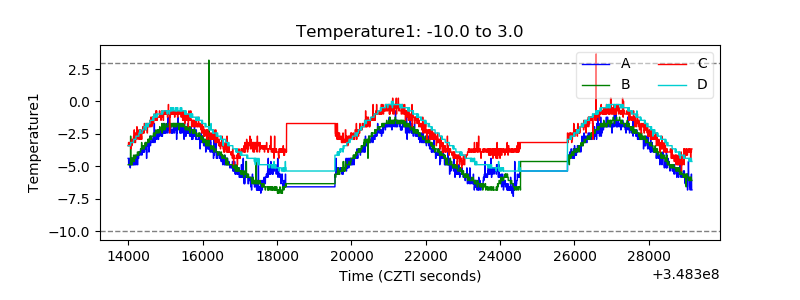 |
| Veto HV Monitor | 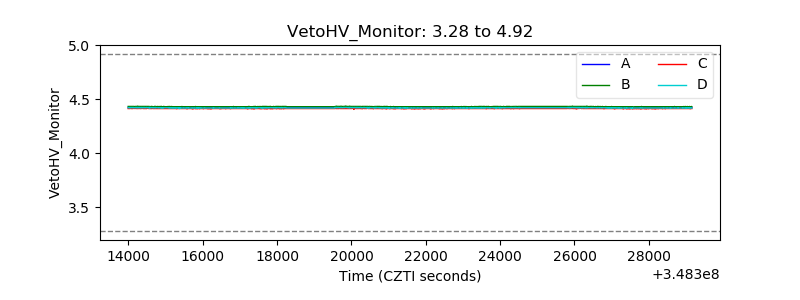 |
| Veto LLD | 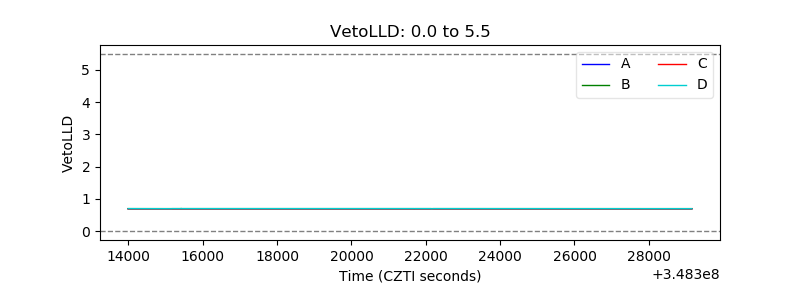 |
| Alpha Counter | 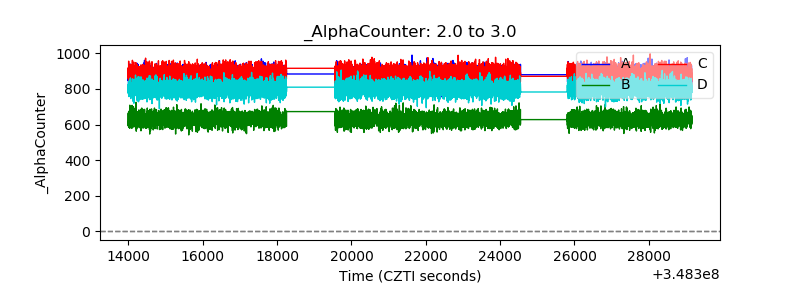 |
| _CPM_Rate | 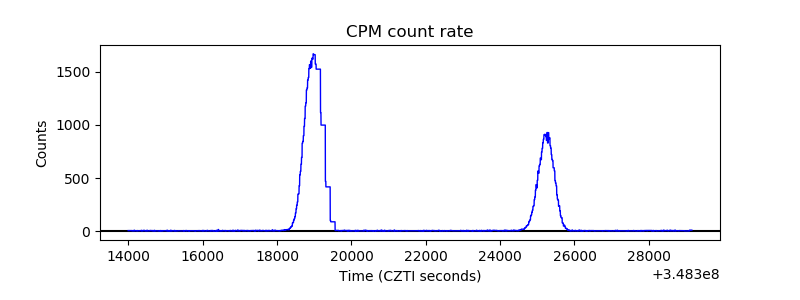 |
| CZT Counter | 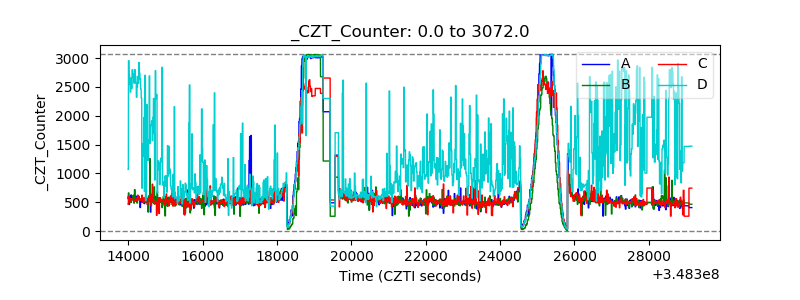 |
| +2.5 Volts monitor |  |
| +5 Volts monitor | 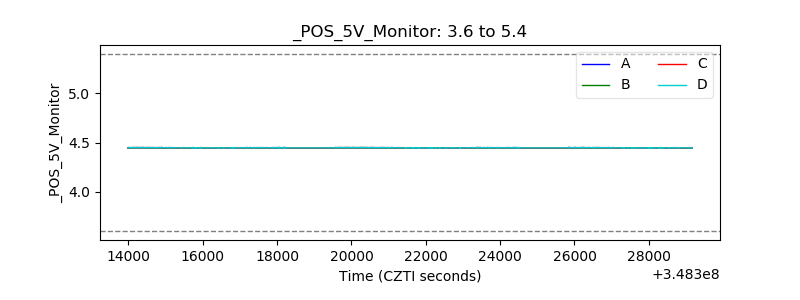 |
| _ROLL_ROT | 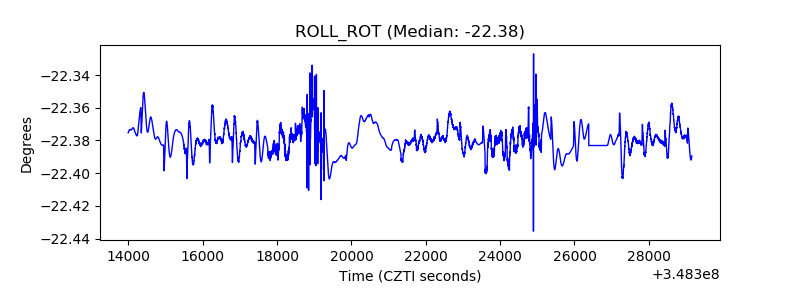 |
| _Roll_DEC | 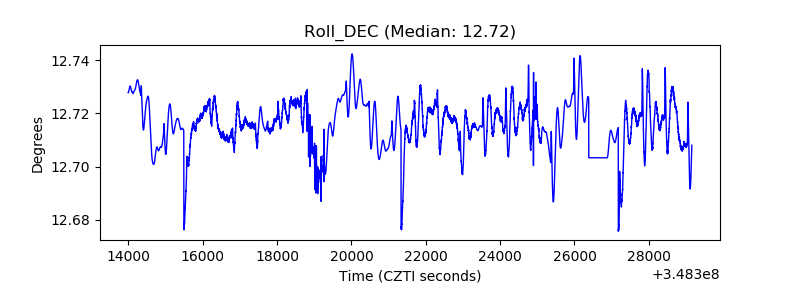 |
| _Roll_RA | 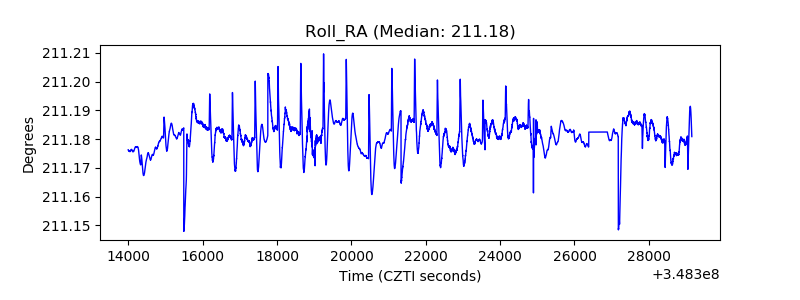 |
| Veto Counter | 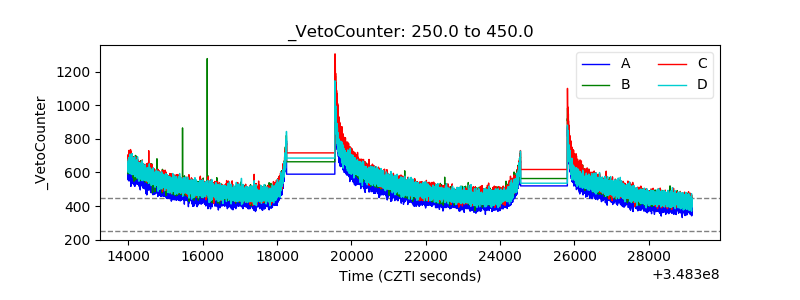 |