| Param | Original file | Final file |
|---|---|---|
| Filename | modeM0/AS1A10_073T08_9000004112cztM0_level2.fits | modeM0/AS1A10_073T08_9000004112cztM0_level2_quad_clean.evt |
| Size (bytes) | 964,212,480 | 789,765,120 |
| Size | 919.5 MB | 753.2 MB |
| Events in quadrant A | 6,101,218 | 4,630,162 |
| Events in quadrant B | 5,707,796 | 4,555,886 |
| Events in quadrant C | 5,799,498 | 4,346,918 |
| Events in quadrant D | 5,003,582 | 3,798,098 |
| Mode M0 | |||
|---|---|---|---|
| Quadrant | BADHDUFLAG | Total packets | Discarded packets |
| A | 0 | 213200 | 0 |
| B | 0 | 237488 | 0 |
| C | 0 | 207161 | 0 |
| D | 0 | 293683 | 0 |
| Mode SS | |||
|---|---|---|---|
| Quadrant | BADHDUFLAG | Total packets | Discarded packets |
| A | 0 | 1954 | 0 |
| B | 0 | 1954 | 0 |
| C | 0 | 1954 | 0 |
| D | 0 | 1954 | 0 |
| Mode M9 | |||
|---|---|---|---|
| Quadrant | BADHDUFLAG | Total packets | Discarded packets |
| A | 0 | 135 | 0 |
| B | 0 | 135 | 0 |
| C | 0 | 135 | 0 |
| D | 0 | 135 | 0 |
| Quadrant | Total seconds | Saturated seconds | Saturation percentage |
|---|---|---|---|
| A | 96074 | 2186 | 2.275329% |
| B | 96073 | 4522 | 4.706838% |
| C | 96074 | 3723 | 3.875138% |
| D | 96074 | 6611 | 6.881154% |
Noise dominated data is calculated using 1-second bins in cleaned event files. If a bin has >2000 counts, and if more than 50% of those come from <1% of pixels, then it is considered to be noise-dominated and hence unusable.
| Quadrant | # 1 sec bins | Bins with >0 counts | Bins with >2000 counts | High rate bins dominated by noise | Noise dominated (total time) | Noise dominated (detector-on time) | Marked lightcurve |
|---|---|---|---|---|---|---|---|
| A | 109409 | 96064 | 0 | 0 | 0.00% | 0.00% | 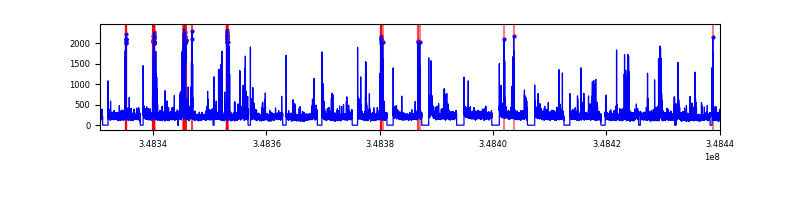 |
| B | 109410 | 96064 | 0 | 0 | 0.00% | 0.00% |  |
| C | 109409 | 95998 | 0 | 0 | 0.00% | 0.00% |  |
| D | 109410 | 95915 | 0 | 0 | 0.00% | 0.00% | 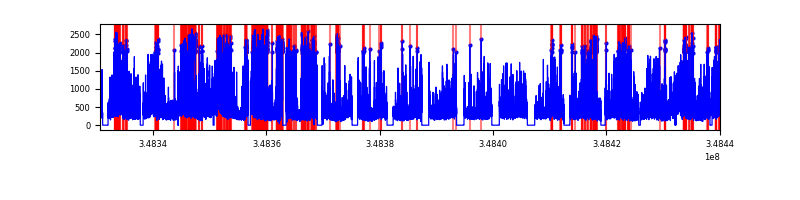 |
Top three noisy pixels from each quadrant. If the there are fewer than three noisy pixels in the level2.evt file, extra rows are filled as -1
| Pixel properties | Quadrant properties | ||||||
|---|---|---|---|---|---|---|---|
| Quadrant | DetID | PixID | Counts | Sigma | Mean | Median | Sigma |
| A | 0 | 29 | 5658 | 10.74 | 1589 | 1493 | 387.8 |
| A | 7 | 110 | 4795 | 8.51 | 1589 | 1493 | 387.8 |
| A | 0 | 30 | 4483 | 7.71 | 1589 | 1493 | 387.8 |
| B | 2 | 9 | 4457 | 10.14 | 1513 | 1445 | 296.9 |
| B | 3 | 80 | 3925 | 8.35 | 1513 | 1445 | 296.9 |
| B | 3 | 17 | 3826 | 8.02 | 1513 | 1445 | 296.9 |
| C | 3 | 126 | 3967 | 6.52 | 1533 | 1431 | 388.9 |
| C | 12 | 241 | 3895 | 6.34 | 1533 | 1431 | 388.9 |
| C | 9 | 209 | 3836 | 6.18 | 1533 | 1431 | 388.9 |
| D | 3 | 14 | 3676 | 6.28 | 1429 | 1303 | 378.0 |
| D | 15 | 46 | 3645 | 6.2 | 1429 | 1303 | 378.0 |
| D | 6 | 231 | 3540 | 5.92 | 1429 | 1303 | 378.0 |
Histogram calculated using DETX and DETY for each event in the final _common_clean file
| Quadrant A | 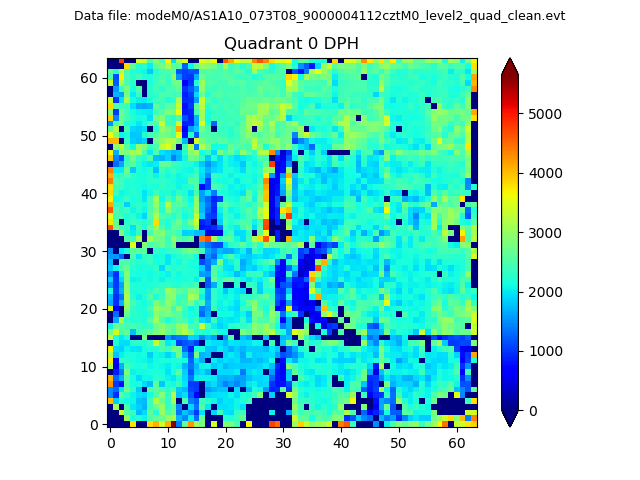 |
 |
Quadrant B |
|---|---|---|---|
| Quadrant D | 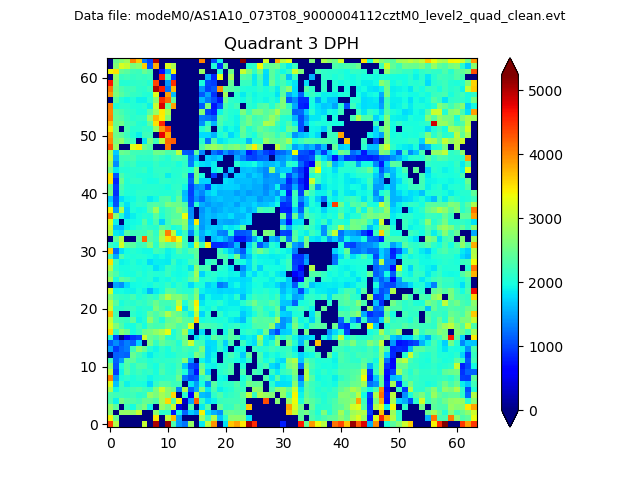 |
 |
Quadrant C |
| Plot type | Count rate plots | Images |
|---|---|---|
| Comparison with Poisson distribution Blue bars denote a histogram of data divided into 1 sec bins. Red curve is a Poisson curve with rate = median count rate of data. |
 |
 |
| Quadrant-wise count rates Data is divided into 100 sec bins |
 |
|
| Module-wise count rates for Quadrant A Data is divided into 100 sec bins |
 |
 |
| Module-wise count rates for Quadrant B Data is divided into 100 sec bins |
 |
 |
| Module-wise count rates for Quadrant C Data is divided into 100 sec bins |
 |
 |
| Module-wise count rates for Quadrant D Data is divided into 100 sec bins |
 |
 |
| Parameter | Plot |
|---|---|
| CZT HV Monitor |  |
| D_VDD | 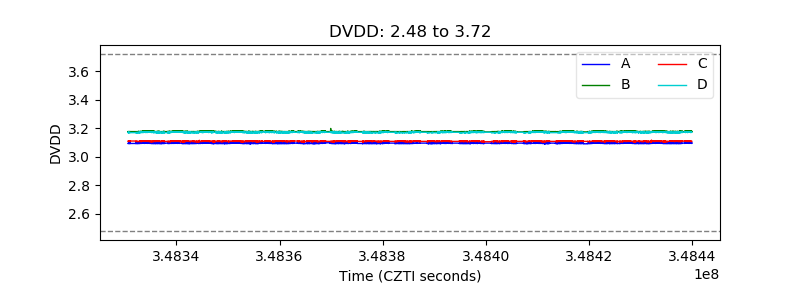 |
| Temperature 1 | 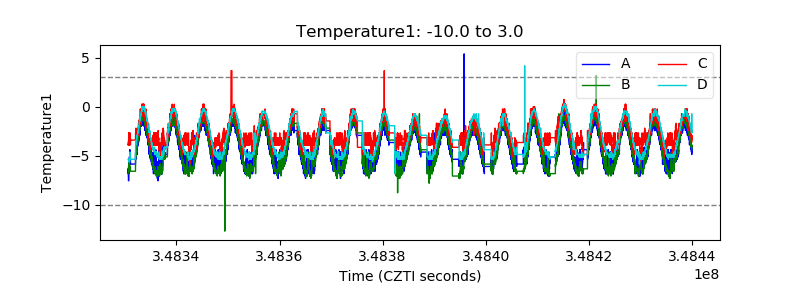 |
| Veto HV Monitor |  |
| Veto LLD |  |
| Alpha Counter |  |
| _CPM_Rate |  |
| CZT Counter | 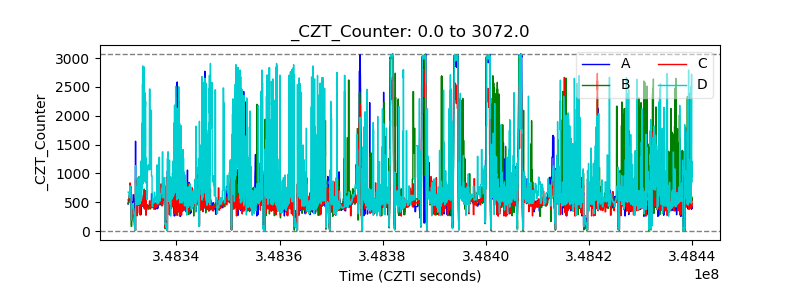 |
| +2.5 Volts monitor |  |
| +5 Volts monitor |  |
| _ROLL_ROT | 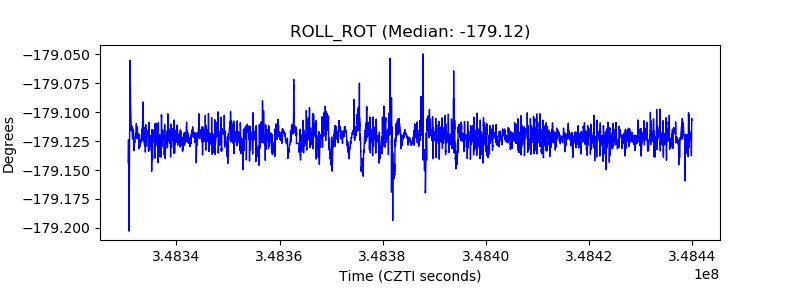 |
| _Roll_DEC |  |
| _Roll_RA | 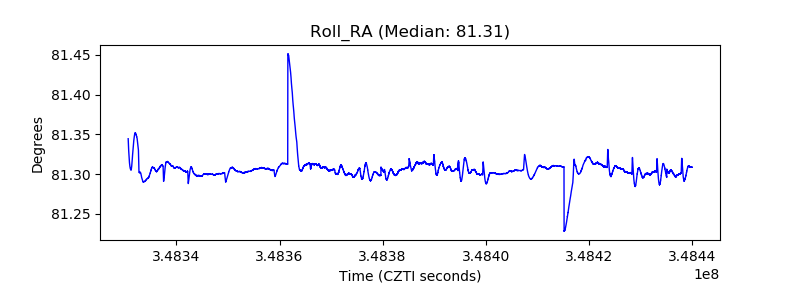 |
| Veto Counter | 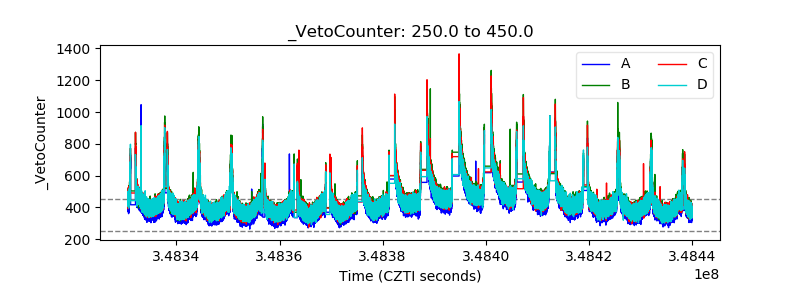 |