| Param | Original file | Final file |
|---|---|---|
| Filename | modeM0/AS1A10_073T08_9000004112_28648cztM0_level2.evt | modeM0/AS1A10_073T08_9000004112_28648cztM0_level2_quad_clean.evt |
| Size (bytes) | 173,070,720 | 29,894,400 |
| Size | 165.1 MB | 28.5 MB |
| Events in quadrant A | 1,099,410 | 194,357 |
| Events in quadrant B | 1,136,544 | 198,252 |
| Events in quadrant C | 1,113,833 | 189,020 |
| Events in quadrant D | 1,752,301 | 176,495 |
| Mode M0 | |||
|---|---|---|---|
| Quadrant | BADHDUFLAG | Total packets | Discarded packets |
| A | 0 | 4386 | 2 |
| B | 0 | 4542 | 3 |
| C | 0 | 4477 | 1 |
| D | 0 | 6667 | 1 |
| Mode SS | |||
|---|---|---|---|
| Quadrant | BADHDUFLAG | Total packets | Discarded packets |
| A | 0 | 42 | 0 |
| B | 0 | 42 | 0 |
| C | 0 | 42 | 0 |
| D | 0 | 42 | 0 |
| Mode M9 | |||
|---|---|---|---|
| Quadrant | BADHDUFLAG | Total packets | Discarded packets |
| A | 0 | 10 | 0 |
| B | 0 | 10 | 0 |
| C | 0 | 10 | 0 |
| D | 0 | 10 | 0 |
| Quadrant | Total seconds | Saturated seconds | Saturation percentage |
|---|---|---|---|
| A | 2019 | 96 | 4.754829% |
| B | 2018 | 110 | 5.450942% |
| C | 2019 | 139 | 6.884596% |
| D | 2019 | 194 | 9.608717% |
Noise dominated data is calculated using 1-second bins in cleaned event files. If a bin has >2000 counts, and if more than 50% of those come from <1% of pixels, then it is considered to be noise-dominated and hence unusable.
| Quadrant | # 1 sec bins | Bins with >0 counts | Bins with >2000 counts | High rate bins dominated by noise | Noise dominated (total time) | Noise dominated (detector-on time) | Marked lightcurve |
|---|---|---|---|---|---|---|---|
| A | 2989 | 2020 | 0 | 0 | 0.00% | 0.00% | 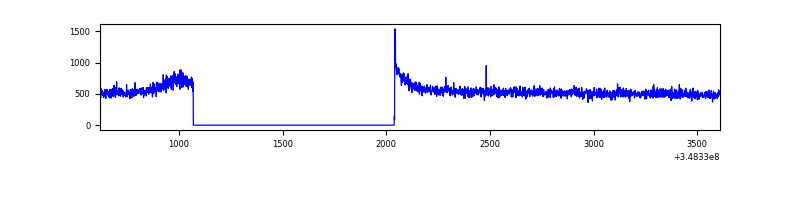 |
| B | 2989 | 2020 | 0 | 0 | 0.00% | 0.00% | 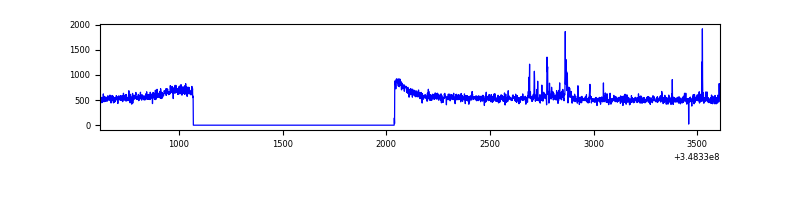 |
| C | 2989 | 2020 | 0 | 0 | 0.00% | 0.00% | 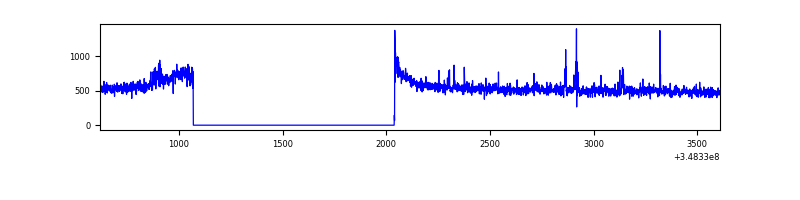 |
| D | 2989 | 2020 | 118 | 118 | 3.95% | 5.84% | 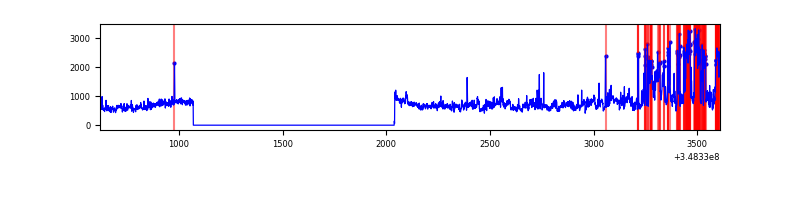 |
Top three noisy pixels from each quadrant. If the there are fewer than three noisy pixels in the level2.evt file, extra rows are filled as -1
| Pixel properties | Quadrant properties | ||||||
|---|---|---|---|---|---|---|---|
| Quadrant | DetID | PixID | Counts | Sigma | Mean | Median | Sigma |
| A | 13 | 254 | 3766 | 59.28 | 283 | 276 | 58.9 |
| A | 8 | 192 | 3561 | 55.8 | 283 | 276 | 58.9 |
| A | 3 | 137 | 2720 | 41.52 | 283 | 276 | 58.9 |
| B | 4 | 80 | 18832 | 329.46 | 278 | 271 | 56.3 |
| B | 10 | 245 | 7464 | 127.68 | 278 | 271 | 56.3 |
| B | 0 | 190 | 7189 | 122.79 | 278 | 271 | 56.3 |
| C | 14 | 238 | 52813 | 817.48 | 266 | 267 | 64.3 |
| C | 14 | 254 | 15518 | 237.26 | 266 | 267 | 64.3 |
| C | 0 | 10 | 3306 | 47.28 | 266 | 267 | 64.3 |
| D | 1 | 52 | 400518 | 5943.06 | 269 | 261 | 67.3 |
| D | 8 | 195 | 305387 | 4530.54 | 269 | 261 | 67.3 |
| D | 12 | 233 | 10951 | 158.73 | 269 | 261 | 67.3 |
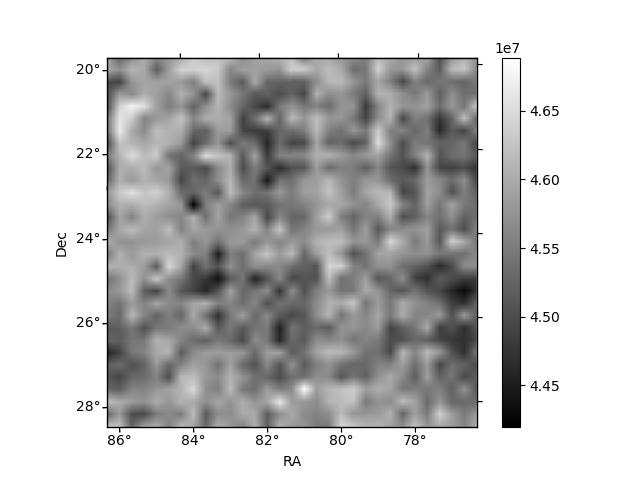
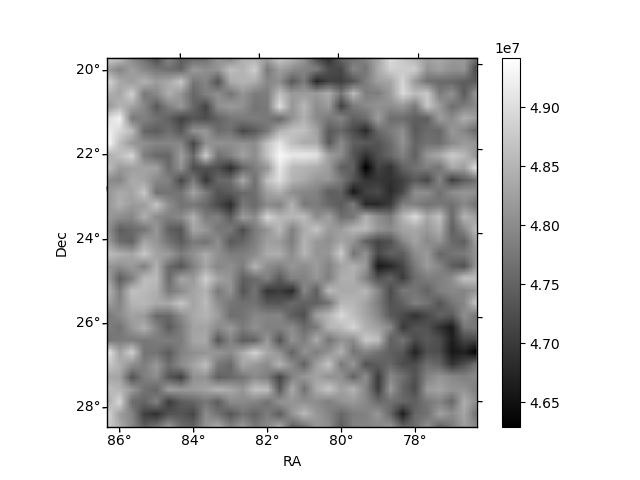
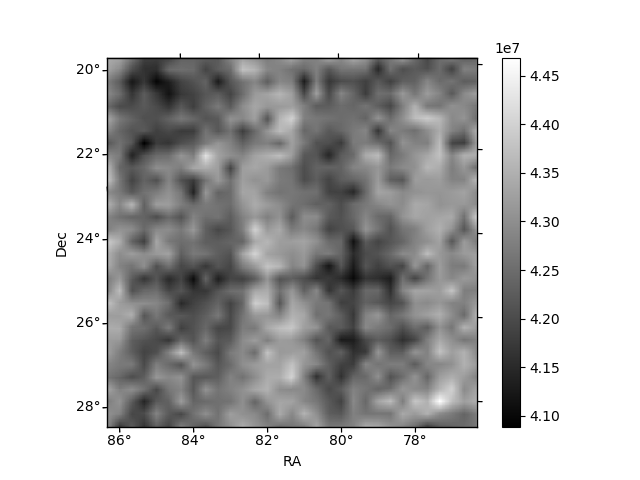
Histogram calculated using DETX and DETY for each event in the final _common_clean file
| Quadrant A | 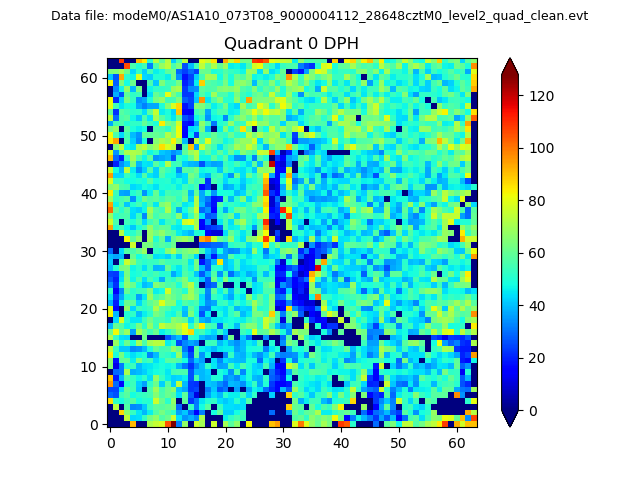 |
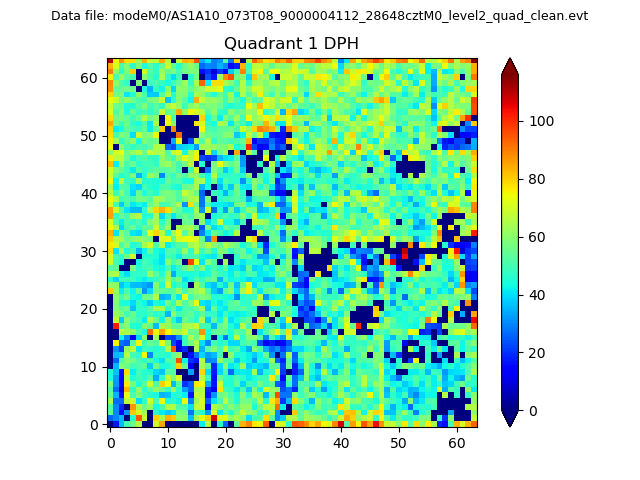 |
Quadrant B |
|---|---|---|---|
| Quadrant D | 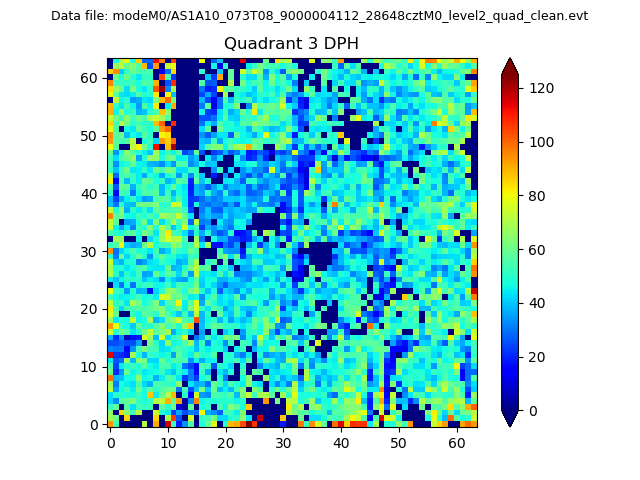 |
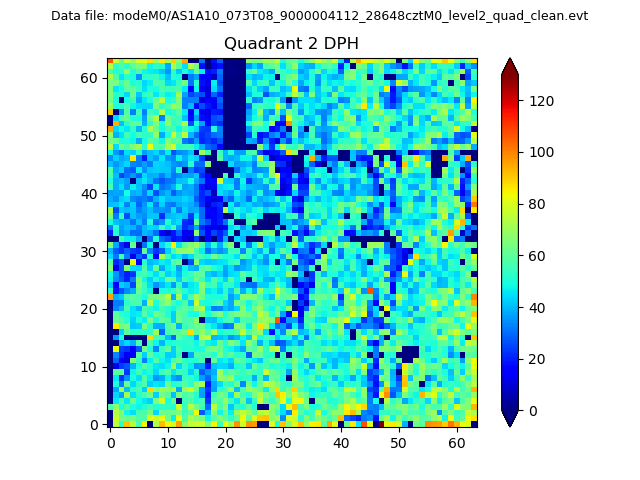 |
Quadrant C |
| Plot type | Count rate plots | Images |
|---|---|---|
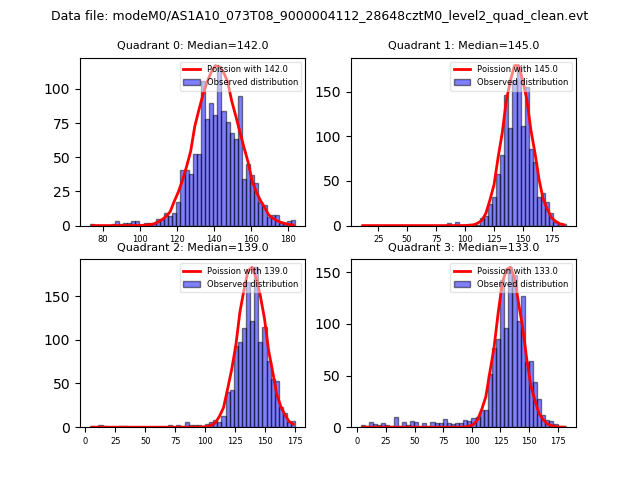
| Comparison with Poisson distribution Blue bars denote a histogram of data divided into 1 sec bins. Red curve is a Poisson curve with rate = median count rate of data. |
 |
 |
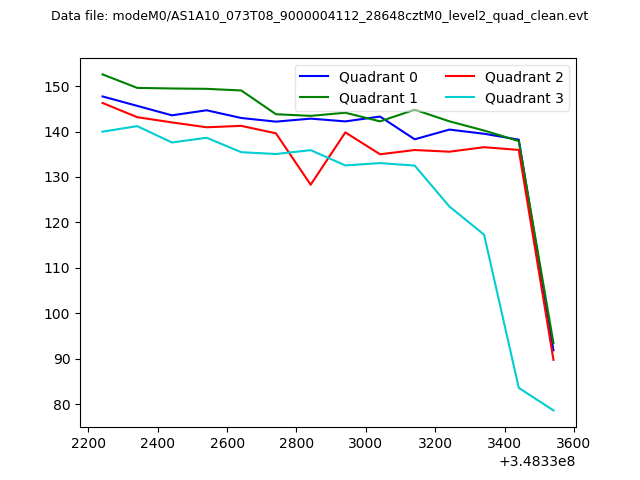
| Quadrant-wise count rates Data is divided into 100 sec bins |
 |
|
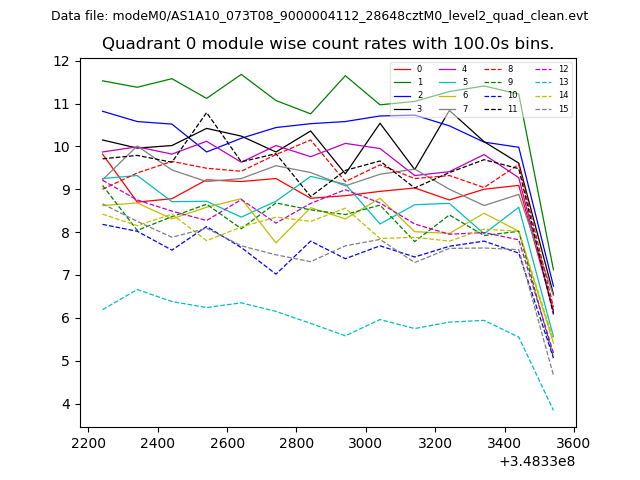
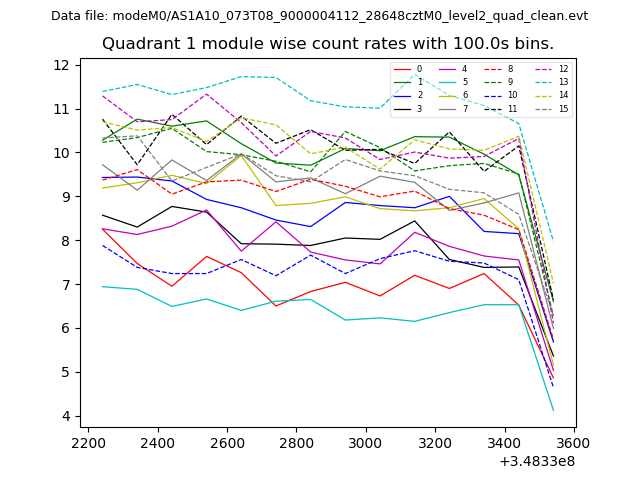
| Module-wise count rates for Quadrant A Data is divided into 100 sec bins |
 |
 |
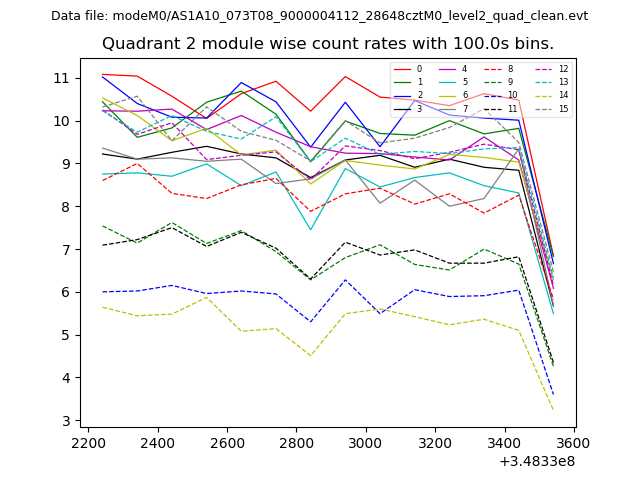
| Module-wise count rates for Quadrant B Data is divided into 100 sec bins |
 |
 |
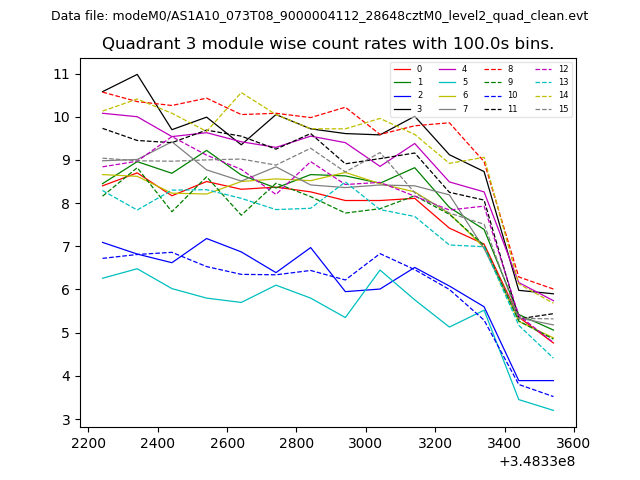
| Module-wise count rates for Quadrant C Data is divided into 100 sec bins |
 |
 |
| Module-wise count rates for Quadrant D Data is divided into 100 sec bins |
 |
 |
| Parameter | Plot |
|---|---|
| CZT HV Monitor | 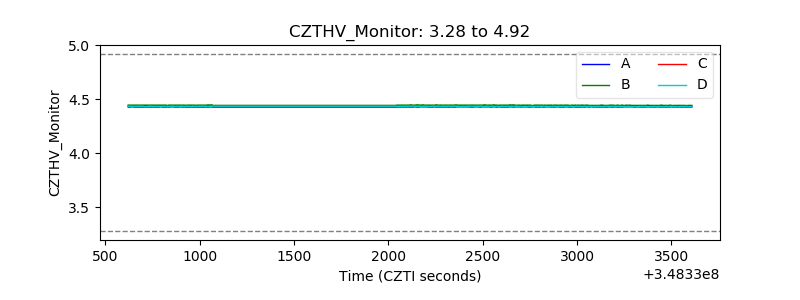 |
| D_VDD | 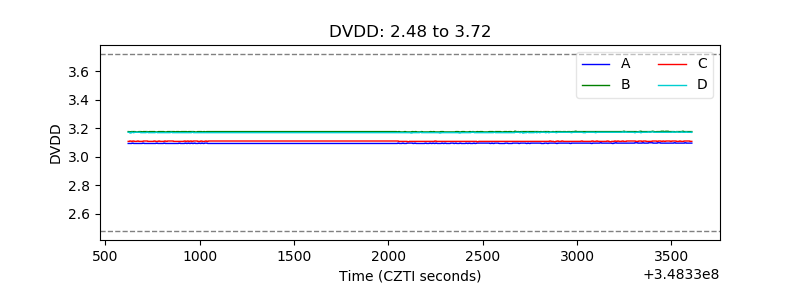 |
| Temperature 1 | 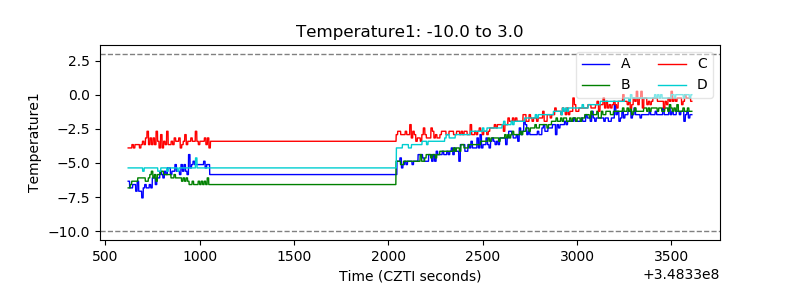 |
| Veto HV Monitor | 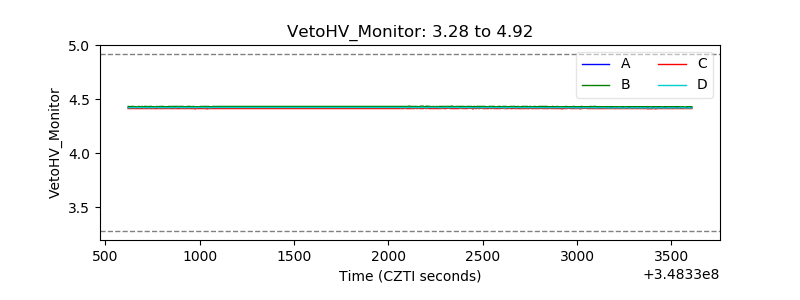 |
| Veto LLD | 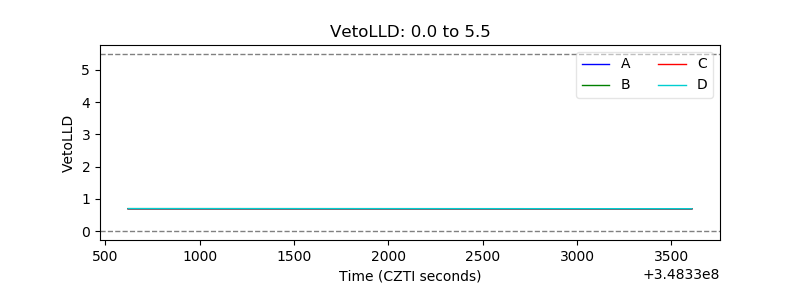 |
| Alpha Counter | 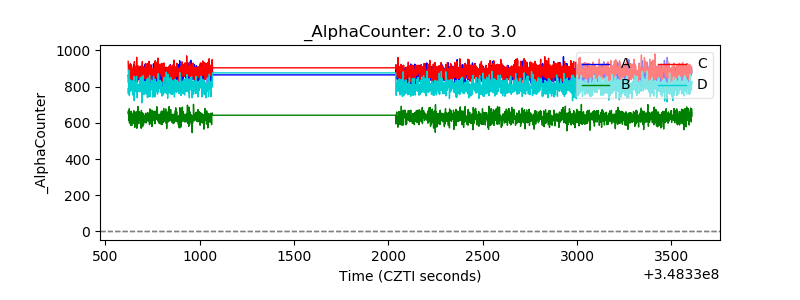 |
| _CPM_Rate | 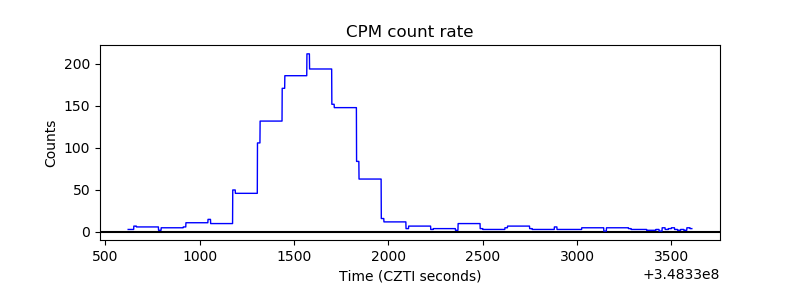 |
| CZT Counter | 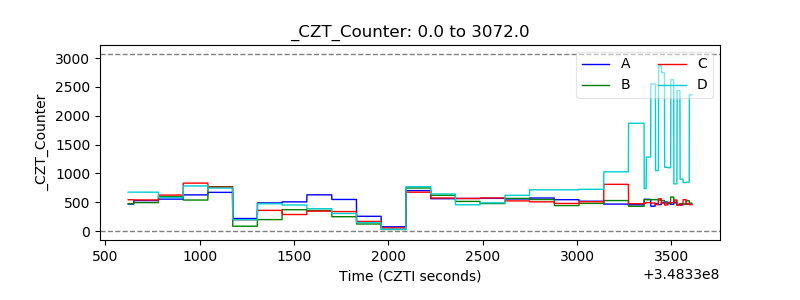 |
| +2.5 Volts monitor | 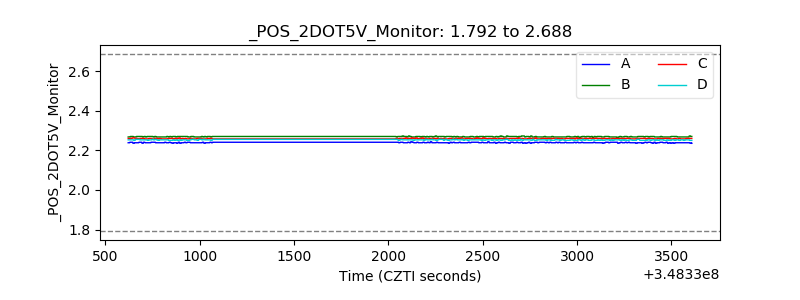 |
| +5 Volts monitor |  |
| _ROLL_ROT | 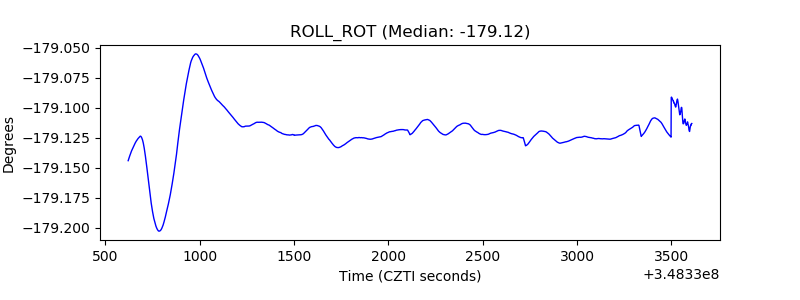 |
| _Roll_DEC | 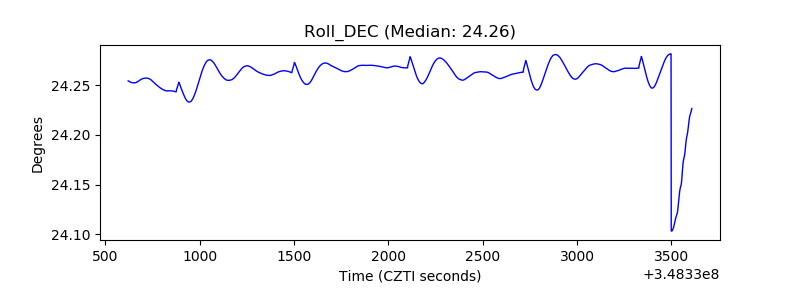 |
| _Roll_RA | 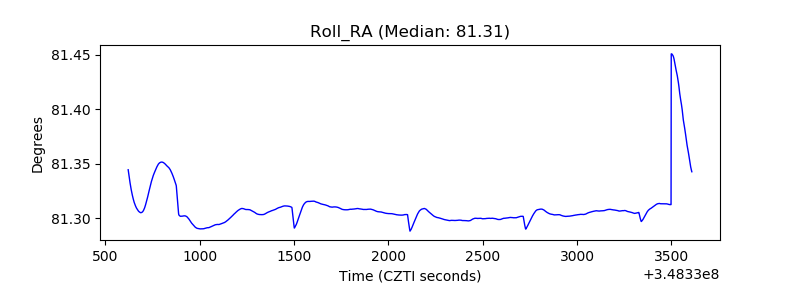 |
| Veto Counter | 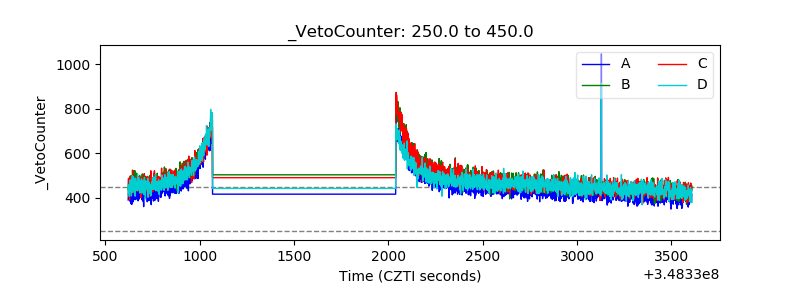 |